. 2023 Aug 24:11:1207642.
doi: 10.3389/fcell.2023.1207642. eCollection 2023.

Molecular subtyping of acute myeloid leukemia through ferroptosis signatures predicts prognosis and deciphers the immune microenvironment

Affiliations

Molecular subtyping of acute myeloid leukemia through ferroptosis signatures predicts prognosis and deciphers the immune microenvironment

Denggang Fu et al. Front Cell Dev Biol. .

Abstract

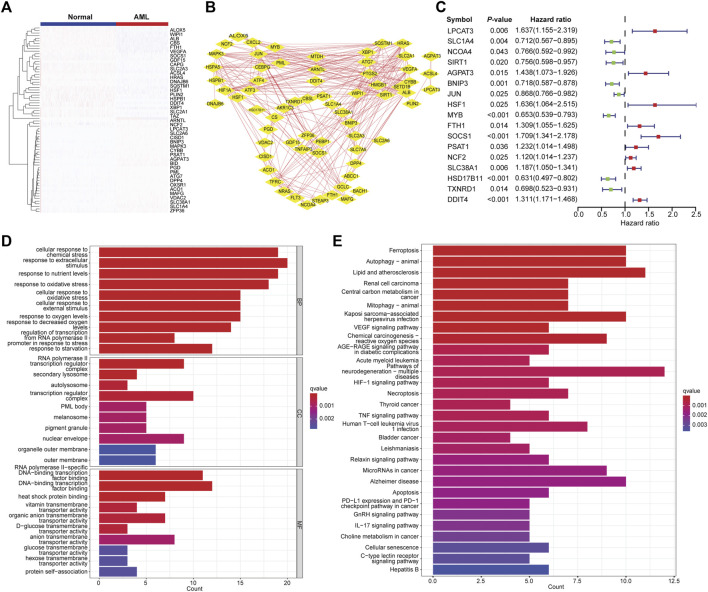
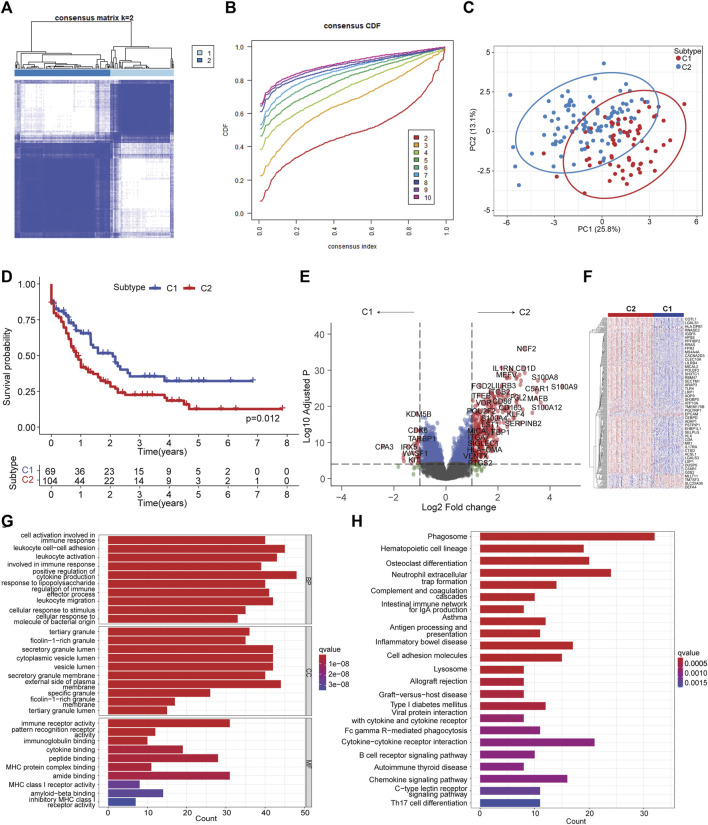
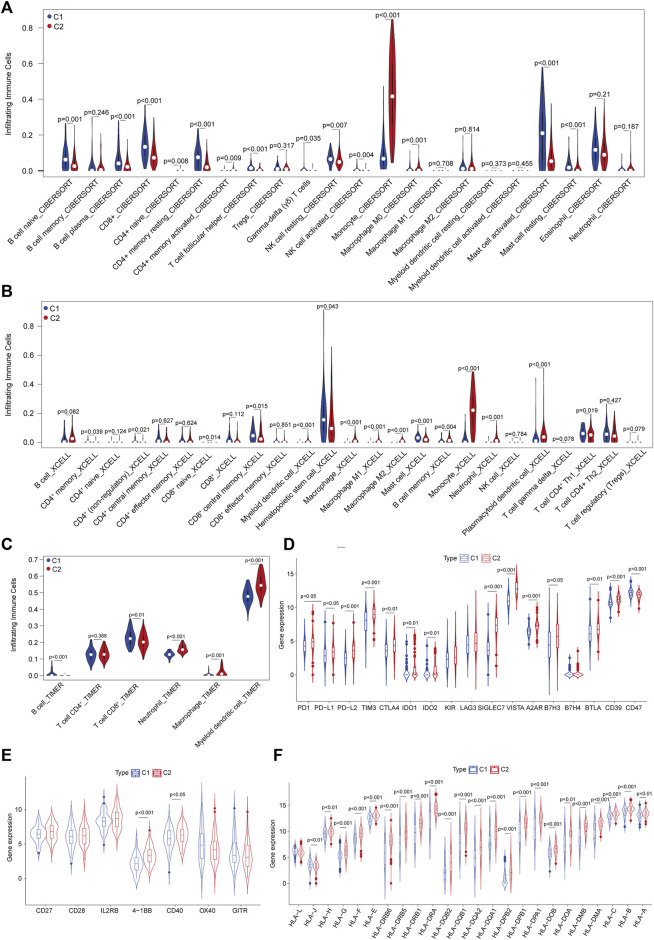
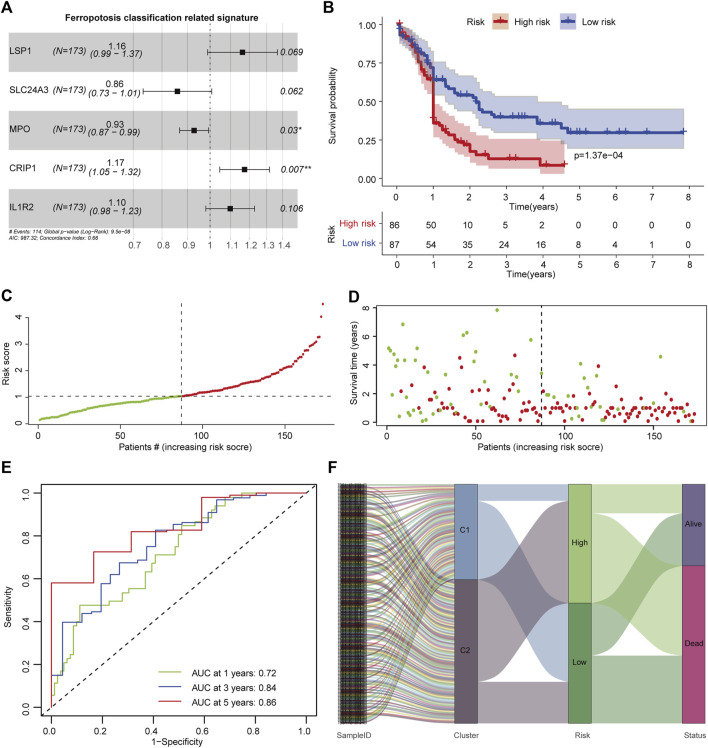
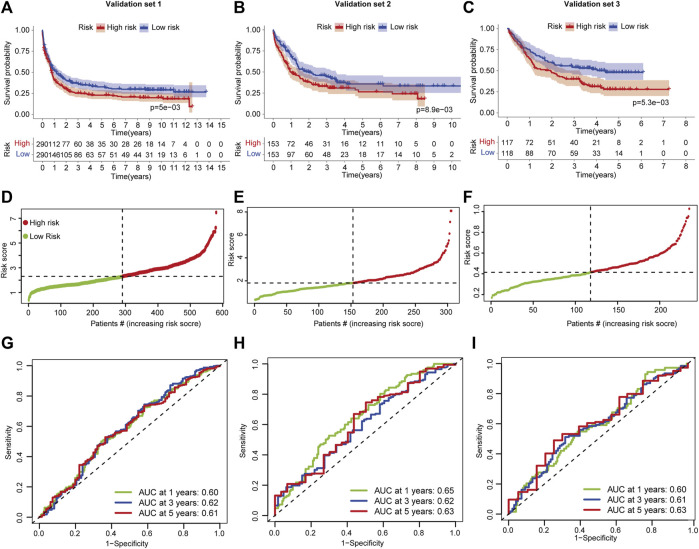
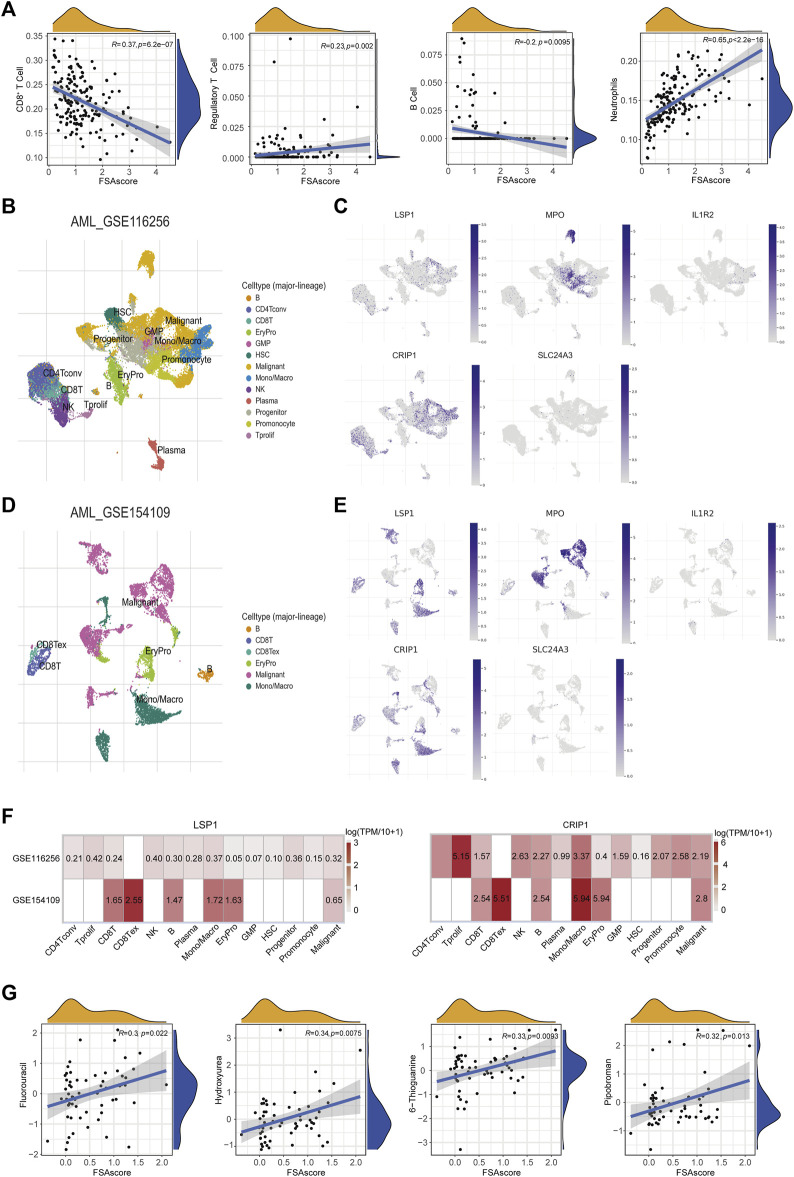
Acute myeloid leukemia (AML) is one of the most aggressive hematological malignancies with a low 5-year survival rate and high rate of relapse. Developing more efficient therapies is an urgent need for AML treatment. Accumulating evidence showed that ferroptosis, an iron-dependent form of programmed cell death, is closely correlated with cancer initiation and clinical outcome through reshaping the tumor microenvironment. However, understanding of AML heterogeneity based on extensive profiling of ferroptosis signatures remains to be investigated yet. Herein, five independent AML transcriptomic datasets (TCGA-AML, GSE37642, GSE12417, GSE10358, and GSE106291) were obtained from the GEO and TCGA databases. Then, we identified two ferroptosis-related molecular subtypes (C1 and C2) with distinct prognosis and tumor immune microenvironment (TIME) by consensus clustering. Patients in the C1 subtype were associated with favorable clinical outcomes and increased cytotoxic immune cell infiltration, including CD8+/central memory T cells, natural killer (NK) cells, and non-regulatory CD4+ T cells while showing decreased suppressive immune subsets such as M2 macrophages, neutrophils, and monocytes. Functional enrichment analysis of differentially expressed genes (DEGs) implied that cell activation involved in immune response, leukocyte cell-cell adhesion and migration, and cytokine production were the main biological processes. Phagosome, antigen processing and presentation, cytokine-cytokine receptor interaction, B-cell receptor, and chemokine were identified as the major pathways. To seize the distinct landscape in C1 vs. C2 subtypes, a 5-gene prognostic signature (LSP1, IL1R2, MPO, CRIP1, and SLC24A3) was developed using LASSO Cox stepwise regression analysis and further validated in independent AML cohorts. Patients were divided into high- and low-risk groups, and decreased survival rates were observed in high- vs. low-risk groups. The TIME between high- and low-risk groups has a similar scenery in C1 vs. C2 subtypes. Single-cell-level analysis verified that LSP1 and CRIP1 were upregulated in AML and exhausted CD8+ T cells. Dual targeting of these two markers might present a promising immunotherapeutic for AML. In addition, potential effective chemical drugs for AML were predicted. Thus, we concluded that molecular subtyping using ferroptosis signatures could characterize the TIME and provide implications for monitoring clinical outcomes and predicting novel therapies.

Keywords: acute myeloid leukemia; ferroptosis; immune microenvironment; molecule subtyping; outcome.


Conflict of interest statement

The authors declare that the research was conducted in the absence of any commercial or financial relationships that could be construed as a potential conflict of interest.

Figures

FIGURE 1
FIGURE 1
Identification of differentially expressed FAGs in AML. (A) Heatmap of differentially expressed FAGs in AML vs. normal samples. (B) The protein–protein interaction network of differentially expressed FAGs in AML. (C) Forest plot showing the correlations of differentially expressed FAG expression with clinical outcomes of AML patients. (D) Significantly enriched GO terms (biological process, molecular function, and cellular component) of differential expressed FAGs. (E) Significantly enriched KEGG signaling pathways of differentially expressed FAGs.
FIGURE 2
FIGURE 2
Ferroptosis molecular subtyping by consensus clustering. (A) Consensus clustering with k = 2. (B) Cumulative distribution from consensus matrices for clustering with 2–10 clusters. (C) Principal component analysis illustrating C1 and C2 subtypes. (D) Kaplan–Meier curve of C1 vs. C2 subtypes. The log-rank test was used to determine the survival difference. (E). Volcano plot showing differentially expressed genes by comparing C2 vs. C1 subtypes with |LogFC| >1 and Log10 (adjusted p) < 0.05. (F) Heatmap of differentially expressed genes between C2 vs. C1 subtypes. (G) Significantly enriched GO terms of differentially expressed genes between C2 vs. C1 subtypes. (H) Significantly enriched KEGG pathways of differentially expressed genes between C2 vs. C1 subtypes.
FIGURE 3
FIGURE 3
Characterization of the tumor immune microenvironment (TIME) defined by ferroptosis-related subtyping. (A) Abundance of infiltrated immune cell subsets in C1 vs. C2 subtypes deconvoluted using CIBERSORTx in the TCGA–AML dataset. (B) Abundance of infiltrated immune cell subsets in C1 vs. C2 subtypes deconvoluted using xCell. (C) Abundance of infiltrated immune cell subsets in C1 vs. C2 subtypes deconvoluted using TIMER. (D) Expression levels of inhibitory immune checkpoint molecules between C1 vs. C2 subtypes. (E) Expression levels of stimulatory immune checkpoint molecules between C1 vs. C2 subtypes. (F) Expression levels of human lymphocyte antigens between C1 vs. C2 subtypes.
FIGURE 4
FIGURE 4
Construction of the ferroptosis-related classification-based signature. (A) Hazard ratio of the signature genes. (B) Kaplan–Meier curve of patients in high- and low-risk groups. The log-rank test was used to determine the survival difference. (C) Distribution of patient risk scores. (D) Patient survival time and risk scores. (E) Receiver operating characteristic (ROC) curves of the prognostic signature for 1-, 3-, and 5-year in the TCGA-AML dataset. (F) Alluvial diagram showing the relationship of molecular subtypes, risk groups, and survival status.
FIGURE 5
FIGURE 5
Validation of the ferroptosis-related classification-based signature. (A–C) Kaplan–Meier curves of patients in high- and low-risk groups in AML validation sets 1/2/3. The log-rank test was used to determine the survival difference. (D–F) ROC curves of the prognostic signature for 1-, 3-, and 5-year in AML validation set -1/-2/-3. (D–F) Distribution of patient risk scores in AML validation set 1/2/3. (G–I) ROC curves of the prognostic signature for 1-, 3-, and 5-year in AML validation set -1/-2/-3.
FIGURE 6
FIGURE 6
Association of the signature with TIME and drug sensitivity. (A) Pearson correlations of infiltrated CD8+ T cells, Tregs, B cells, and neutrophils with signature scores. (B) Cell clusters of AML (GSE116256) measured by single cell RNA-sequencing. (C) The expression levels of five signature genes in different cell clusters (GSE116256). (D) Cell clusters of AML (GSE1 54109) measured by single cell RNA-sequencing. (E) The expression levels of five signature genes in different cell clusters (GSE154109). (F) Heatmap of five signature genes expression in different cell clusters (GSE116256 and GSE154109). (G) Pearson correlations of GI50 of compounds under clinical trials or approved by the FDA with signature scores.

Similar articles

Cited by

References

    1. Abdul-Aziz A. M., Shafat M. S., Sun Y., Marlein C. R., Piddock R. E., Robinson S. D., et al. (2018). HIF1α drives chemokine factor pro-tumoral signaling pathways in acute myeloid leukemia. Oncogene 37 (20), 2676–2686. 10.1038/s41388-018-0151-1 - DOI - PubMed
    1. Aran D., Hu Z., Butte A. J. (2017). xCell: digitally portraying the tissue cellular heterogeneity landscape. Genome Biol. 18 (1), 220. 10.1186/s13059-017-1349-1 - DOI - PMC - PubMed
    1. Badgley M. A., Kremer D. M., Maurer H. C., DelGiorno K. E., Lee H. J., Purohit V., et al. (2020). Cysteine depletion induces pancreatic tumor ferroptosis in mice. Science 368 (6486), 85–89. 10.1126/science.aaw9872 - DOI - PMC - PubMed
    1. Birsen R., Larrue C., Decroocq J., Johnson N., Guiraud N., Gotanegre M., et al. (2021). APR-246 induces early cell death by ferroptosis in acute myeloid leukemia. Haematologica 107, 403–416. 10.3324/haematol.2020.259531 - DOI - PMC - PubMed
    1. Blanche P., Dartigues J. F., Jacqmin-Gadda H. (2013). Estimating and comparing time-dependent areas under receiver operating characteristic curves for censored event times with competing risks. Stat. Med. 32 (30), 5381–5397. 10.1002/sim.5958 - DOI - PubMed