. 2023 Aug 24:14:1190678.
doi: 10.3389/fimmu.2023.1190678. eCollection 2023.

A predictive model of immune infiltration and prognosis of head and neck squamous cell carcinoma based on cell adhesion-related genes: including molecular biological validation

Affiliations

A predictive model of immune infiltration and prognosis of head and neck squamous cell carcinoma based on cell adhesion-related genes: including molecular biological validation

Yuchen Liu et al. Front Immunol. .

Abstract

Background: Focal adhesion serves as a bridge between tumour cells and the extracellular matrix (ECM) and has multiple roles in tumour invasion, migration, and therapeutic resistance. However, studies on focal adhesion-related genes (FARGs) in head and neck squamous cell carcinoma (HNSCC) are limited.

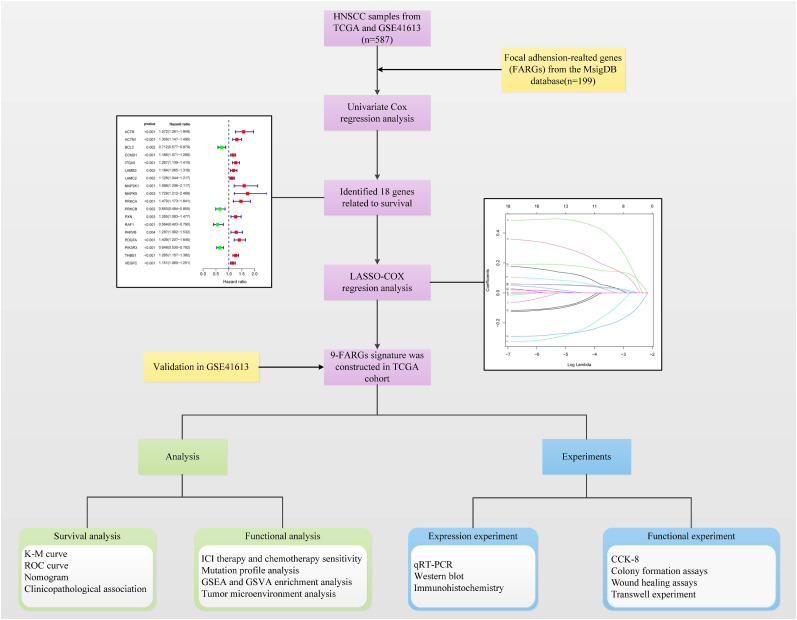
Methods: Data on HNSCC samples were obtained from The Cancer Genome Atlas and GSE41613 datasets, and 199 FARGs were obtained from the Molecular Signatures database. The integrated datasets' dimensions were reduced by the use of cluster analysis, which was also used to classify patients with HNSCC into subclusters. A FARG signature model was developed and utilized to calculate each patient's risk score using least extreme shrinkage and selection operator regression analysis. The risk score was done to quantify the subgroups of all patients. We evaluated the model's value for prognostic prediction, immune infiltration status, and therapeutic response in HNSCC. Preliminary molecular and biological experiments were performed to verify these results.

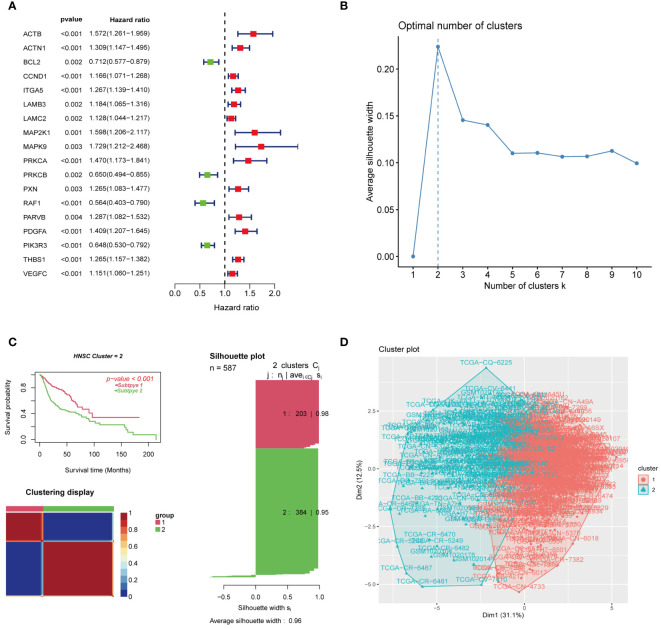
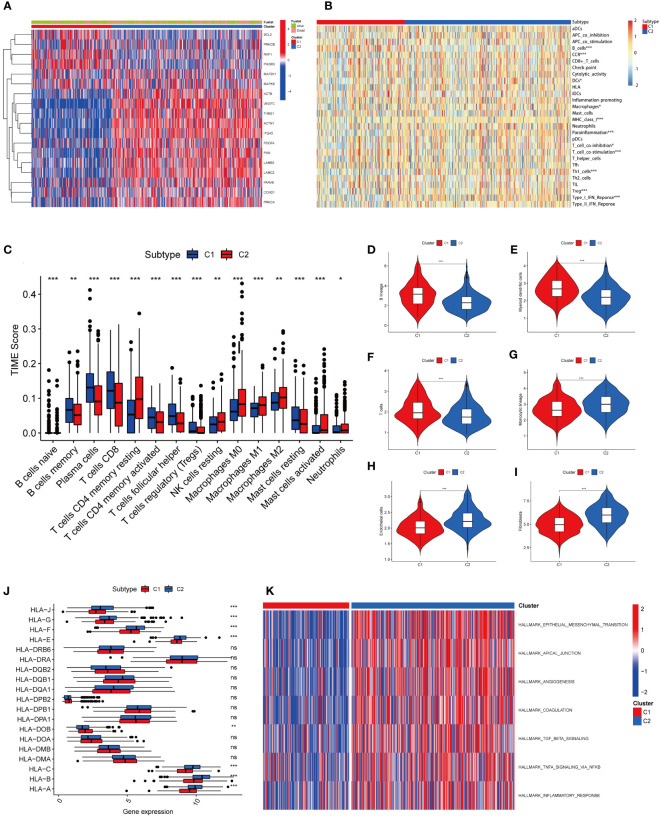
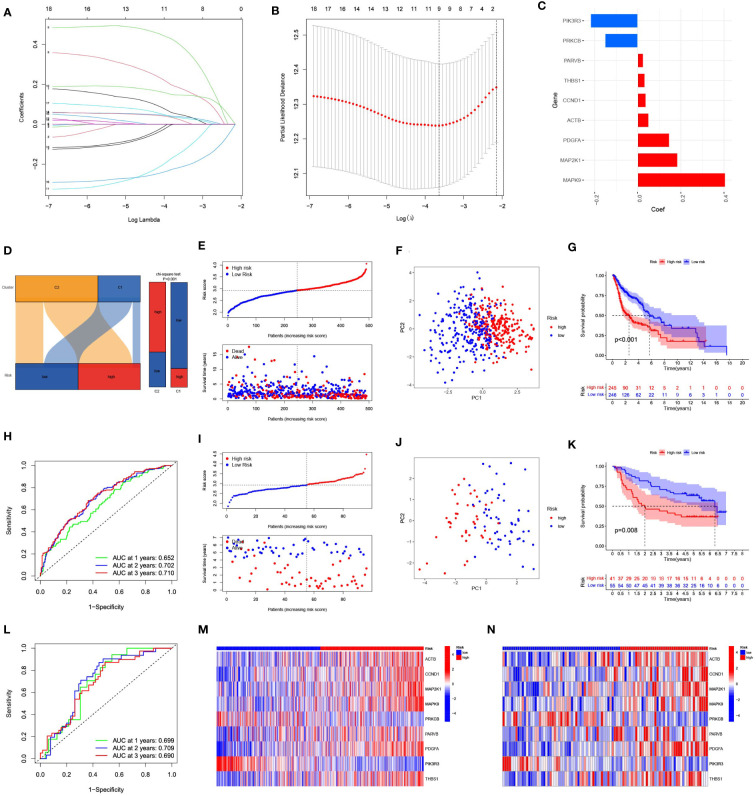
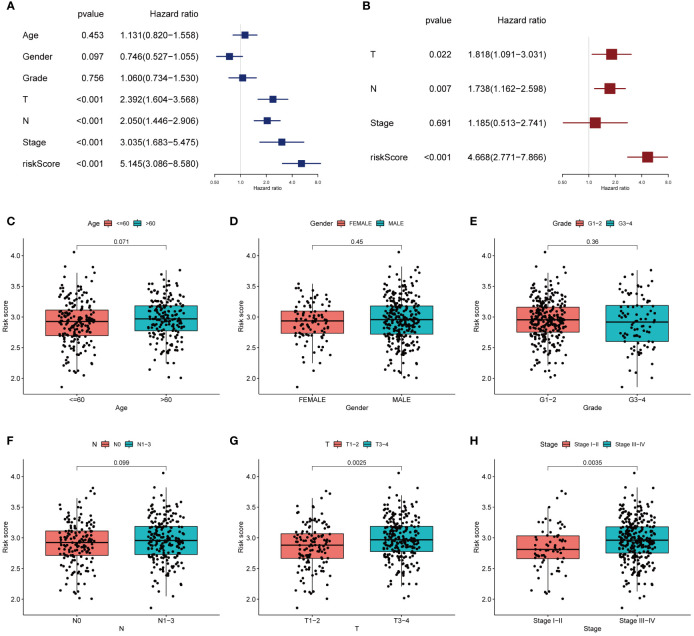
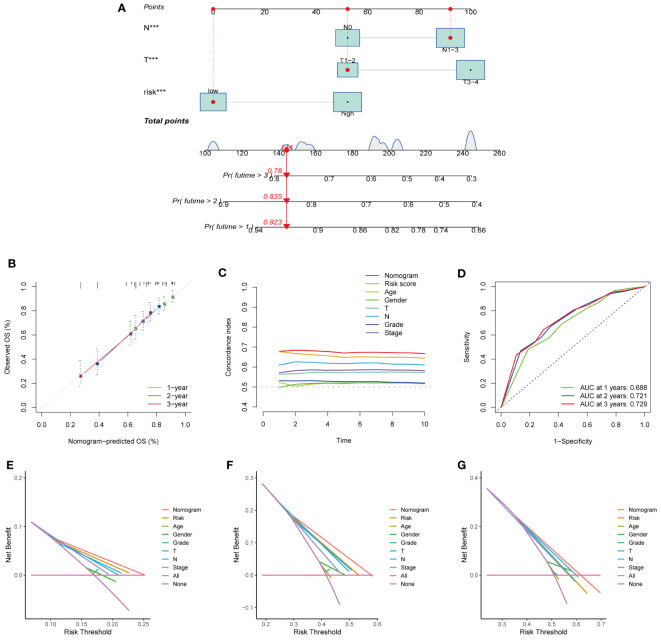
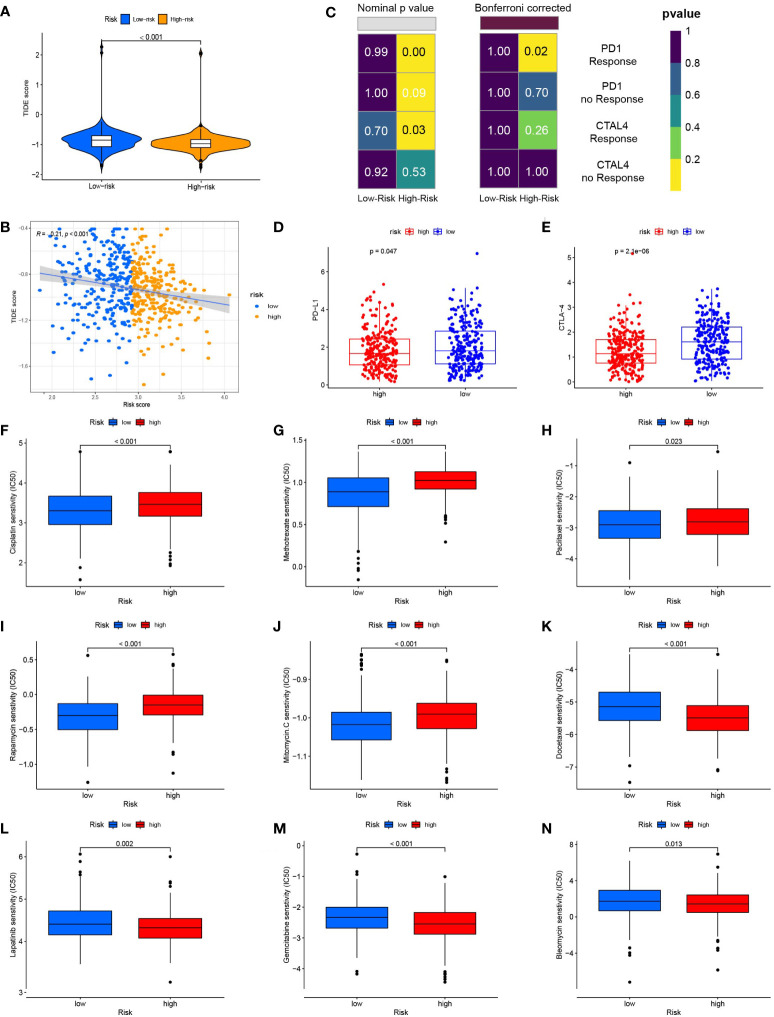
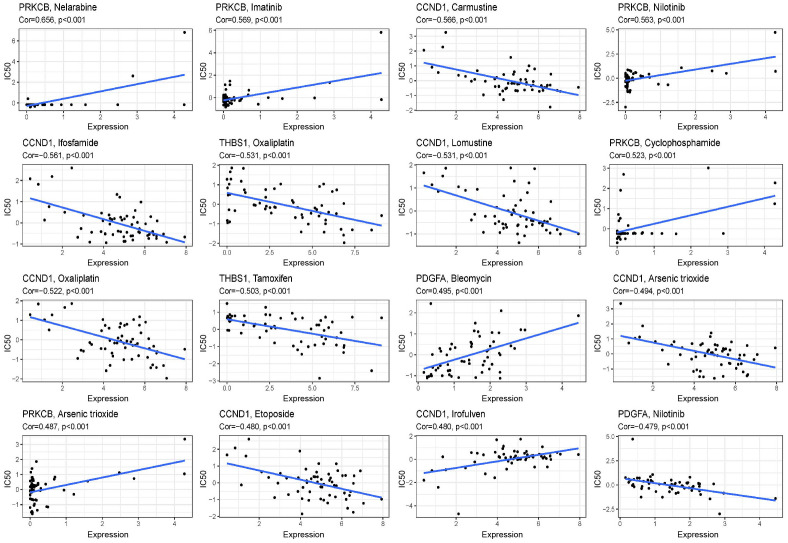
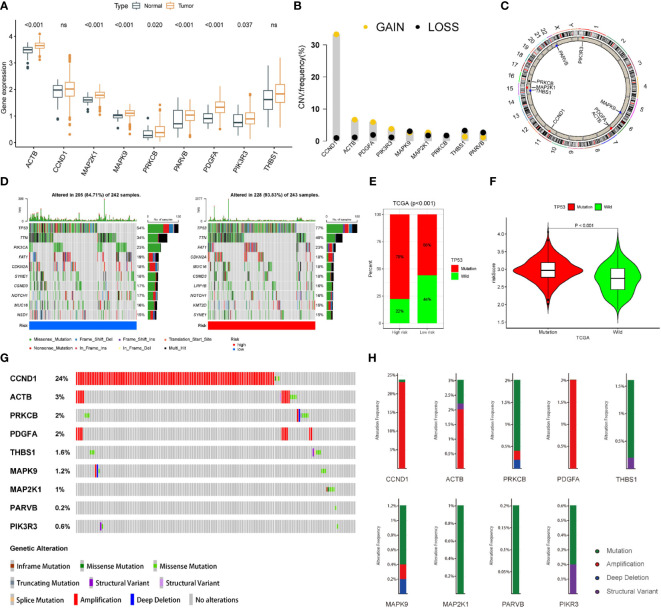
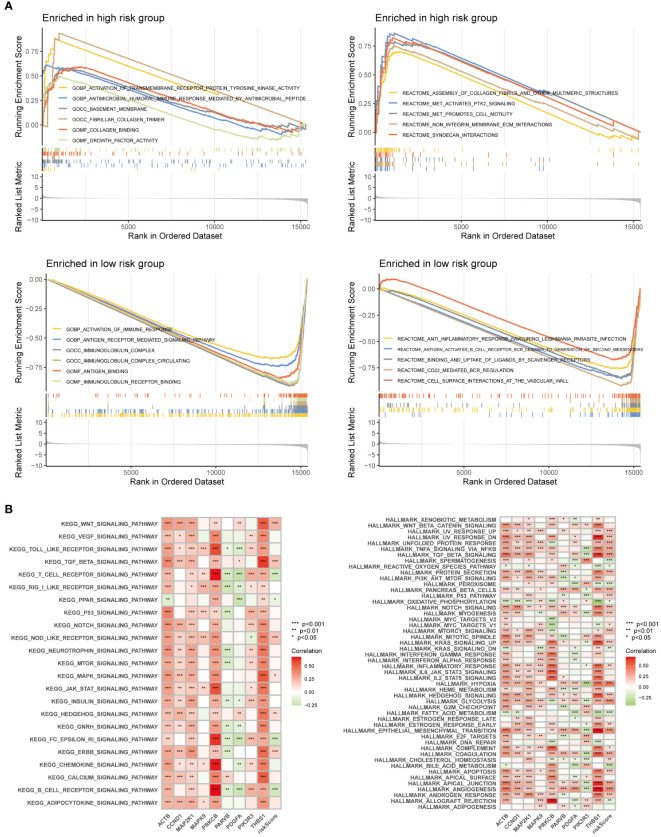
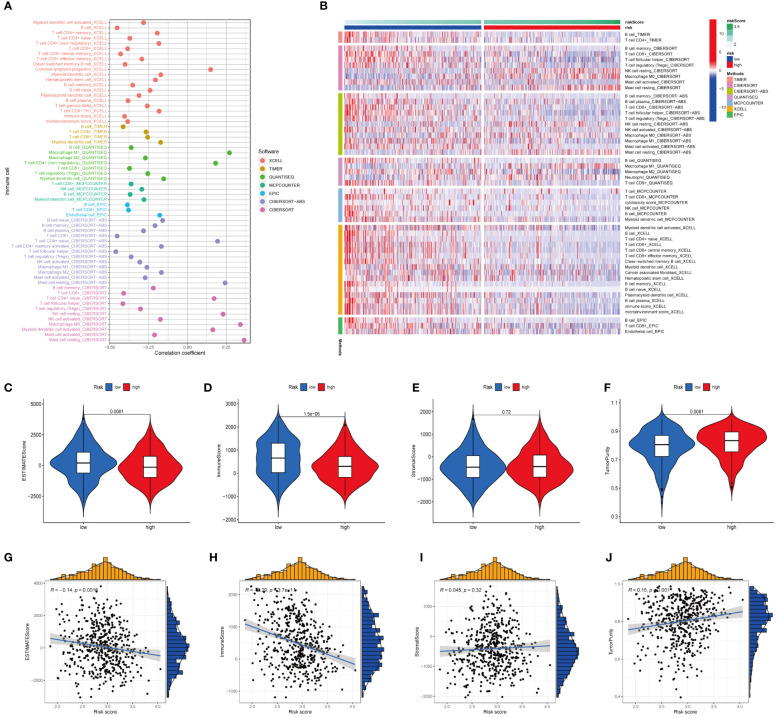
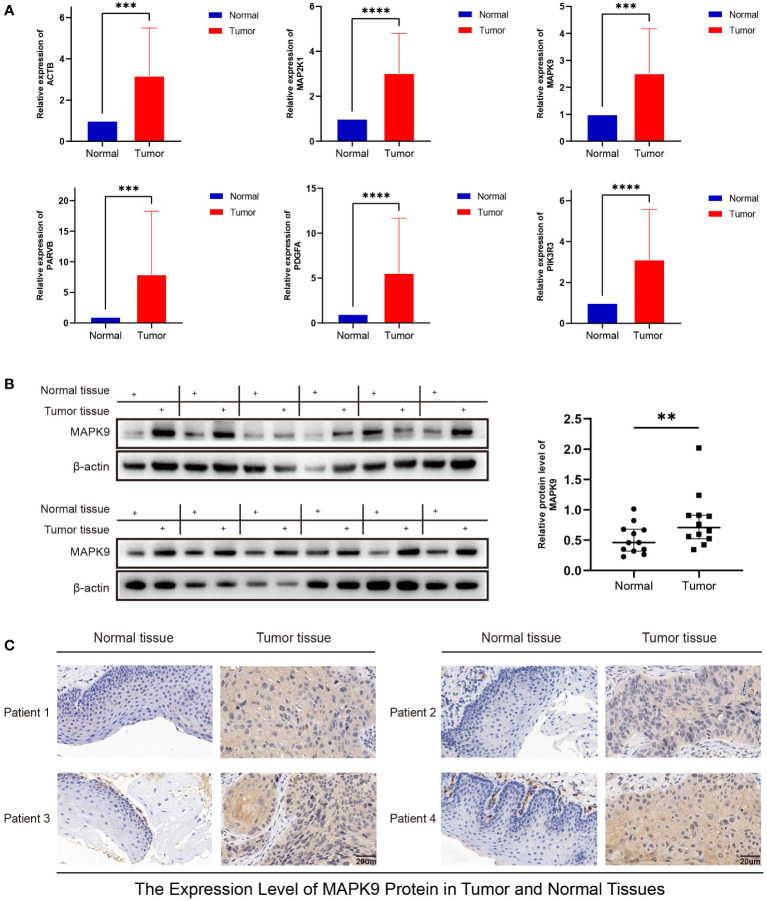
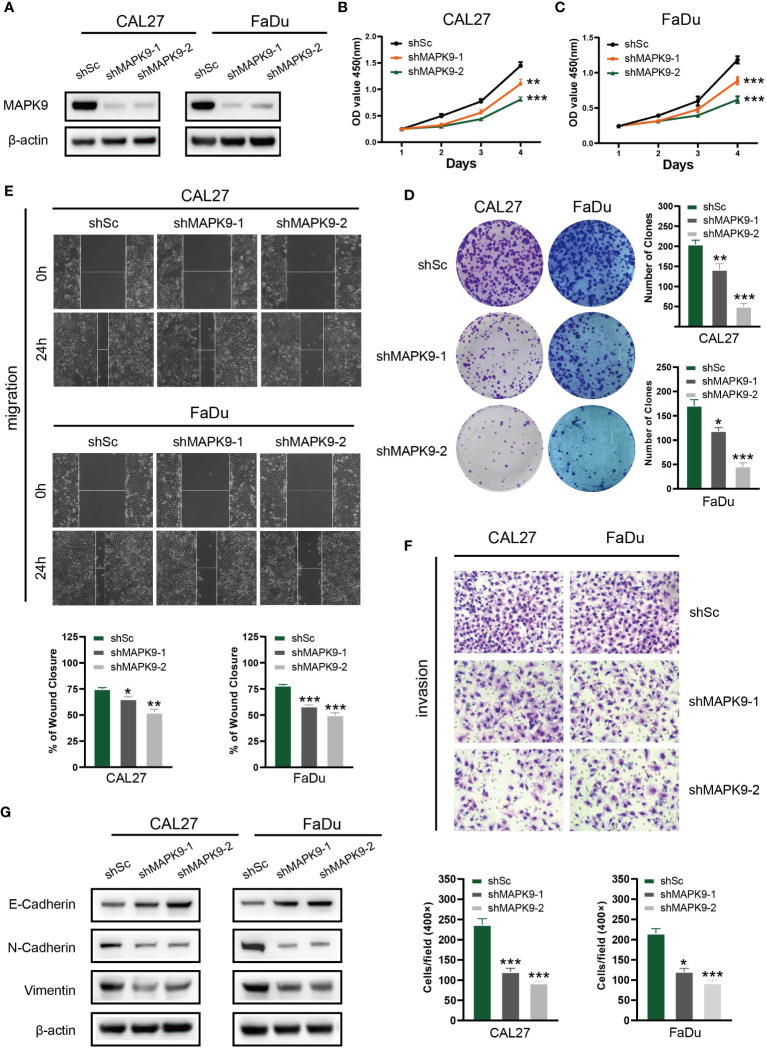
Results: Two different HNSCC molecular subtypes were identified according to FARGs, and patients with C2 had a shorter overall survival (OS) than those with C1. We constructed an FARG signature comprising nine genes. We constructed a FARG signature consisting of nine genes. Patients with higher risk scores calculated from the FARG signature had a lower OS, and the FARG signature was considered an independent prognostic factor for HNSCC in univariate and multivariate analyses. FARGs are associated with immune cell invasion, gene mutation status, and chemosensitivity. Finally, we observed an abnormal overexpression of MAPK9 in HNSCC tissues, and MAPK9 knockdown greatly impeded the proliferation, migration, and invasion of HNSCC cells.

Conclusion: The FARG signature can provide reliable prognostic prediction for patients with HNSCC. Apart from that, the genes in this model were related to immune invasion, gene mutation status, and chemosensitivity, which may provide new ideas for targeted therapies for HNSCC.

Keywords: chemotherapy sensitivity; focal adhesion-related gene; head and neck squamous cell carcinoma; immune infiltration; prognosis.


Conflict of interest statement

The authors declare that the research was conducted in the absence of any commercial or financial relationships that could be construed as a potential conflict of interest.

Figures

Figure 1
Figure 1
Flow chart of the study.
Figure 2
Figure 2
Gene screening and clustering analysis of focal adhesion-related genes. (A) Univariate regression analysis screened 18 genes associated with tumor prognosis. (B) K = 2 was the optimal number of subgroups using the K-means method. (C) The consensus non-negative matrix decomposition divided the samples into two HNSCC clusters, with significant differences in survival between the two clusters. The right side is the silhouette plot. When k = 2, the average silhouette width is the largest and the width is close to 1. This is consistent with the original grouping, which further proves the rationality of the results. (D) The classification plot divided the tumor samples into two tumor subtypes, which was the same as the classification result in (C).
Figure 3
Figure 3
Heatmap results and immune infiltration analysis of two tumor subtypes. (A) The heatmap showed differences in prognostic gene expression between the two tumor subtypes. The difference was significantly correlated with survival or death status. (B) Heatmap showed different levels of immune cell expression in two tumor subtypes. (C) Abundance of 15 infiltrating immune cell types in two HNSCC subtypes. (D) Comparison of B lineage cells in two tumor subtypes. (E) Comparison of myeloid dendritic cells in two tumor subtypes. (F) Comparison of T cells in two tumor subtypes. (G) Comparison of monocytic lineage cells in two tumor subtypes. (H) Comparison of endothelial cells in two tumor subtypes. (I) Comparison of fibroblasts cells in two tumor subtypes. (J) The differences in HLA expression between the two tumor subtypes suggest that different tumor subtypes have different levels of ability to activate immune cells. (K) GSVA-based analysis of expression differences of pathways in two tumor clusters. (*represents P<0.05, **represents P<0.01, ***represents P<0.001; "ns" represents not significant. )
Figure 4
Figure 4
Construction and evaluation of a prognostic model based on 9 focal adhesion-related genes. (A) The LASSO coefficient profiles of 9 focal adhesion-related genes. (B) Tuning parameter (λ) selection cross validation error curve, the optimal log λ value is the left dotted line in the plot. (C) Construction of prognostic risk signature based on 9 genes. (D) The Sankey diagram on the left intuitively shows the relationship between tumor subtypes and risk groups. The bar chart on the right side shows the difference in the risk group composition of tumor subtypes calculated by chi-square test. (E) The distribution of risk score、survival time and OS status in TCGA. (F) The PCA results showed significant differences between the high-risk and low-risk groups. (G) The prognosis and survival time were significantly lower in the high-risk group than in the low-risk group. (H) ROC curve analysis of the 9 focal adhesion-related genes signature of the 1, 3, and 5 years in the TCGA. (I–L) Similar results were obtained using the same method in the GSE41613 dataset. (M, N) The heatmap shows that this has nine genes with significant differences in expression between the high and low risk groups in the TCGA (M) and GSE41613 (N) datasets.
Figure 5
Figure 5
The correlations between the risk score and clinical factors. Univariate COX regression analysis (A) and multivariate COX regression analysis (B) showed that T stage, N stage and risk score were independent prognostic factors. (C–H) Correlation between risk score and age, gender, grade, N, T, and stage.
Figure 6
Figure 6
Establishment and evaluation of nomogram model in the TCGA dataset. (A) The nomogram for predicting the OS of patients at 1, 3, and 5 years. (B) Calibration curves of the nomogram for 1, 3, and 5 years. (C) The consistency index of nomogram was superior to each clinical factor, demonstrating the superiority of nomogram and signature. (D) ROC curve analysis showed the validity of the nomogram to predict the overall survival of patients at 1, 3 and 5 years. (E–G) Decision curve analysis at 1 (E)、3 (F)、and 5 (G) years. (***represents P<0.001).
Figure 7
Figure 7
Risk score predicts responses to immunotherapy and chemotherapy. (A) TIDE scores were significantly lower in the high-risk group than in the low-risk group. (B) Risk scores were negatively correlated with TIDE scores. (C) Using the SubMAP algorithm, we inferred the possibility of anti-programmed cell death protein 1(PD1) and anti- cytotoxic T-lymphocyte-associated protein 4 (CTLA4) response immunotherapy in the high and low risk groups. High risk group may respond better to PD-1 treatment (Bonferroni-corrected P = 0.02). (D) The expression level of PD-L1 in the high and low risk groups (E) The expression level of CTLA-4 in high and low risk groups. (F) The box plot of the estimated IC50 for cisplatin. (G) The box plot of the estimated IC50 for methotrexate. (H) The box plot of the estimated IC50 for paclitaxel. (I) The box plot of the estimated IC50 for rapamycin. (J) The box plot of the estimated IC50 for mitomycin. C (K) The box plot of the estimated IC50 for docetaxel. (L) The box plot of the estimated IC50 for lapatinib. (M) The box plot of the estimated IC50 for gemcitabine. (N) The box plot of the estimated IC50 for bleomycin.
Figure 8
Figure 8
Scatter plots of the correlation between the expression of 9 genes and the predicted drug response. The vertical axis represents drug sensitivity, represented by Z-score, and the horizontal axis represents gene expression, represented by log2 (FPKM + 1).
Figure 9
Figure 9
The landscape of genetic and expression variation of 9 focal adhesion-related genes in TCGA dataset. (A) Expression of 9 genes in tumor tissues. (B) The frequencies of CNV mutations in 9 genes. (C) The location of 9 focal adhesion-related genes on the chromosome. (D) Comparison of the top 10 mutated genes in the high-risk and low-risk groups. (E) Mutation difference of TP53 in high and low-risk groups. (F) The FARG score of patients with TP53 mutation was higher. (G) Alterations in each gene were assessed by analyzing the HNSCC samples in the cBioPortal database. (H) The detailed mutation spectrum of 9 focal adhesion-related genes.
Figure 10
Figure 10
Enrichment analysis was performed based on GSEA algorithm and GSVA algorithm. (A) Differences in pathways and biological functions between the high and low-risk groups. (B) The results of KEGG and Hallmark analysis showed the correlation of genes and pathways.
Figure 11
Figure 11
Analysis of immune landscape between the high-risk and low-risk groups in the TCGA dataset. (A) Association of risk scores with immune microenvironment as shown by Spearman correlation analysis. (B) Differences in immune cell abundance between the high-risk and low-risk groups. (C) Differences in ESTIMATE scores between the two groups. (D) Differences in immune score between the two groups. (E) Differences in stromal score between the two groups. (F) Differences in tumor purity between the two groups. (G) Risk scores were negatively correlated with ESTIMATE scores. (H) Risk scores were negatively correlated with immune score. (I) Risk score was positively correlated with stromal score. (J) Risk score was positively correlated with tumor purity.
Figure 12
Figure 12
Validation of mRNA and protein expression levels of focal adhesion-related genes in HNSCC. (A) The expression of mRNA in HNSCC tissues and adjacent normal tissues was compared by RT-PCR. (B) The western blot analyses. (C) Immunohistochemical staining analysis. (**represents P<0.01, ***represents P<0.001, ****represents P<0.0001).
Figure 13
Figure 13
Knockdown of MAPK9 decreases HNSCC cells proliferation, migration and invasion. (A) Western blot validation of MAPK9 knockdown in CAL27 and FaDu cell lines. Cell growth rates, migration and invasion abilities of the indicated cells were evaluated by CCK-8 assays (B, C), colony formation assays (D), wound healing assays (E) and transwell (F). Data were indicated as mean ± SD of triplicate technical replicates, *p < 0.05, **p < 0.01, ***p < 0.001 vs control group. (G) The expression of EMT markers (E-cadherin, N-cadherin and Vimentin) was detected by Western blot analysis when MAPK9 was knockdown in HNSCC cells.

Similar articles

Cited by

References

    1. Johnson DE, Burtness B, Leemans CR, Lui VWY, Bauman JE and Grandis JR. Head and neck squamous cell carcinoma. Nat Rev Dis Primers (2020) 6:92. doi: 10.1038/s41572-020-00224-3 - DOI - PMC - PubMed
    1. Sung H, Ferlay J, Siegel RL, Laversanne M, Soerjomataram I, Jemal A, et al. Global cancer statistics 2020: GLOBOCAN estimates of incidence and mortality worldwide for 36 cancers in 185 countries. CA Cancer J Clin (2021) 71:209–49. doi: 10.3322/caac.21660 - DOI - PubMed
    1. Miyauchi S, Kim SS, Pang J, Gold KA, Gutkind JS, Califano JA, et al. Immune modulation of head and neck squamous cell carcinoma and the tumor microenvironment by conventional therapeutics. Clin Cancer Res (2019) 25:4211–23. doi: 10.1158/1078-0432.CCR-18-0871 - DOI - PMC - PubMed
    1. Chauhan SS, Kaur J, Kumar M, Matta A, Srivastava G, Alyass A, et al. Prediction of recurrence-free survival using a protein expression-based risk classifier for head and neck cancer. Oncogenesis (2015) 4:e147. doi: 10.1038/oncsis.2015.7 - DOI - PMC - PubMed
    1. Yokota T, Homma A, Kiyota N, Tahara M, Hanai N, Asakage T, et al. Immunotherapy for squamous cell carcinoma of the head and neck. Jpn J Clin Oncol (2020) 50:1089–96. doi: 10.1093/jjco/hyaa139 - DOI - PubMed

Publication types