

Opportunities in optical and electrical single-cell technologies to study microbial ecosystems
- PMID: 37692384
- PMCID: PMC10486927
- DOI: 10.3389/fmicb.2023.1233705
Opportunities in optical and electrical single-cell technologies to study microbial ecosystems
Abstract
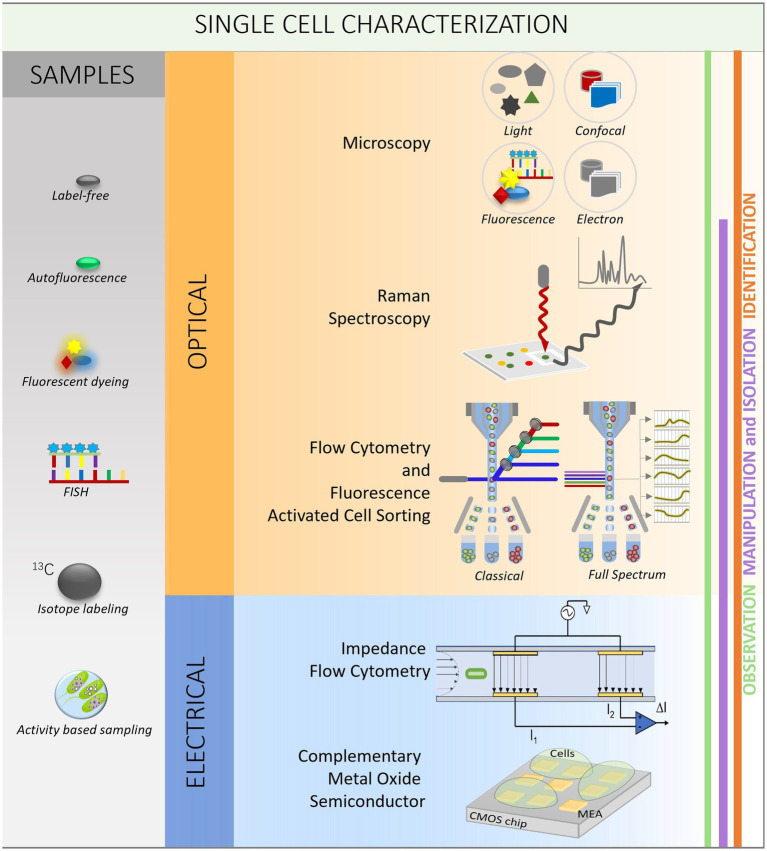
New techniques are revolutionizing single-cell research, allowing us to study microbes at unprecedented scales and in unparalleled depth. This review highlights the state-of-the-art technologies in single-cell analysis in microbial ecology applications, with particular attention to both optical tools, i.e., specialized use of flow cytometry and Raman spectroscopy and emerging electrical techniques. The objectives of this review include showcasing the diversity of single-cell optical approaches for studying microbiological phenomena, highlighting successful applications in understanding microbial systems, discussing emerging techniques, and encouraging the combination of established and novel approaches to address research questions. The review aims to answer key questions such as how single-cell approaches have advanced our understanding of individual and interacting cells, how they have been used to study uncultured microbes, which new analysis tools will become widespread, and how they contribute to our knowledge of ecological interactions.
Keywords: CMOS-MEA; Raman spectroscopy; electrical techniques; flow cytometry; impedance flow cytometry; microbial ecology; optical techniques; single-cell.
Copyright © 2023 Mermans, Mattelin, Van den Eeckhoudt, García-Timermans, Van Landuyt, Guo, Taurino, Tavernier, Kraft, Khan and Boon.
Conflict of interest statement
The authors declare that the research was conducted in the absence of any commercial or financial relationships that could be construed as a potential conflict of interest.
Figures
Similar articles
-
Discriminating Bacterial Phenotypes at the Population and Single-Cell Level: A Comparison of Flow Cytometry and Raman Spectroscopy Fingerprinting.Cytometry A. 2020 Jul;97(7):713-726. doi: 10.1002/cyto.a.23952. Epub 2019 Dec 30. Cytometry A. 2020. PMID: 31889414
-
Tools for microbial single-cell genomics for obtaining uncultured microbial genomes.Biophys Rev. 2023 Sep 8;16(1):69-77. doi: 10.1007/s12551-023-01124-y. eCollection 2024 Feb. Biophys Rev. 2023. PMID: 38495448 Free PMC article. Review.
-
Contemporary molecular tools in microbial ecology and their application to advancing biotechnology.Biotechnol Adv. 2015 Dec;33(8):1755-73. doi: 10.1016/j.biotechadv.2015.09.005. Epub 2015 Sep 25. Biotechnol Adv. 2015. PMID: 26409315 Review.
-
Single-cell ecophysiology of microbes as revealed by Raman microspectroscopy or secondary ion mass spectrometry imaging.Annu Rev Microbiol. 2009;63:411-29. doi: 10.1146/annurev.micro.091208.073233. Annu Rev Microbiol. 2009. PMID: 19514853 Review.
-
Functional single-cell analyses: flow cytometry and cell sorting of microbial populations and communities.FEMS Microbiol Rev. 2010 Jul;34(4):554-87. doi: 10.1111/j.1574-6976.2010.00214.x. Epub 2010 Feb 6. FEMS Microbiol Rev. 2010. PMID: 20337722 Review.
Cited by
-
Quantifying synthetic bacterial community composition with flow cytometry: efficacy in mock communities and challenges in co-cultures.mSystems. 2025 Jan 21;10(1):e0100924. doi: 10.1128/msystems.01009-24. Epub 2024 Nov 29. mSystems. 2025. PMID: 39611809 Free PMC article.
-
Integrating taxonomic and phenotypic information through FISH-enhanced flow cytometry for microbial community dynamics analysis.Microbiol Spectr. 2025 Aug 5;13(8):e0197324. doi: 10.1128/spectrum.01973-24. Epub 2025 Jun 23. Microbiol Spectr. 2025. PMID: 40548738 Free PMC article.
-
Raman cell sorting for single-cell research.Front Bioeng Biotechnol. 2024 May 20;12:1389143. doi: 10.3389/fbioe.2024.1389143. eCollection 2024. Front Bioeng Biotechnol. 2024. PMID: 38832129 Free PMC article. Review.
References
Publication types
LinkOut - more resources
Full Text Sources