. 2023 Apr 10;11(2):1009-1021.
doi: 10.1016/j.gendis.2023.02.049. eCollection 2024 Mar.

Vitamin D-binding protein in plasma microglia-derived extracellular vesicles as a potential biomarker for major depressive disorder

Affiliations

Vitamin D-binding protein in plasma microglia-derived extracellular vesicles as a potential biomarker for major depressive disorder

Gaojia Zhang et al. Genes Dis. .

Abstract

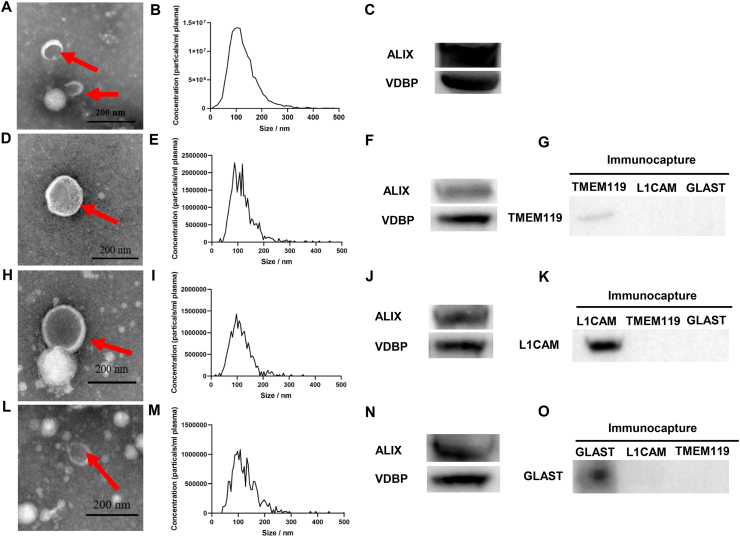
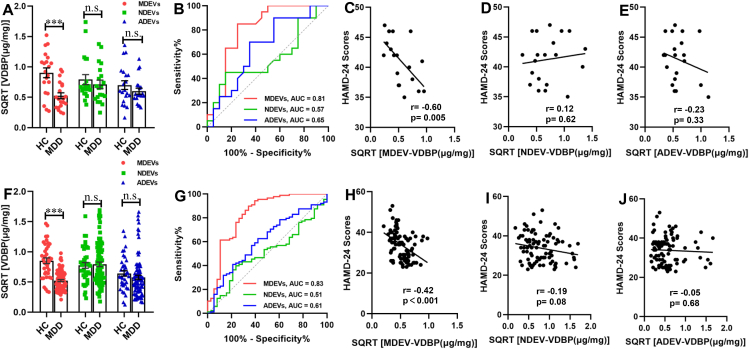
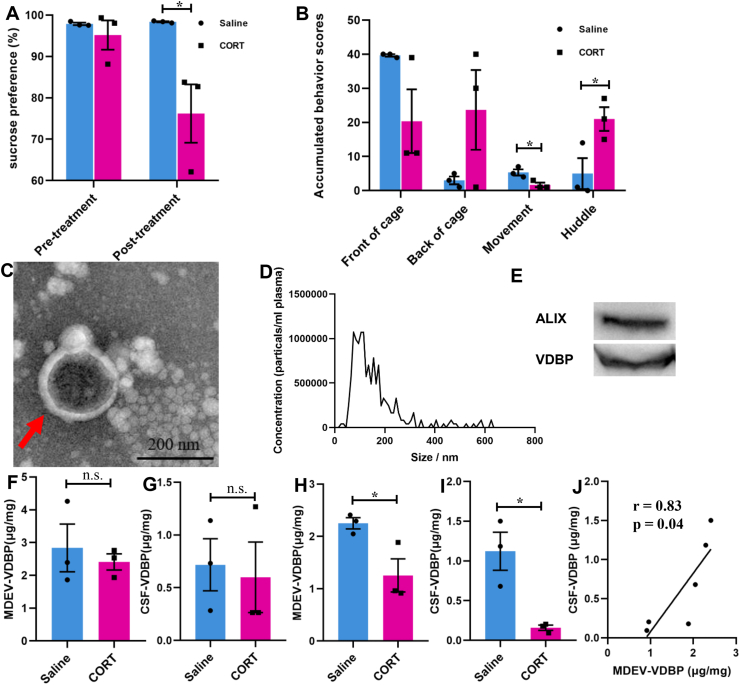
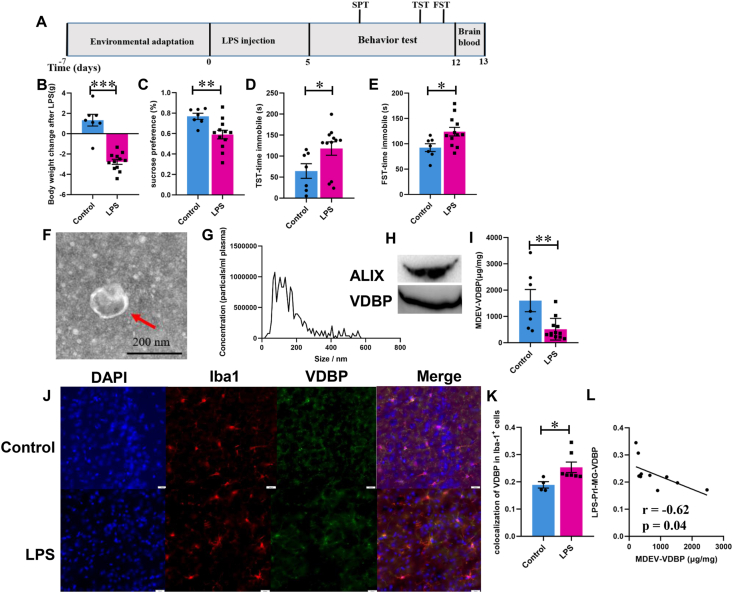
No well-established biomarkers are available for the clinical diagnosis of major depressive disorder (MDD). Vitamin D-binding protein (VDBP) is altered in plasma and postmortem dorsolateral prefrontal cortex (DLPFC) tissues of MDD patients. Thereby, the role of VDBP as a potential biomarker of MDD diagnosis was further assessed. Total extracellular vesicles (EVs) and brain cell-derived EVs (BCDEVs) were isolated from the plasma of first-episode drug-naïve or drug-free MDD patients and well-matched healthy controls (HCs) in discovery (20 MDD patients and 20 HCs) and validation cohorts (88 MDD patients and 38 HCs). VDBP level in the cerebrospinal fluid (CSF) from chronic glucocorticoid-induced depressed rhesus macaques or prelimbic cortex from lipopolysaccharide (LPS)-induced depressed mice and wild control groups was measured to evaluate its relationship with VDBP in plasma microglia-derived extracellular vesicles (MDEVs). VDBP was significantly decreased in MDD plasma MDEVs compared to HCs, and negatively correlated with HAMD-24 score with the highest diagnostic accuracy among BCDEVs. VDBP in plasma MDEVs was decreased both in depressed rhesus macaques and mice. A positive correlation of VDBP in MDEVs with that in CSF was detected in depressed rhesus macaques. VDBP levels in prelimbic cortex microglia were negatively correlated with those in plasma MDEVs in depressed mice. The main results suggested that VDBP in plasma MDEVs might serve as a prospective candidate biomarker for MDD diagnosis.

Keywords: Biomarker; Cerebrospinal fluid; Major depressive disorder; Microglia derived extracellular vesicles; Vitamin-D binding protein.


Figures

Fig. 1
Figure 1
Characterization of total TEVs and BCDEVs isolated from human plasma. (A) Representative TEM images of TEVs isolated from human plasma. Exosomes are indicated by red arrows. Scale bar = 200 nm. (B) NTA of TEs. (C) Western blot of the common exosome marker ALIX and VDBP in TEVs. (D) Representative TEM of MDEVs. The exosome is indicated by red arrows. Scale bar = 200 nm. (E) NTA showing the size and distribution of MDEVs. (F) Western blot of the common exosome marker ALIX and VDBP in MDEVs. (G) Western blot showed that the microglia marker TMEM119 was selectively expressed in MDEVs. (H) Representative TEM of NDEVs. The exosome is indicated by a red arrow. Scale bar = 200 nm. (I) NTA showing the size and distribution of NDEVs. (J) Western blot identifying the common exosome marker ALIX and VDBP in NDEVs. (K) Western blot showing the neuron marker L1CAM selectively expressed in NDEVs. (L) Representative TEM of ADEVs. Exosomes are indicated by red arrows. Scale bar = 200 nm. (M) NTA showing the sizes and distribution of ADEVs. (N) Western blot identifying the common exosome marker ALIX and VDBP in ADEVs. (O) Western blot showing the astrocyte marker GLAST selectively expressed in ADEVs.
Fig. 2
Figure 2
Concentration and diagnostic performance of VDBP in plasma BCDEVs from MDD patients and HCs. (A) VDBP protein level in plasma MDEVs, NDEVs, and ADEVs from MDD and HCs in the discovery cohort, as measured by ELISA. (B) Diagnostic accuracy of VDBP in plasma BCDEVs of MDD in the discovery cohort, as calculated by the AUC of the ROC curve. Pearson correlation analysis showed the relationships between the VDBP level in plasma MDEVs (C), NDEVs (D), or ADEVs (E) and HAMD-24 scores in MDD patients of the discovery cohort. (F) VDBP level in plasma MDEVs from MDD patients was confirmed in the validation cohort. (G) Diagnostic accuracy of VDBP in plasma BCDEVs of MDD in the validation cohort. Pearson correlation analysis showed the relationships between VDBP level in plasma MDEVs (H), NDEVs (I), or ADEVs (J) and HAMD-24 scores in MDD patients of the validation cohort. HAMD-24: Hamilton Depression Rating Scale-24 item. ∗∗∗P < 0.001, n. s.: = not significant. Results are presented as mean ± SEM.
Fig. 3
Figure 3
Characterization and VDBP evaluation of plasma MDEVs from chronic glucocorticoid-induced depressed rhesus macaque model. (A) Sucrose preference test (SPT) and (B) accumulated behavior scores of chronic glucocorticoid and saline-treated rhesus macaque. Isolated plasma MDEVs from rhesus macaque were characterized by TEM (C) and NTA (D). The red arrow indicates MDEVs in a representative TEM image. (E) Western blot showing the presence of the exosome marker ALIX and VDBP in isolated rhesus macaque plasma MDEVs. VDBP concentrations in plasma MDEVs (F) and cerebrospinal fluid (CSF) (G) of rhesus macaque at baseline were measured by ELISA. VDBP concentrations in plasma MDEVs (H) and CSF (I) of rhesus macaque after saline or chronic glucocorticoid treatment were measured by ELISA. (J) Pearson correlation analysis showing the relationships between VDBP in plasma MDEVs and CSF of rhesus macaque after treatment with saline or chronic glucocorticoid. ∗P < 0.05, n. s. = not significant. Results are presented as mean ± SEM.
Fig. 4
Figure 4
VDBP level in plasma MDEVs and microglia in PrL of LPS-induced depressed mice. (A) Schematic diagram of the experimental procedure for LPS-induced depressed mouse model. (B) Body weight loss in LPS-induced depressed mice. Sucrose preference test (C), tail suspension test (D), and forced swimming test (E) of mice treated with saline (Control) or LPS. Isolation and characterization of plasma MDEVs by TEM (F), NTA (G) of LPS-induced depressed mice. The red arrow points to the plasma MDEV successfully isolated. (H) Western blotting showing the enriched VDBP and exosome marker ALIX in isolated mice plasma MDEVs. (I) VDBP in plasma MDEVs from LPS-induced depressed mice as measured by ELISA. (J) Immunofluorescence images showing the microglial VDBP level (green) in the PrL of LPS-induced depressed mice. The nucleus was stained with DAPI (blue). Microglia were labeled with Iba-1 antibody (red). (K) Colocalization of VDBP in Iba-1+ cells was calculated. (L) Pearson correlation analysis showing the relationships between VBBP in plasma MDEVs and PrL microglia. P < 0.05, ∗∗P < 0.01, ∗∗∗P < 0.001. Results are presented as mean ± SEM.

Similar articles

Cited by

References

    1. Kitanaka J., Ecks S., Wu H.Y.J. The social in psychiatries: depression in Myanmar, China, and Japan. Lancet. 2021;398(10304):948–949. - PubMed
    1. Santomauro D.F., Mantilla Herrera A.M., Shadid J., et al. Global prevalence and burden of depressive and anxiety disorders in 204 countries and territories in 2020 due to the COVID-19 pandemic. Lancet. 2021;398(10312):1700–1712. - PMC - PubMed
    1. Huang C., Huang L., Wang Y., et al. 6-month consequences of COVID-19 in patients discharged from hospital: a cohort study. Lancet. 2021;397(10270):220–232. - PMC - PubMed
    1. Shi Y., Song R., Wang L., et al. Identifying plasma biomarkers with high specificity for major depressive disorder: a multi-level proteomics study. J Affect Disord. 2020;277:620–630. - PubMed
    1. Kennis M., Gerritsen L., van Dalen M., et al. Prospective biomarkers of major depressive disorder: a systematic review and meta-analysis. Mol Psychiatr. 2020;25(2):321–338. - PMC - PubMed

LinkOut - more resources