. 2023 Jul 8;9(2):vead044.
doi: 10.1093/ve/vead044. eCollection 2023.

From vaccine to pathogen: Modeling Sabin 2 vaccine virus reversion and evolutionary epidemiology in Matlab, Bangladesh

Affiliations

From vaccine to pathogen: Modeling Sabin 2 vaccine virus reversion and evolutionary epidemiology in Matlab, Bangladesh

Wesley Wong et al. Virus Evol. .

Abstract

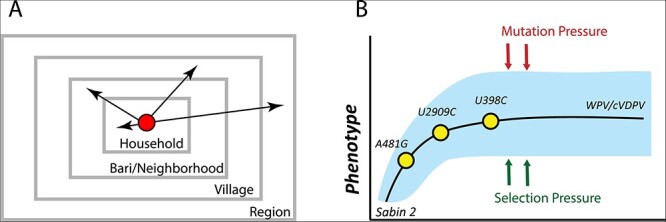
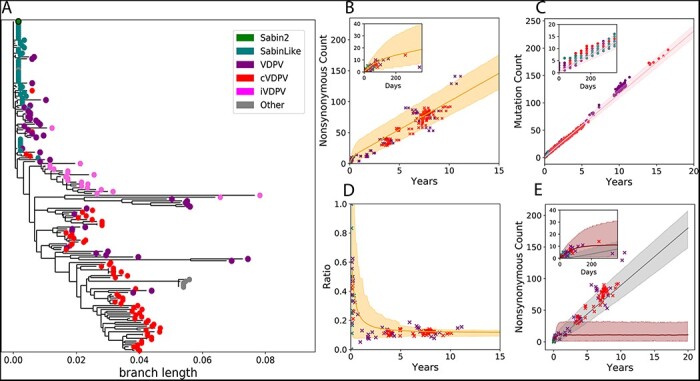
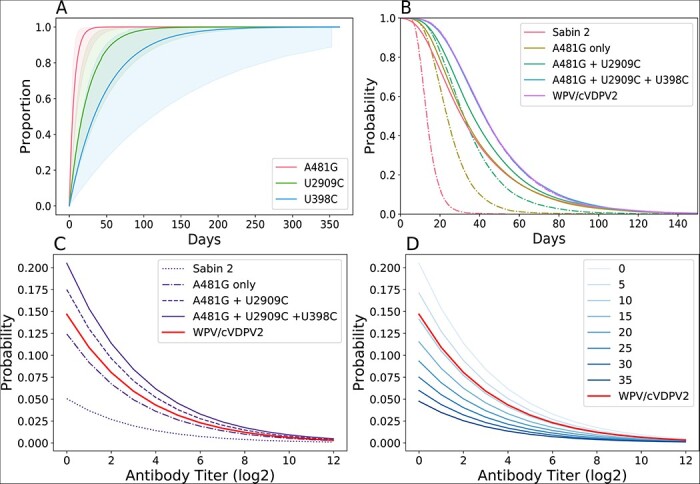
The oral poliovirus vaccines (OPVs) are one of the most effective disease eradication tools in public health. However, the OPV strains are genetically unstable and can cause outbreaks of circulating, vaccine-derived Type 2 poliovirus (cVDPV2) that are clinically indistinguishable from wild poliovirus (WPV) outbreaks. Here, we developed a Sabin 2 reversion model that simulates the reversion of Sabin 2 to reacquire a WPV-like phenotype based on the clinical differences in shedding duration and infectiousness between individuals vaccinated with Sabin 2 and those infected with WPV. Genetic reversion is informed by a canonical reversion pathway defined by three gatekeeper mutations (A481G, U2909C, and U398C) and the accumulation of deleterious nonsynonymous mutations. Our model captures essential aspects of both phenotypic and molecular evolution and simulates transmission using a multiscale transmission model that consolidates the relationships among immunity, susceptibility, and transmission risk. Despite rapid Sabin 2 attenuation reversal, we show that the emergence of a revertant virus does not guarantee a cVDPV2 outbreak. When simulating outbreaks in Matlab, Bangladesh, we found that cVDPV2 outbreaks are most likely in areas with low population-level immunity and poor sanitation. In Matlab, our model predicted that declining immunity against Type 2 poliovirus following the cessation of routine OPV vaccination was not enough to promote cVDPV2 emergence. However, cVDPV2 emergencedepended on the average viral exposure dose per contact, which was modeled as a combination of the viral concentration per fecal gram and the average fecal-oral dose per contact. These results suggest that cVDPV2 emergence risk can be mitigated by reducing the amount of infectious fecal material individuals are exposed to. Thus, a combined strategy of assessing and improving sanitation levels in conjunction with high-coverage vaccination campaigns could limit the future cVDPV2 emergence.

Keywords: Sabin 2; cVDPV2; evolution; genetic reversion; modeling; poliovirus; vaccine.


Conflict of interest statement

The authors declare no competing interests during the study. W.W., J.G., and M.F. were employed by the funders through the Bill and Melinda Gates Foundation after the study completion.

Figures

Figure 1.
Figure 1.
Sabin 2 transmission and reversion schematic. (A) A multiscale epidemiology model. To simulate household and community member–specific transmission rates, individuals are organized into a series of nested, demographic scales defined by households, baris/neighborhoods, and villages that together define the greater region. The bari is an intergenerational living arrangement of closely related individuals specific to Matlab, the study population the epidemiology model was calibrated to. Conceptually, it is analogous to a neighborhood. Infectious contacts occur at different rates to individuals in each of these demographic scales. During each infectious contact, infected individuals transmit a viral dose that depends on their individual viral shedding concentration and the average fecal–oral dose per contact in the population. (B) Sabin 2 reversion model. Sabin 2 evolution is modeled as a population of competing viral lineages whose average phenotypic end-state distribution is identical to that of WPV. The reversion is driven by the acquisition of three gatekeeper mutations (A481G, U2909C, and U398C) and the acquisition of deleterious mutations introduced through mutation and purged through selection.
Figure 2.
Figure 2.
Molecular evolution. (A) A phylogenetic tree based on the nonsynonymous mutations from the 177 whole genome sequences used to calibrate our model. Samples were categorized as Sabin 2, Sabin-like, VDPV isolated from immunocompromised individuals (iVDPV), VDPV, and cVDPV2, as classified in the original publications associated with the sequences. The other category includes the Lansing and MEF-1 laboratory strains as well as several engineered strains derived from the Lansing strain. Samples classified as iVDPV or ‘other’ were excluded from the model calibration. The tree was generated by defining Sabin 2 as the root to emphasize convergent evolution across outbreaks at the amino acid level. (B) Simulated genome-wide nonsynonymous mutation accumulation over time (shading, orange) compared against those observed in the Sabin 2, Sabin-like, VDPV, and cVDPV2 whole genome sequences. (C) Simulated (shading, pink) VP1 mutation (synonymous and nonsynonymous) accumulation over time compared against the mutation counts observed in 1,643 VP1 segments. (D) The ratio of nonsynonymous and synonymous mutations throughout the genome over time. (E) Simulated genome-wide nonsynonymous counts partitioned into deleterious (dark shading, brown) and neutral (light shading, gray). Across all figures, the solid line is the mean simulation outcome, and the shaded area marks the boundaries of the middle 95 per cent. Empirical data are represented by points and colored according to the legend in A. Time was calculated by dividing the number of synonymous mutations per sample by the synonymous substitution rate (3.16E-05 substitutions/bp/day). The insets in B, C, and E are close-ups of the first year of evolution to better show short-term evolution dynamics.
Figure 3.
Figure 3.
Phenotypic evolution. (A) Cumulative density reversion probability functions for the three gatekeeper mutations. The solid line is the mean and the shading is the 95 per cent confidence interval. (B) The shedding duration profile of immunologically naive individuals infected with Sabin 2, WPV/cVDPV2, and three different intermediate viral genotypes. The dotted lines are the shedding durations of the initial viral genotype, assuming no further reversion or evolution. The solid lines are the shedding durations of each viral genotype, where the reversion of new gatekeeper mutations extends the current shedding duration. Nonsynonymous mutations have no discernible phenotypic effect with regard to shedding duration. (C and D) Viral infectiousness. Each curve shows the strain-specific probability of infection, given a single CCID50 dose plotted against immunity. (C) Shows infectiousness following the acquisition of each of the three gatekeeper mutations. (D) Emphasizes the role of deleterious nonsynonymous mutations and shows the infection probability of different viral genotypes with all gatekeeper mutations and deleterious nonsynonymous mutation counts ranging from 0 to 35.
Figure 4.
Figure 4.
Evo-epidemiological dynamics following a mass vaccination campaign targeting 10 per cent of children under 5, five years post-vaccination cessation in Matlab, Bangladesh. Simulations assume ten times the fecal–oral dose in Matlab to ensure stable transmission and conditioned on stable, endemic transmission for at least 3 years. (A) The total number of infected individuals over time. The solid line indicates the smoothed average and the shading indicates the boundaries of the middle 95 per cent from 600 simulations. (B) Smoothed longitudinal immune profiles for individuals with low immunity (red, antibody titer <8), intermediate immunity (light blue, antibody titer >8 and <256), and high immunity (dark blue, antibody titer >256). (C) Smoothed shedding duration evolution in naive individuals over time. (D) Smoothed viral infectiousness evolution over time. Note the wider confidence intervals in surrounding shedding duration and shedding duration between Days 200 and 600 resulting from strong genetic drift. For B–D, the solid line denotes the simulated average and the boundaries denote the 95 per cent confidence interval around the mean. For C and D, the dashed black line indicates the average WPV phenotype.
Figure 5.
Figure 5.
cVDPV2 outbreak risk. cVDPV2 emergence after an mOPV2 vaccination campaign (A–C) or importation of a single infant immunized with Sabin 2 (D–F) occurring up to 5 years of vaccination cessation with fecal–oral doses equivalent to Matlab (4.0e-7 grams per contact, A/D), five times greater (2.0e-6 grams per contact, B/E), and ten times greater (4.0e-6 grams per contact, C/F) than that inferred for Matlab during an mOPV2 clinical trial. Each cell in the heatmap represents results from 800 simulation runs.

References

    1. Abraham R. et al. (1993) ‘Shedding of Virulent Poliovirus Revertants during Immunization with Oral Poliovirus Vaccine after Prior Immunization with Inactivated Polio Vaccine’, Journal of Infectious Diseases, 168: 1105–9. - PubMed
    1. Almond J. W. (1987) ‘The Attenuation of Poliovirus Neurovirulence’, Annual Review of Microbiology, 41: 153–80. - PubMed
    1. Asghar H. et al. (2014) ‘Environmental Surveillance for Polioviruses in the Global Polio Eradication Initiative’, Journal of Infectious Diseases, 210: S294–303. - PMC - PubMed
    1. Badizadegan K., Kalkowska D. A., and Thompson K. M. (2022) ‘Polio by the Numbers – A Global Perspective’, The Journal of Infectious Diseases, 226: 1309–18. - PMC - PubMed
    1. Bandyopadhyay A. S. et al. (2015) ‘Polio Vaccination: Past, Present and Future’, Future Microbiology, 10: 791–808. - PubMed