. 2023 Jun 21;8(5):e10551.
doi: 10.1002/btm2.10551. eCollection 2023 Sep.

Automated microarray platform for single-cell sorting and collection of lymphocytes following HIV reactivation

Affiliations

Automated microarray platform for single-cell sorting and collection of lymphocytes following HIV reactivation

Belén Cortés-Llanos et al. Bioeng Transl Med. .

Abstract

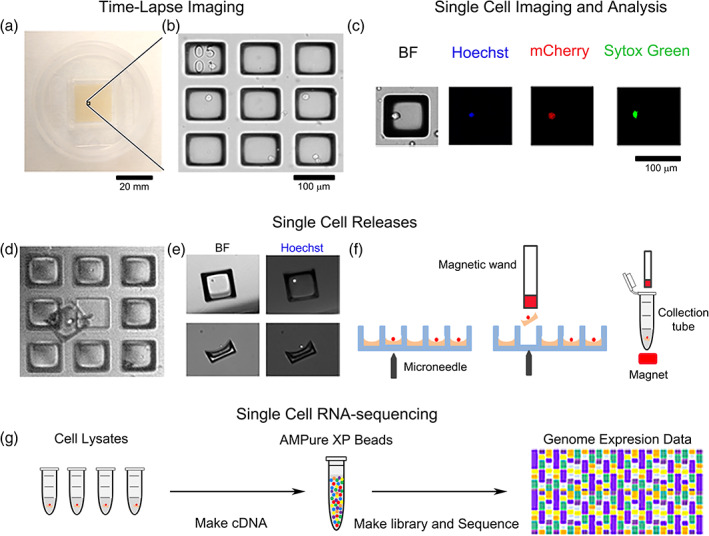
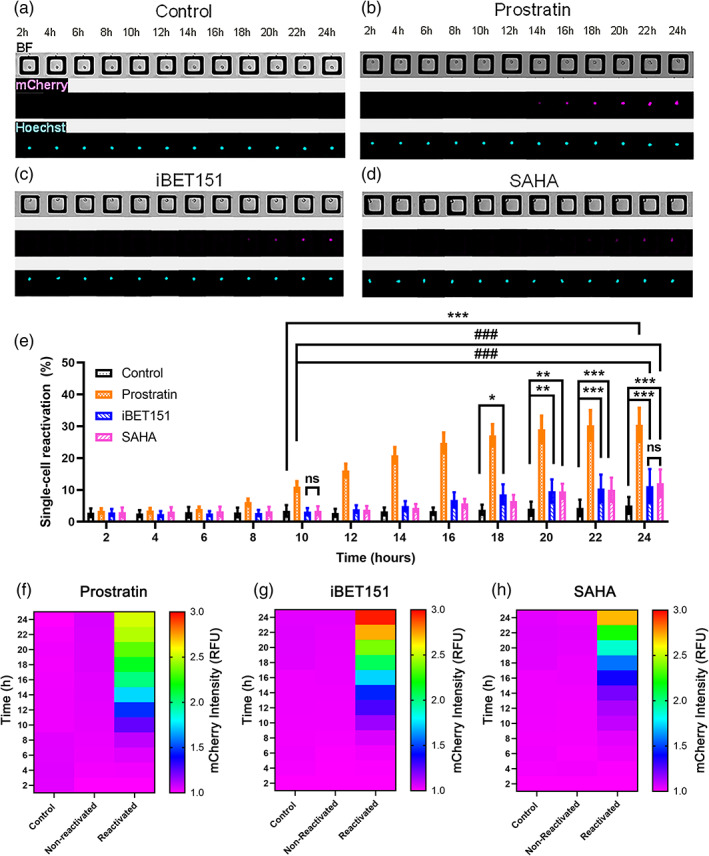
A promising strategy to cure HIV-infected individuals is to use latency reversing agents (LRAs) to reactivate latent viruses, followed by host clearance of infected reservoir cells. However, reactivation of latent proviruses within infected cells is heterogeneous and often incomplete. This fact limits strategies to cure HIV which may require complete elimination of viable virus from all cellular reservoirs. For this reason, understanding the mechanism(s) of reactivation of HIV within cellular reservoirs is critical to achieve therapeutic success. Methodologies enabling temporal tracking of single cells as they reactivate followed by sorting and molecular analysis of those cells are urgently needed. To this end, microraft arrays were adapted to image T-lymphocytes expressing mCherry under the control of the HIV long terminal repeat (LTR) promoter, in response to the application of LRAs (prostratin, iBET151, and SAHA). In response to prostratin, iBET151, and SAHA, 30.5%, 11.2%, and 12.1% percentage of cells, respectively. The arrays enabled large numbers of single cells (>25,000) to be imaged over time. mCherry fluorescence quantification identified cell subpopulations with differing reactivation kinetics. Significant heterogeneity was observed at the single-cell level between different LRAs in terms of time to reactivation, rate of mCherry fluorescence increase upon reactivation, and peak fluorescence attained. In response to prostratin, subpopulations of T lymphocytes with slow and fast reactivation kinetics were identified. Single T-lymphocytes that were either fast or slow reactivators were sorted, and single-cell RNA-sequencing was performed. Different genes associated with inflammation, immune activation, and cellular and viral transcription factors were found.

Keywords: HIV latency reactivation; microarrays; single‐cell; time‐lapse imaging.


Conflict of interest statement

Nancy L. Allbritton discloses a financial interest in cell microsystems, Inc. All other authors declare no conflicts.

Figures

FIGURE 1
FIGURE 1
Overview of the automated pipeline to assay gene expression in single cells during drug‐induced reactivation of LChIT3.2 cells. (a) Photograph of a microraft array. (b) A section of an array demonstrating nine microrafts, of which four microrafts possessed a single lymphocyte. The upper left corner raft demonstrates a fiducial marker (0501) for array position location. (c) Cells were imaged by brightfield (BF) and fluorescence microscopy to detect mCherry, Hoechst 33342, and Sytox Green fluorescence. Shown are four images of the same raft possessing a single cell. (d) Selected microrafts were released using a microneedle. Shown is a single released microraft that was allowed to settle back down onto the array for imaging. A single cell is attached to the microraft surface. (e) Released microrafts following collection and deposition into a receptacle using a magnetic wand. (f) A schematic of the steps in panels d and e. (g) Collected cells were processed for gene expression analysis.
FIGURE 2
FIGURE 2
Reactivation of LChIT3.2 cells by LRAs. (a–d) Brightfield and fluorescence images of single cells on the microraft arrays over 24 h (a) without an LRA and with an LRA: (b) prostratin, (c) iBET151, and (d) SAHA. (e) The total percentage of cells reactivated over time is shown for the unexposed control and LRA‐exposed cells. Shown is the average of the data points and the error bars represent one standard deviation (control: n = 8 arrays, with 5807 single cells; prostratin: n = 9 with 8412 single cells; iBET151: n = 4 arrays, 5118 single cells and SAHA: n = 4 arrays, 6354 single cells). A two‐way ANOVA was performed with multiple comparisons, where *p < 0.05, **p < 0.01, and ***p < 0.001 showed the differences between the control with the LRAs. While ###p < 0.001, and ns (no significant differences), showed differences between LRAs. (f–h) Heat maps of mCherry fluorescence intensity for cells exposed to: (f) prostratin‐ non‐reactivated (5657 cells) and reactivated (2755 cells), (g) iBET151‐ non‐reactivated (4495 cells) and reactivated (623 cells) and (h) SAHA‐ non‐reactivated (5902 cells) and reactivated (452 cells) as well as the control group of cells (unexposed cells, 5807 cells) from each of these experiments.
FIGURE 3
FIGURE 3
Response of single cells to LRAs. (a) Violin plot of the rate of mCherry fluorescence intensity increase for cells reactivated in response to the LRAs (prostratin: n = 9 arrays; iBET151: n = 3 arrays; SAHA: n = 3 arrays). (b–d) mCherry fluorescence intensity (y‐axis) at first observed time (fluorescence time) of elevated fluorescence for cells reactivated in response to prostratin (n = 1 array 347 reactivated single cells) (b), iBET151 (n = 1 array, 64 reactivated single cells) (c), or SAHA (d) (n = 1 array, 46 reactivated single cells) for one representative experiment. Each data point represents a single cell and the crosshatch the centroid of the data points. (e) Violin plot of the fluorescence intensity at 24 h after exposure to the LRAs. For panels (a) and (e), the solid horizontal line marks the median while the dashed horizontal lines the quartiles.
FIGURE 4
FIGURE 4
Slow and fast reactivated cells in response to prostratin. (a–d) Bright field and fluorescence images (mCherry and Hoechst 33342) of a control single cell (no LRA, a), and single cells at different times after exposure to prostratin: non‐reactivated (b), fast reactivated (c), and slow reactivated (d) cell. (e) Average mCherry intensity for each reactivation category over time. A two‐way ANOVA was performed with multiple comparisons between the fluorescence intensity of the control to that of the fast and slow groups over time (*p < 0.05, **p < 0.01, and ***p < 0.001). While ###p < 0.001 showed differences between fast and slow groups. RFU = relative fluorescence units. (f) Shown is the percentage of cells in the non‐reactivation (gray, n = 9 arrays, 5767 single cells), fast (red, n = 9 arrays, 1355 single cells), and slow (green, n = 9 arrays, 1355 single cells) reactivation categories. (g) mCherry fluorescence intensity (y‐axis) at first observed time (fluorescence time) of elevated fluorescence for cells reactivated in response to prostratin. Each data point represents a single cell and the crosshatch the centroid of the data points (n = 1 array, 209 fast single cells and 138 slow single cells). (h) Violin plot of the rate of mCherry fluorescence intensity increase for cells reactivated in response to the LRAs. The solid horizontal line marks the median while the dashed horizontal lines marks the quartiles.
FIGURE 5
FIGURE 5
(a) scRNA‐seq quality control for all single cells in each group, control, non‐reactivated, fast, and slow reactivating cells collected at 24 h. (b) UMAP clusters for control (red), non‐reactivated (blue), fast (green) and slow (purple) reactivated cells. (c) Volcano plot of significantly differentially expressed genes in reactivated cells related to non‐reactivated cells. Red dots represent genes with higher expression levels with adjusted log10 p‐value (0.05) and log2 fold change (0.5). The right red dots are related to upregulated genes and the left red dots to downregulated genes in reactivated cells. Green dots represent significantly different genes with an adjusted log p value < 0.05 and lower log2 fold change value. Blue dots represent genes with a greater log2 fold change but an adjusted log p‐value higher than 0.05. Black dots are non‐significant genes. (d) Gene ontology (GO) analysis showing different processes of upregulated genes in reactivated cells compared with non‐reactivated cells.
FIGURE 6
FIGURE 6
Volcano plots of significantly differentially expressed genes in (a) fast and (b) slow reactivating cells compared with control cells (no LRA). Red dots represent genes with higher expression levels with adjusted log10 p‐value (0.05) and log2 fold change (0.5). The right red dots are related to upregulated genes in fast and slow reactivating cells, while the left red dots are downregulated genes. Green dots represent significantly differentially expressed genes with an adjusted log p value <0.05 with a lower log2FC value. Blue dots represent genes with a greater log2FC but an adjusted log p‐value higher than 0.05. Black dots are non‐significant genes.
FIGURE 7
FIGURE 7
Gene ontology (GO) analysis showing different processes of upregulated genes in (a) fast and (b) slow cells compared with control cells.

Update of

References

    1. UNAIDS data 2020. Accessed January 19, 2022. https://www.unaids.org/en/resources/documents/2020/unaids-data
    1. Sengupta S, Siliciano RF. Targeting the latent reservoir for HIV‐1. Immunity. 2018;48(5):872‐895. doi:10.1016/j.immuni.2018.04.030 - DOI - PMC - PubMed
    1. Wang Z, Simonetti FR, Siliciano RF, Laird GM. Measuring replication competent HIV‐1: advances and challenges in defining the latent reservoir. Retrovirology. 2018;15(1):21. doi:10.1186/s12977-018-0404-7 - DOI - PMC - PubMed
    1. Neidleman J, Luo X, Frouard J, et al. Phenotypic analysis of the unstimulated in vivo HIV CD4 T cell reservoir. In: Overbaugh J, Rath S, Blish C, Gianella S, eds. eLife. Vol 9. eLife; 2020:e60933. doi:10.7554/eLife.60933 - DOI - PMC - PubMed
    1. Han Y, Wind‐Rotolo M, Yang HC, Siliciano JD, Siliciano RF. Experimental approaches to the study of HIV‐1 latency. Nat Rev Microbiol. 2007;5(2):95‐106. doi:10.1038/nrmicro1580 - DOI - PubMed

LinkOut - more resources