[Preprint]. 2023 Sep 3:2023.08.31.555785.
doi: 10.1101/2023.08.31.555785.

Tick hemocytes have pleiotropic roles in microbial infection and arthropod fitness

Affiliations

Tick hemocytes have pleiotropic roles in microbial infection and arthropod fitness

Agustin Rolandelli et al. bioRxiv. .

Update in

  • Tick hemocytes have a pleiotropic role in microbial infection and arthropod fitness.
    Rolandelli A, Laukaitis-Yousey HJ, Bogale HN, Singh N, Samaddar S, O'Neal AJ, Ferraz CR, Butnaru M, Mameli E, Xia B, Mendes MT, Butler LR, Marnin L, Cabrera Paz FE, Valencia LM, Rana VS, Skerry C, Pal U, Mohr SE, Perrimon N, Serre D, Pedra JHF. Rolandelli A, et al. Nat Commun. 2024 Mar 8;15(1):2117. doi: 10.1038/s41467-024-46494-3. Nat Commun. 2024. PMID: 38459063 Free PMC article.

Abstract

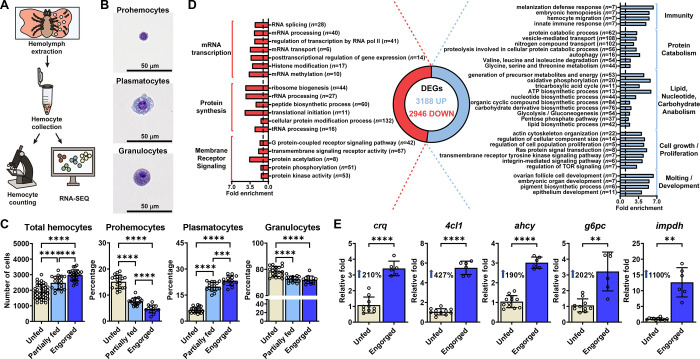
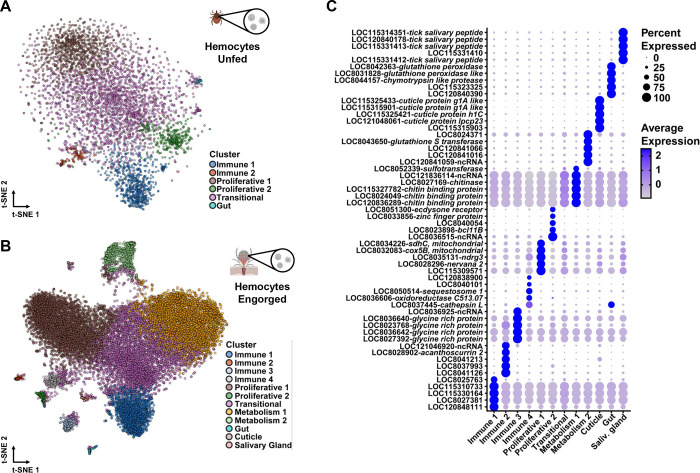
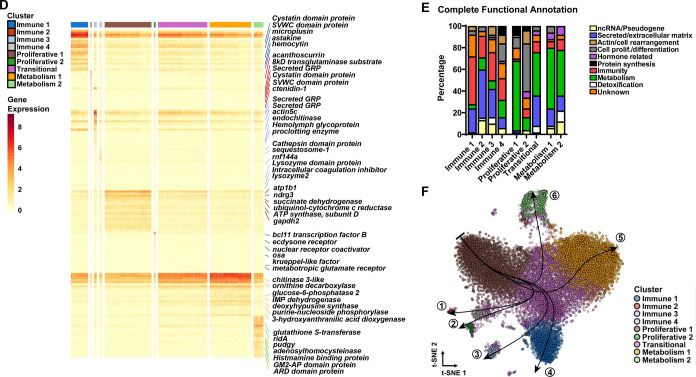
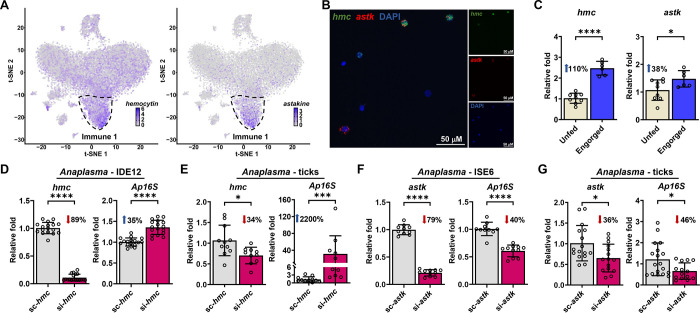
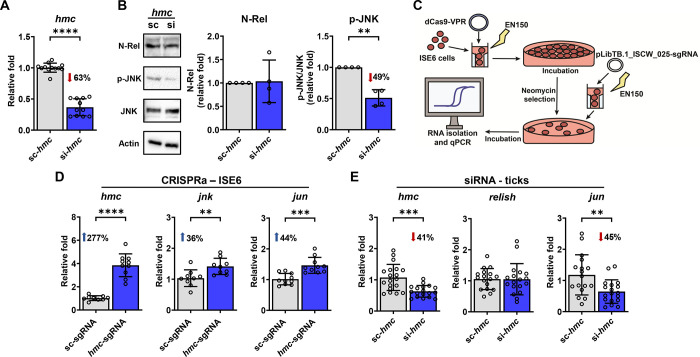
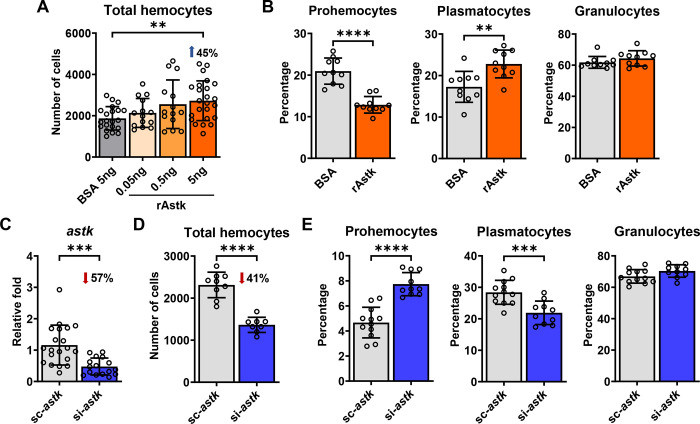
Uncovering the complexity of systems in non-model organisms is critical for understanding arthropod immunology. Prior efforts have mostly focused on Dipteran insects, which only account for a subset of existing arthropod species in nature. Here, we describe immune cells or hemocytes from the clinically relevant tick Ixodes scapularis using bulk and single cell RNA sequencing combined with depletion via clodronate liposomes, RNA interference, Clustered Regularly Interspaced Short Palindromic Repeats activation (CRISPRa) and RNA-fluorescence in situ hybridization (FISH). We observe molecular alterations in hemocytes upon tick infestation of mammals and infection with either the Lyme disease spirochete Borrelia burgdorferi or the rickettsial agent Anaplasma phagocytophilum. We predict distinct hemocyte lineages and reveal clusters exhibiting defined signatures for immunity, metabolism, and proliferation during hematophagy. Furthermore, we perform a mechanistic characterization of two I. scapularis hemocyte markers: hemocytin and astakine. Depletion of phagocytic hemocytes affects hemocytin and astakine levels, which impacts blood feeding and molting behavior of ticks. Hemocytin specifically affects the c-Jun N-terminal kinase (JNK) signaling pathway, whereas astakine alters hemocyte proliferation in I. scapularis. Altogether, we uncover the heterogeneity and pleiotropic roles of hemocytes in ticks and provide a valuable resource for comparative biology in arthropods.

Keywords: Anaplasma phagocytophilum; Borrelia burgdorferi; Hematophagy; Hemocytes; Tick-Borne Diseases.


Figures

Figure 1:
Figure 1:. Blood-feeding induces alterations in I. scapularis hemocytes.
(A) Schematic representation of the hemocyte collection procedure. (B) Three main morphological subtypes of I. scapularis hemocytes evaluated by bright field microscopy after staining. (C) Total number of hemocytes and morphotype percentages from unfed (ivory), partially fed (light blue) or engorged (dark blue) nymphs (n=13–40). (D) Functional enrichment analysis of the differentially expressed genes (DEGs) present in hemocytes from engorged ticks (blue; Up) compared to unfed ticks (red; Down). Fold enrichment of significant terms are depicted. Number of DEGs per category are shown in parentheses. (E) The expression of immune, metabolic and proliferative genes in hemocytes from unfed (ivory) and engorged (dark blue) ticks was evaluated by RT-qPCR (n=6–12; samples represent 40–80 pooled ticks). Results are represented as mean ± SD. At least three biological replicates were performed. Statistical significance was evaluated by (C) ANOVA or (E) an unpaired t-test with Welch’s correction. **p<0.01; ****p<0.0001. crq = croquemort; 4cl1 = 4-coumarate-CoA ligase 1; ahcy = adenosylhomocysteinase B; g6pc = glucose-6-phosphatase 2; impdh = inosine-5’-monophosphate dehydrogenase 1.
Figure 2:
Figure 2:. scRNA-seq uncovers hemocytes with immune, proliferative and metabolic signatures in I. scapularis.
t-Distributed Stochastic Neighbor Embedding (t-SNE) plot clustering of cells collected from the hemolymph of (A) unfed (4,630 cells) and (B) engorged (15,802 cells) I. scapularis nymphs. The engorged t-SNE contains cells from uninfected (6,000 cells), A. phagocytophilum-infected (6,287 cells) and B. burgdorferi-infected (3,515 cells) I. scapularis. (C) Dot plot of the top 5 marker genes present in clusters from engorged ticks. Average gene expression is demarked by intensity of color. Percent of gene expression within individual clusters is represented by the dot diameter. (D) Heatmap depicting expression of the top 20 marker genes present in hemocyte subtypes from engorged ticks. Representative genes per cluster are highlighted. (E) The top 50 marker genes from each hemocyte cluster were manually annotated using publicly available databases, such as VectorBase, FlyBase, and UniProt. The percentage of predicted functional categories, such as ncRNA/pseudogenes (yellow), protein synthesis (black), secreted/extracellular matrix (blue), unknown (orange), actin/cell rearrangement (brown), detoxification (white), cell proliferation/differentiation (grey), metabolism (green), hormone-related (purple), and immunity (red) are shown. (F) Pseudotime analysis defined six hemocyte lineages (arrows) in engorged ticks.
Figure 3:
Figure 3:. Bacterial infection alters hemocyte subtypes and their molecular expression.
(A) Hemocyte morphotypes in I. scapularis nymphs fed on A. phagocytophilum- (Ap, pink) or B. burgdorferi- (Bb, green) infected mice compared to uninfected [(−), dark blue] (n=10–16). Results are represented as mean ± SD. At least two biological replicates were performed. Statistical significance was evaluated by an unpaired t-test with Welch’s correction. *p < 0.05; **p < 0.01; ****p<0.0001. ns= not significant. (B) t-Distributed Stochastic Neighbor Embedding (t-SNE) plot clustering of cells collected from the hemolymph of uninfected (6,000 cells), A. phagocytophilum- (6,287 cells) or B. burgdorferi-infected (3,515 cells) I. scapularis nymphs. (C) Percent of hemocyte clusters present in each experimental condition. (D) Venn diagram (left) depicting the number of differentially expressed genes (DEGs) during infection between clusters grouped by putative function (immune, proliferative or metabolic). Heatmap (right) representing the change in expression patterns of DEGs during infection shared between all 3 cluster groups. DEGs were determined using pairwise comparisons against uninfected. # = Immune 1 marker gene. (−) = Uninfected. Anaplasma = A. phagocytophilum. Borrelia = B. burgdorferi.
Figure 4:
Figure 4:. Hemocytin (hmc) and astakine (astk) affect A. phagocytophilum infection.
(A) Expression of hmc (left) and astk (right) on t-Distributed Stochastic Neighbor Embedding (t-SNE) plots of hemocytes collected from engorged nymphs, with their highest expression denoted in the Immune 1 cluster (outlined). (B) RNA FISH of I. scapularis hemocytes probed for hmc (green), astk (red), and nuclei (DAPI). (C) Expression of hmc (left) and astk (right) in hemocytes from unfed (ivory) or engorged (dark blue) ticks were evaluated by RT-qPCR (n=6–9; samples represent 40–80 pooled ticks). (D) hmc (left) silencing efficiency and A. phagocytophilum burden (right) in IDE12 cells. Cells were transfected with hmc siRNA (si-hmc) or scrambled RNA (sc-hmc) for seven days prior to A. phagocytophilum infection (n=17–18). (E) hmc silencing efficiency (left) and bacterial acquisition (right) in ticks microinjected with si-hmc or sc-hmc fed on A. phagocytophilum-infected mice (n=10–11). (F) astk silencing efficiency (left) and A. phagocytophilum burden (right) in ISE6 cells. Cells were transfected with astk siRNA (si-astk) or scrambled RNA (sc-astk) for seven days prior to A. phagocytophilum infection (n=10–11). (G) astk silencing efficiency (left) and bacterial acquisition (right) in ticks microinjected with si-astk or sc-astk fed on A. phagocytophilum-infected mice (n=14–18). Bacterial burden was quantified by A. phagocytophilum 16srRNA (Ap16S) expression. Results are represented as mean ± SD. At least two biological replicates were performed. Statistical significance was evaluated by an (C-D, F-G) unpaired t-test with Welch’s correction or (E) Mann–Whitney U test. *p<0.05; ***p<0.001; ****p<0.0001.
Figure 5:
Figure 5:. Hemocytin (hmc) positively impacts the JNK pathway in I. scapularis.
(A) Cells were transfected with hmc siRNA (si-hmc) or scrambled RNA (sc-hmc) (n=11–12). hmc silencing efficiency in IDE12 cells. (B) Representative western blot (left) of N-Rel and p-JNK during treatment with sc-hmc (lane 1) or si-hmc (lane 2). N-Rel and p-JNK protein expression was quantified (right) in si-hmc (blue) or sc-hmc (grey) IDE12 cells. For data normalization, values were divided by the scrambled control value. N-Rel values are normalized to Actin and p-JNK values are normalized to JNK. Western blot images show one representative experiment out of four. (C) Schematic of CRISPRa overexpression of hmc in ISE6 cells. (D) Expression of hmc (left) jnk (middle) and jun (right) in dCas9+ISE6 cells transfected with the hmc-sgRNA (blue) compared with the scrambled-sgRNA (grey) evaluated by RT-qPCR (n=9–10). (E) hmc (left), relish (middle) and jun (right) expression in ticks microinjected with hmc siRNA (si-hmc; blue) or scrambled RNA (sc-hmc; grey) fed on uninfected mice (n=17–19). Results are represented as mean ± SD. At least two biological replicates were performed. Statistical significance was evaluated by an unpaired t-test with Welch’s correction. **p<0.01; ***p<0.001; ****p<0.0001. N-Rel = cleaved Relish; p-JNK = phosphorylated JNK; JNK = c-Jun N-terminal kinase.
Figure 6:
Figure 6:. Astakine (astk) induces hemocyte proliferation and differentiation in I. scapularis.
(A) Total number of hemocytes collected from unfed I. scapularis nymphs microinjected with corresponding amounts of rAstk (orange) or bovine serum albumin (BSA; grey) as a control (n=14–24). (B) Percentage of hemocyte morphotypes present in unfed I. scapularis nymphs microinjected with 5ng rAstk (orange) compared to BSA controls (grey) (n=10). (C) astk silencing efficiency, (D) total number of hemocytes and (E) percentage of hemocyte morphotypes in engorged ticks previously microinjected with astk siRNA (si-astk; blue) or scrambled RNA (sc-astk; grey) and fed on uninfected mice (n=8–20). Results represent mean ± SD. At least two biological replicates were performed. Statistical significance was evaluated by (A) one-way ANOVA or (B-E) an unpaired t-test with Welch’s correction. **p<0.01; ***p<0.001; ****p<0.0001. rAstk=recombinant astakine.
Figure 7:
Figure 7:. Manipulation of hemocyte subtypes and their marker genes affects tick fitness.
(A-D) Ticks were microinjected with clodronate (blue) or empty liposomes as a control (grey) and allowed to feed on uninfected mice. (A) Total number of hemocytes (n=9) and (B) morphotype percentages were determined in the hemolymph (n=8–9). (C) Weight of engorged nymphs (n=25–34) and (D) expression of hemocytin (hmc) and astakine (astk) in individual ticks was measured (n=18–20). (E) Weight of engorged nymphs post-microinjection with hmc siRNA (si-hmc; blue) or scrambled RNA (sc-hmc; grey) fed on uninfected mice (n=20–23). (F) Weight of engorged nymphs microinjected with astk siRNA (si-astk; blue) or scrambled RNA (sc-astk; grey) fed on uninfected mice (n=21–29). (G) Percentage of nymphs that molted to adults after treated with si-hmc or sc-hmc and (H) si-astk or sc-astk. Results are represented as (A-F) mean ± SD or as (G-H) a percentage of ticks that molted from the total recovered after feeding. At least two biological replicates were performed. Statistical significance was evaluated by (A-B, D) an unpaired t-test with Welch’s correction, (C, E, F) Mann–Whitney U test or (G-H) by a Fisher exact test. *p<0.05; **p<0.01; ***p<0.001; ****p<0.0001.

Similar articles

References

    1. Schwenke R. A., Lazzaro B. P., Wolfner M. F., Reproduction-immunity trade-offs in insects. Annual Review of Entomology 61, 239–256 (2016). - PMC - PubMed
    1. Shaw D. K. et al., Vector immunity and evolutionary ecology: The harmonious dissonance. Trends in Immunology 39, 862–873 (2018). - PMC - PubMed
    1. Samaddar S., Marnin L., Butler L. R., Pedra J. H. F., Immunometabolism in arthropod vectors: redefining interspecies relationships. Trends in Parasitology 36, 807–815 (2020). - PMC - PubMed
    1. Palmer W. J., Jiggins F. M., Comparative genomics reveals the origins and diversity of arthropod immune systems. Molecular Biology and Evolution 32, 2111–2129 (2015). - PMC - PubMed
    1. Bechsgaard J. et al., Comparative genomic study of arachnid immune systems indicates loss of βGRPs and the IMD pathway. J Evol Biol 29, 19 (2015). - PMC - PubMed

Publication types