[Preprint]. 2023 Aug 29:2023.08.28.555225.
doi: 10.1101/2023.08.28.555225.

Protein Coronas on Functionalized Nanoparticles Enable Quantitative and Precise Large-Scale Deep Plasma Proteomics

Affiliations

Protein Coronas on Functionalized Nanoparticles Enable Quantitative and Precise Large-Scale Deep Plasma Proteomics

Ting Huang et al. bioRxiv. .

Abstract

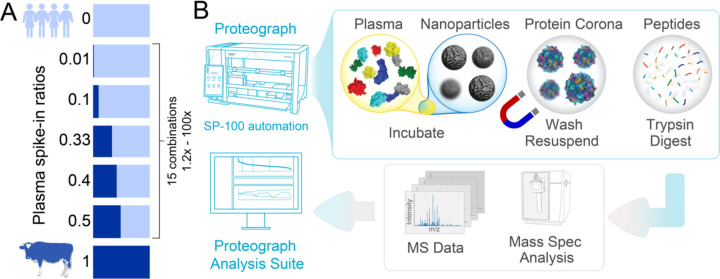
Background: The wide dynamic range of circulating proteins coupled with the diversity of proteoforms present in plasma has historically impeded comprehensive and quantitative characterization of the plasma proteome at scale. Automated nanoparticle (NP) protein corona-based proteomics workflows can efficiently compress the dynamic range of protein abundances into a mass spectrometry (MS)-accessible detection range. This enhances the depth and scalability of quantitative MS-based methods, which can elucidate the molecular mechanisms of biological processes, discover new protein biomarkers, and improve comprehensiveness of MS-based diagnostics.

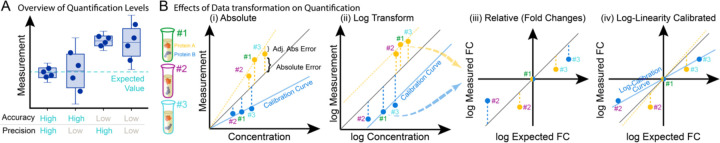
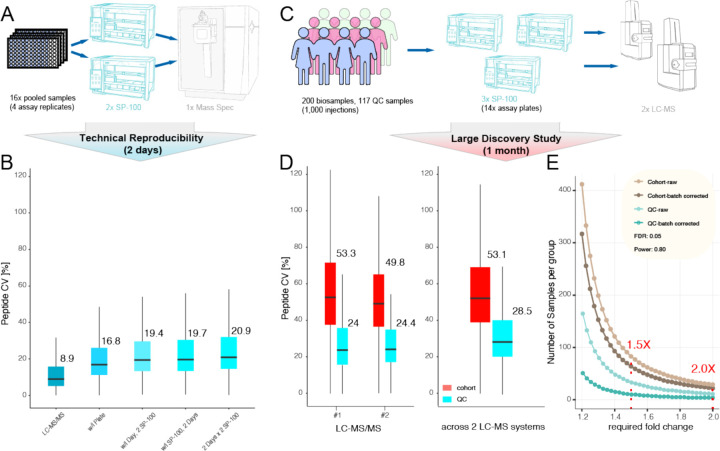
Methods: Investigating multi-species spike-in experiments and a cohort, we investigated fold-change accuracy, linearity, precision, and statistical power for the using the Proteograph Product Suite, a deep plasma proteomics workflow, in conjunction with multiple MS instruments.

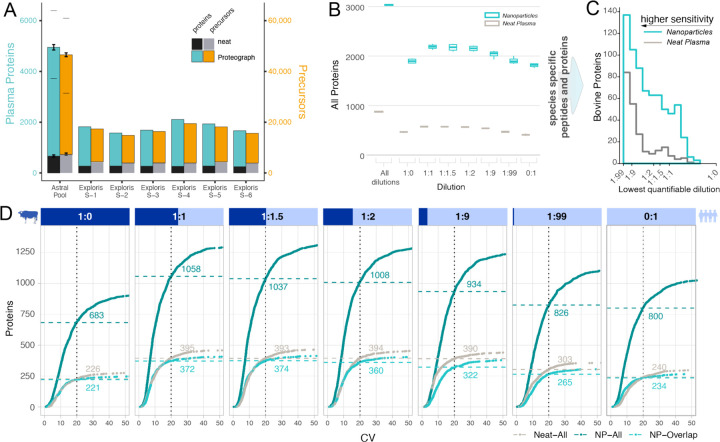
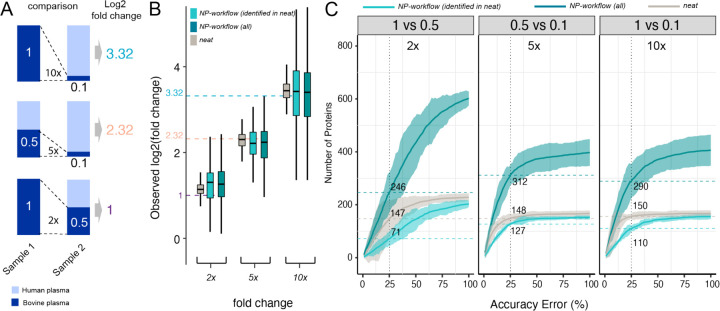
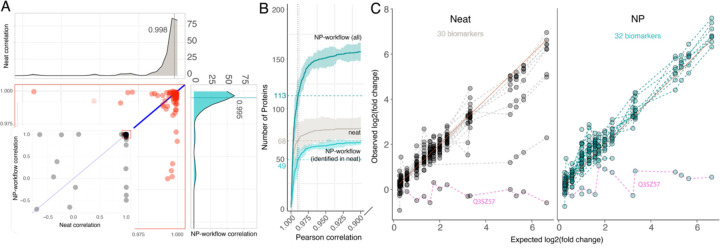
Results: We show that NP-based workflows enable accurate identification (false discovery rate of 1%) of more than 6,000 proteins from plasma (Orbitrap Astral) and, compared to a gold standard neat plasma workflow that is limited to the detection of hundreds of plasma proteins, facilitate quantification of more proteins with accurate fold-changes, high linearity, and precision. Furthermore, we demonstrate high statistical power for the discovery of biomarkers in small- and large-scale cohorts.

Conclusions: The automated NP workflow enables high-throughput, deep, and quantitative plasma proteomics investigation with sufficient power to discover new biomarker signatures with a peptide level resolution.

Keywords: LC-MS; Proteomics; clinical proteomics; cohort; nanoparticles; plasma; quantification.


Conflict of interest statement

Authors Disclosure or Potential Conflict of Interest O.C.F. has financial interest in Selecta Biosciences, Tarveda Therapeutics, and Seer where he is officer/director; and he serves as Senior Lecturer at BWH/HMS. S.F., Al.St., M.H., B.T., T.R.B., T.W., E.M.E., X.Z., E.S.O., A.A., B.L., J.C., M.F., J.W., M.G., H.X., C.S., Y.H., S.B., A.S., V.F., O.C.F., D.H. have financial interest in Seer, S.F., B.T., T.R.B., T.W., E.M.E., E.S.O., X.Z., T.W., J.C., M.F., J.W., M.G., H.X., C.S., A.S., V.F., O.C.F., D.H. have financial interest in PrognomiQ. E.D., T.A., A.H. are employed by Thermo Fisher Scientific. R.W. is a consultant to ModeRNA, Lumicell, Seer, Earli, and Accure Health. All other authors declare no conflicts of interest.

Figures

Figure 1.
Figure 1.. Overview of Quantification Levels and Data Transformation.
(A) Two quantitative performance metrics are: 1) accuracy, measuring how close a measurement is to the true value; and 2) precision, measuring how close are the measurements across replicate analyses. (B) The measurement of two proteins (A, orange, and B, blue) across 3 biosamples (samples #1, #2, and #3) illustrates three layers of quantification accuracy: absolute accuracy (i and ii for untransformed and log-transformed data, respectively), relative fold-change (FC) accuracy (iii), and linearity (iv).
Figure 2.
Figure 2.. Study Overview.
(A) Experimental design of the spike-in experiment, in which a bovine plasma proteome is spiked into a human plasma proteome at seven different ratios. (B) Proteograph workflow overview which includes protein corona formation, proteins denaturation, reduction, alkylation, protein digestion, and peptide desalting on the Proteograph SP100 automation instrument. Peptides are quantified, dried, and resuspended before injection onto an LC-MS system.
Figure 3.
Figure 3.. Identification and Precision Performance of a Neat Plasma and NP-corona Workflow.
(A) Protein (left y-axis) and precursor identifications (right y-axis) determined for different LC-MS setups and biosamples comparing traditional neat workflows and NP workflow. Thermo Scientific Orbitrap Astral MS data was acquired for assay replicates standard deviations indicated by error bars, lower dash denoting identifications shared by all replicates (N=3), upper dash indicates identification across all replicates and nanoparticles. (B) The number of proteins quantified in mixed species plasma experiment on Exploris 480 at each ratio for the NP (teal) and neat workflow (grey), including bovine proteins and human proteins and those that are shared between species. Subsequent plots focused on species specific (unique) peptides and proteins. (C) Lower limits of quantification (LoQ) for bovine proteins quantified in both workflows. LoQ is the lowest level of dilution with a stringent quantitative response (lower is better). (D Number of proteins identified at a given coefficient of variation (CV) threshold for each spiked-in ratio. X-axis is the CV, and the Y-axis is the total number of bovine and human proteins quantified in four replicates with a CV lower than the given threshold. NP-workflow proteins also identified in neat (light teal), NP-workflow with all proteins (dark teal), and neat workflow (grey). Data shown is for IP10 human plasma pool.
Figure 4.
Figure 4.. Fold-change Accuracy Performance of a Neat Plasma and NP-corona Workflow.
(A) Three representative pairs of spiked-in samples and the expected fold-changes of bovine proteins concentration in these pairs. (B) Distribution of observed fold-changes of bovine proteins for 3 selected comparisons of spiked-in samples. The color indicates the data source: neat digestion (grey), Proteograph workflow (dark teal), or Proteograph workflow, but constrained to proteins also identified in neat (light teal). The horizontal dashed lines indicate the expected fold-changes. Boxplots report the 25% (lower hinge), 50%, and 75% quantiles (upper hinge). Whiskers indicate observations equal to or outside hinge ± 1.5 * interquartile range (IQR). Outliers (beyond 1.5 * IQR) are not plotted. (C) The number of bovine proteins identified at a given accuracy threshold for each expected fold-change. X-axis is the % accuracy error, i.e., |log2 FCobserved − log2 FCexpected|(log2 FCexpected. The Y-axis is the number of proteins with an accuracy error below the given threshold. The horizontal dashed lines indicate proteins reported at the 25% threshold. Ribbon denotes the 99th confidence interval. Data shown here are based on IP10.
Figure 5.
Figure 5.. Linearity of Protein Quantification for Neat and Proteograph Workflows.
Pearson correlation is calculated between observed and expected fold-changes of bovine proteins. (A) Neat digestion correlation versus Proteograph workflow correlation. Each dot represents one bovine protein. The marginal density plots show the distribution of Pearson correlation. 84 bovine proteins detected in all seven spiked-in ratios by both neat digestion (Grey color) and Proteograph workflows (Teal color) were plotted. (B) The number of bovine proteins identified at a given correlation threshold. X-axis is the Pearson correlation (truncated at 0.95), and the Y-axis is the number of bovine proteins with a correlation higher than the given threshold. The horizontal dashed lines indicate the number of proteins with a correlation ≥ 0.99. Proteograph workflow with proteins identified in neat workflow is colored in light teal, Proteograph workflow with all proteins is colored in dark teal, and neat digestion workflow is colored in grey. Data shown here are based on IP10. Plots depict bovine proteins only (identified with at least one bovine-specific peptide) that are detected at least once across all 15 pairwise comparisons. (C) Linearity of biomarkers matched to bovine proteins based on their gene symbols. 32 biomarkers were detected by the NP workflow while 30 biomarkers were detected in neat. Dashed lines connect the estimated fold-changes for each biomarker. Pink dashed line shows common outlier Q3SZ57. Selection of the most linearly responding peptides is based on Pearson correlation p-value determined for two assay replicates for matched biomarkers in neat workflow and NP-workflow. Depicted is the average of the two remaining replicates for the selected peptides.
Figure 6.
Figure 6.. Reproducibility and Statistical Power for Proteograph Workflow in large-scale Discovery Proteomics Studies.
(A) Experimental design of the reproducibility study. (B) Peptide level CV within and across plates, Proteograph SP100 automation instruments, and days of LC-MS analysis. (C) Experimental design of cohort study. (D) Peptide CV within and across LC-MS/MS instruments. (E) Statistical power analysis for a 200-sample, 1,000 injections cohort study detecting fold-change difference with 5% FDR and a power of 0.8.

References

    1. Bollineni RC, Guldvik IJ, Grönberg H, Wiklund F, Mills IG, Thiede B. A differential protein solubility approach for the depletion of highly abundant proteins in plasma using ammonium sulfate. Analyst. 2015;140:8109–17. - PubMed
    1. Blume JE, Manning WC, Troiano G, Hornburg D, Figa M, Hesterberg L, et al. Rapid, deep and precise profiling of the plasma proteome with multi-nanoparticle protein corona. Nat Commun. 2020;11:3662. - PMC - PubMed
    1. Ferdosi S, Tangeysh B, Brown TR, Everley PA, Figa M, McLean M, et al. Engineered nanoparticles enable deep proteomics studies at scale by leveraging tunable nano–bio interactions. Proc Natl Acad Sci United States Am. 2022;119:e2106053119. - PMC - PubMed
    1. Ferdosi S, Stukalov A, Hasan M, Tangeysh B, Brown TR, Wang T, et al. Enhanced Competition at the Nano–Bio Interface Enables Comprehensive Characterization of Protein Corona Dynamics and Deep Coverage of Proteomes (Adv. Mater. 44/2022). Adv Mater. 2022;34:2270307. - PubMed
    1. Donovan MKR, Huang Y, Blume JE, Wang J, Hornburg D, Mohtashemi I, et al. Peptide-centric analyses of human plasma enable increased resolution of biological insights into non-small cell lung cancer relative to protein-centric analysis. Biorxiv. 2022;2022.01.07.475393.

Publication types