[Preprint]. 2023 Sep 1:rs.3.rs-3307450.
doi: 10.21203/rs.3.rs-3307450/v1.

Computational Peptide Discovery with a Genetic Programming Approach

Affiliations

Computational Peptide Discovery with a Genetic Programming Approach

Nicolas Scalzitti et al. Res Sq. .

Update in

Abstract

Background: The development of peptides for therapeutic targets or biomarkers for disease diagnosis is a challenging task in protein engineering. Current approaches are tedious, often time-consuming and require complex laboratory data due to the vast search space. In silico methods can accelerate research and substantially reduce costs. Evolutionary algorithms are a promising approach for exploring large search spaces and facilitating the discovery of new peptides.

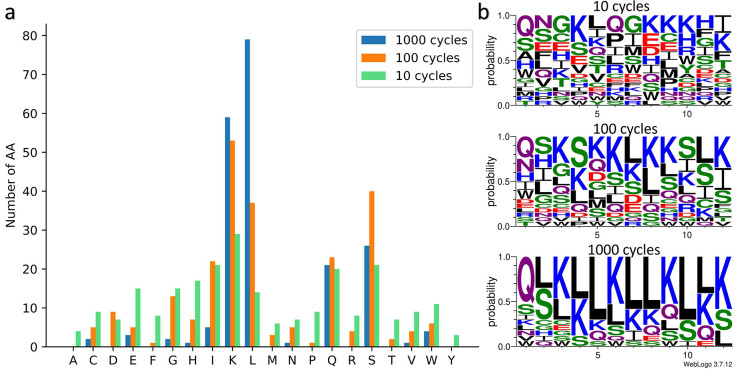
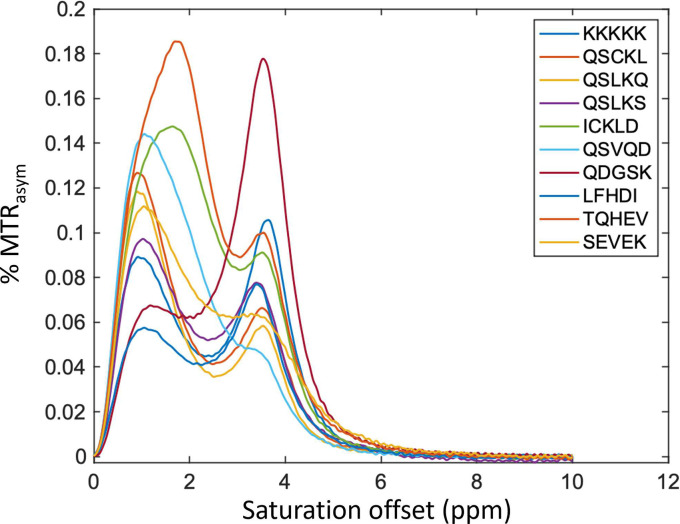
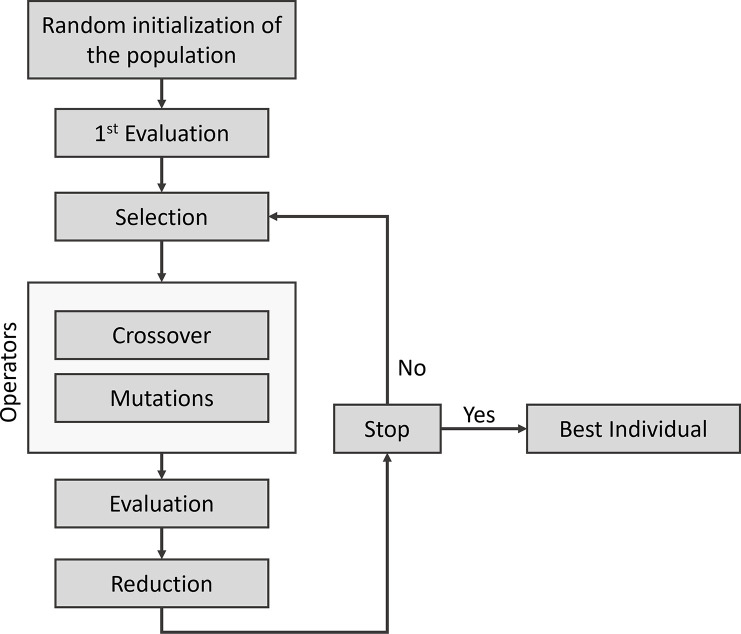
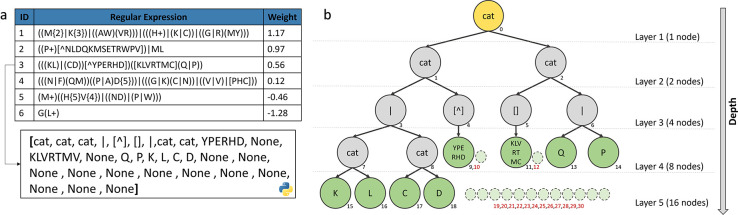
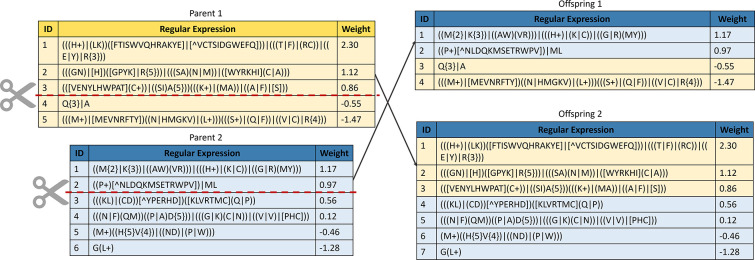
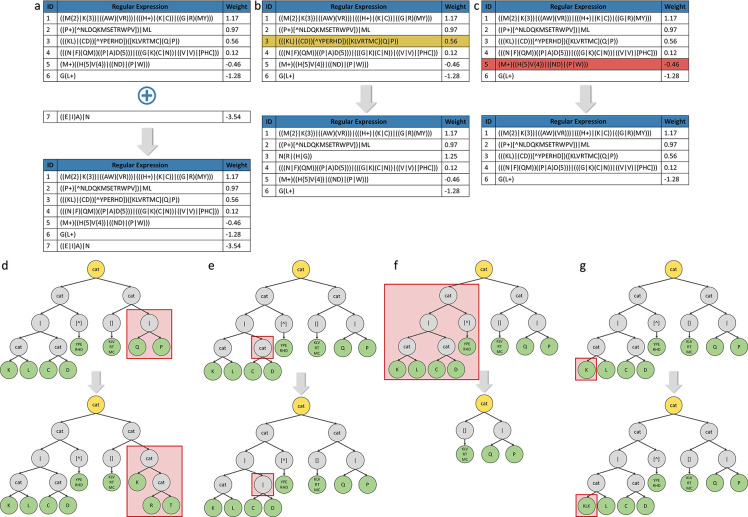
Results: This study presents the development and use of a variant of the initial POET algorithm, called POETRegex, which is based on genetic programming, where individuals are represented by a list of regular expressions. The program was trained on a small curated dataset and employed to predict new peptides that can improve the problem of sensitivity in detecting peptides through magnetic resonance imaging using chemical exchange saturation transfer (CEST). The resulting model achieves a performance gain of 20% over the initial POET variant and is able to predict a candidate peptide with a 58% performance increase compared to the gold-standard peptide.

Conclusions: By combining the power of genetic programming with the flexibility of regular expressions, new potential peptide targets were identified to improve the sensitivity of detection by CEST. This approach provides a promising research direction for the efficient identification of peptides with therapeutic or diagnostic potential.

Keywords: CEST MRI; Evolutionary algorithm; Genetic programming; Peptide discovery; contrast agent; regular expressions.


Conflict of interest statement

Competing interests The authors declare no competing interests.

Figures

Figure 1:
Figure 1:
Average pairwise sequence percent identity in the dataset.
Figure 2:
Figure 2:
a) Frequency of occurrence of each AA in both training (blue) and test (orange) sets. Molecules represent the four most prevalent AA in the training set, and hydroxyl or amine groups are highlighted. b) Comparison of the frequency of each AA in our dataset (yellow) and in the UniProtKB/Swiss-Prot database (green). The different values represent the percentage of occurrence. c) Potential CEST value associated with each AA by occurrence method. The green box represents positively charged AA and the red box represents negatively charged AA. d) Frequency of the 20 most observed motifs (size 2 to 6) in the training set with the associated CEST value.
Figure 3:
Figure 3:
Performance of the models with a number of REs ranging from 5 to 50. The orange boxplots represent the results obtained on the training set, while the green boxplots represent the results on the test set. Within each boxplot, the black horizontal line represents the median, while the green and orange solid lines represent the mean values.
Figure 4:
Figure 4:
a) Comparison of POETRegex (blue) and POETRdm (purple) models on the test set. b) Performance of the best POETRdm model on the training set (orange) and the test set (green). The translucent bands around the regression line represent the confidence interval for the regression estimate.
Figure 5:
Figure 5:
a) Performance of the best POETRegex model on the training set (orange) and on the test set (green). The strong correlation means that the algorithm has converged to a good solution. The translucent bands around the regression line represent the confidence interval for the regression estimate. b) Evolution of the fitness value during the evolutionary process. The green curve represents the fitness value of the best individual and the orange curve represents the fitness value of the entire population.
Figure 6:
Figure 6:
The 9 best POET models. Each dot represents a datapoint with a true CEST value associated with a predicted CEST value. The green line represents the regression line and the translucent bands around the regression line represent the confidence interval for the regression estimate.
Figure 7:
Figure 7:
a) Number of AAs present in the predicted peptides in the 3 types of DE experiments: 1000 (blue), 100 (orange) and 10 (green) cycles. b) Sequence logos highlighting the probability of each AA at a given position, for the 3 experiments. As the number of cycles increases, the predicted peptides are more similar with high rates of lysine and leucine. The polar AAs are in green, the neutral in purple, the positively charged in blue, the negatively charged in red and the hydrophobic in black.
Figure 8:
Figure 8:
MTRasym plot of nine peptides and the gold standard peptide (K12) measured by MRI.
Figure 9:
Figure 9:
Classical evolutionary cycle of a GP algorithm
Figure 10:
Figure 10:
a) Representation of an individual (a protein-function model) as a list of rules with 3 columns (ID, regular expression pattern and weight). An example (RE3) is represented as a built-in list structure in Python, where a parent node i has 2 children: (i*2)+1 and (i*2)+2. b) Representation of RE3 as a binary tree. The yellow node is the root, grey nodes are the internal nodes and green nodes are the leaves. The small dotted nodes with red numbers are unexpressed nodes represented by ‘None’.
Figure 11:
Figure 11:
Representation of the one-point crossover. A subpart of parent 1 is merged with a subpart of parent 2 to produce an offspring.
Figure 12:
Figure 12:
Representation of each type of mutation. a) Addition of a new rule in the list of rules. b) Replacement of a rule by a new rule. c) Deletion of an existing rule in the list of rules. d) Replacement of a branch of the tree. e) Inversion of a node. f) Deletion of a subtree. g) Add one or more AAs to a leaf.

References

    1. Wilcox G. Insulin and insulin resistance. Clinical Biochemist Reviews. 2005;26(2):19. - PMC - PubMed
    1. Hökfelt T, Broberger C, Xu ZQD, Sergeyev V, Ubink R, Diez M. Neuropeptides — an overview. Neuropharmacology. 2000;39(8):1337–56. - PubMed
    1. Lj Zhang, Gallo RL. Antimicrobial peptides. Current Biology. 2016;26(1):14–9. - PubMed
    1. Calvete JJ, Sanz L, Angulo Y, Lomonte B, Gutiérrez JM. Venoms, venomics, antivenomics. FEBS Letters. 2009;583(11):1736–43. - PubMed
    1. King GF. Venoms as a platform for human drugs: Translating toxins into therapeutics. Expert Opinion on Biological Therapy. 2011;11(11):1469–84. - PubMed

Publication types

LinkOut - more resources