[Preprint]. 2023 Sep 3:2023.09.02.556046.
doi: 10.1101/2023.09.02.556046.

HCN channels sense temperature and determine heart rate responses to heat

Affiliations

HCN channels sense temperature and determine heart rate responses to heat

Yuejin Wu et al. bioRxiv. .

Update in

Abstract

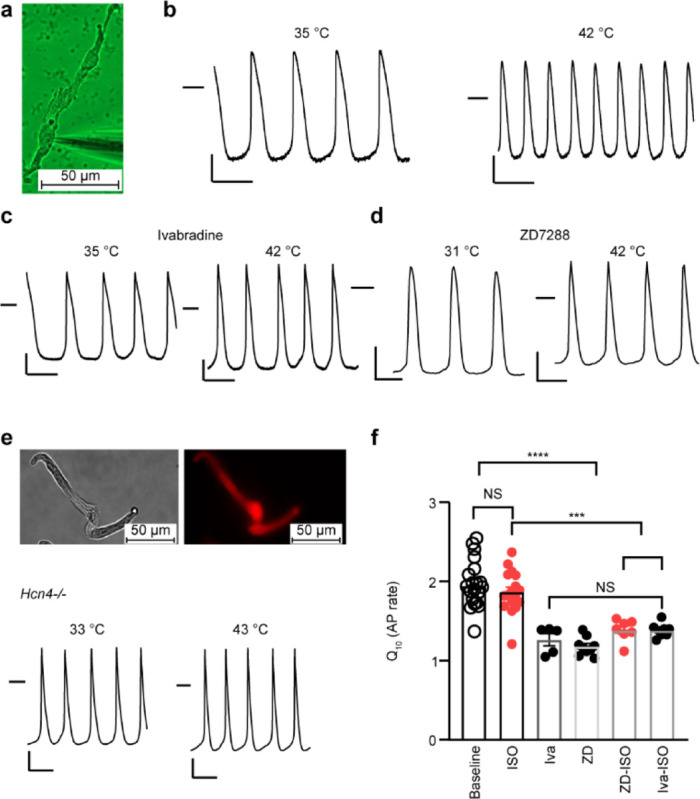
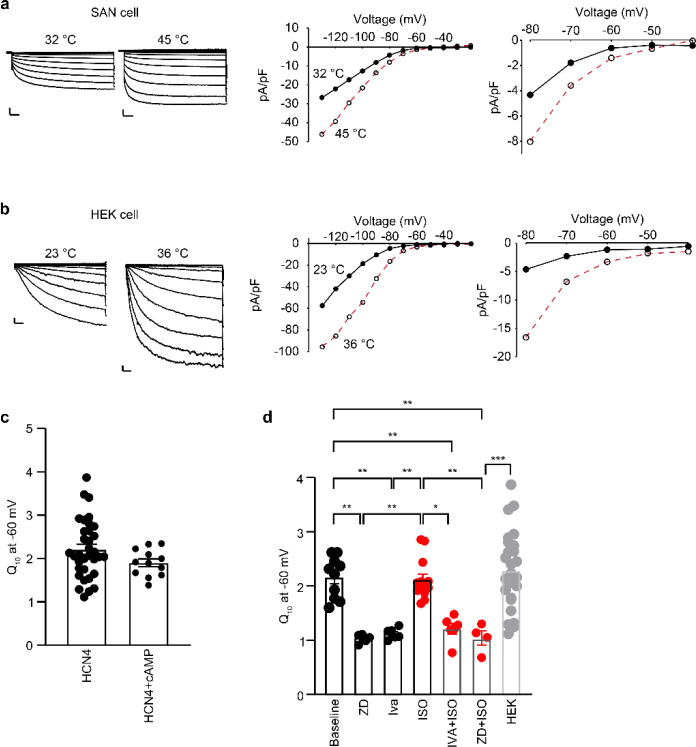
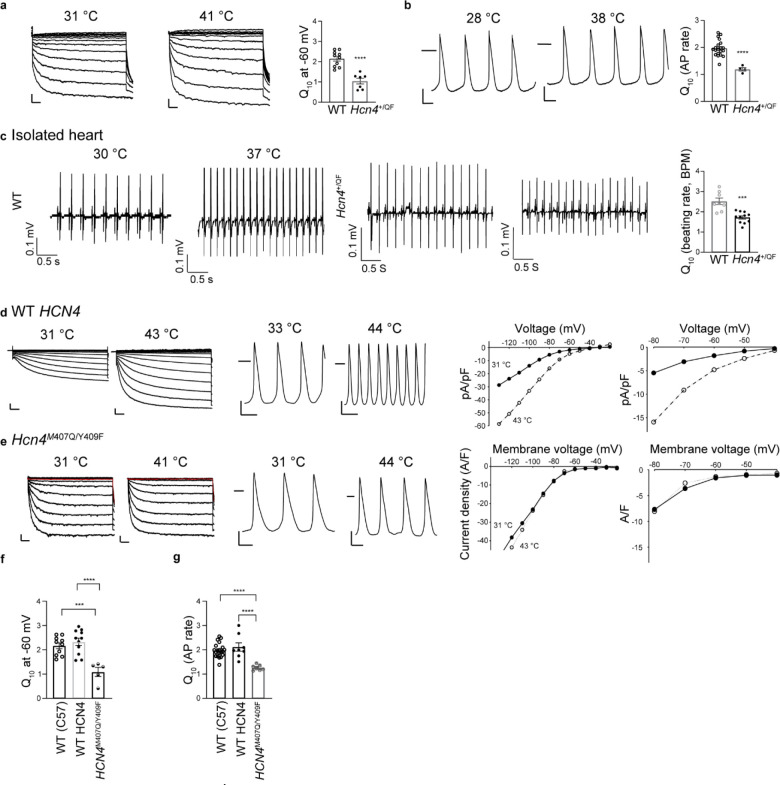
Heart rate increases with heat, [1-3] constituting a fundamental physiological relationship in vertebrates. Each normal heartbeat is initiated by an action potential generated in a sinoatrial nodal pacemaker cell. Pacemaker cells are enriched with hyperpolarization activated cyclic nucleotide-gated ion channels (HCN) that deliver cell membrane depolarizing inward current that triggers action potentials. HCN channel current increases due to cAMP binding, a mechanism coupling adrenergic tone to physiological 'fight or flight' heart rate acceleration. However, the mechanism(s) for heart rate response to thermal energy is unknown. We used thermodynamical and homology computational modeling, site-directed mutagenesis and mouse models to identify a concise motif on the S4-S5 linker of the cardiac pacemaker HCN4 channels (M407/Y409) that determines HCN4 current (If) and cardiac pacemaker cell responses to heat. This motif is required for heat sensing in cardiac pacemaker cells and in isolated hearts. In contrast, the cyclic nucleotide binding domain is not required for heat induced HCN4 current increases. However, a loss of function M407/Y409 motif mutation prevented normal heat and cAMP responses, suggesting that heat sensing machinery is essential for operating the cAMP allosteric pathway and is central to HCN4 modulation. The M407/Y409 motif is conserved across all HCN family members suggesting that HCN channels participate broadly in coupling heat to changes in cell membrane excitability.


Figures

Figure 1
Figure 1. HCN4 antagonists or Hcn4 knock out prevent action potential increases by heat in SAN cells
a, Isolated SAN cell in whole cell mode current clamp configuration, scale bar=50 μm. b, Representative SAN cell action potential (AP) tracings recorded under lower (left) and increased temperature (right). c, Representative SAN cell AP tracings recorded in the presence of HCN4 antagonist agents Ivabradine (4 μM) or d, ZD7288 (4 μM) under lower (left) and increased temperature (right). e, upper panel, Example of adenovirus infected SAN cells from floxed mice expressing mCherry and Cre (red, right) (scale bar=50 μm). lower panel, Representative AP tracings recorded under lower basal (left) and increased temperature (right) conditions from cultured single SAN cells isolated from Hcn4flox/flox mice cultured in the presence of adenovirus expressing Cre recombinase (see Methods). b-e, the horizontal lines mark 0 mV. Scale bars are 200 ms horizontal and 20 mV vertical. f, Summary data for Q10 from SAN cell AP rate responses to temperature increases. The presence of isoproterenol (ISO, 1 μM), Ivabradine (Iva, 4 μM) or ZD7288 (ZD, 4 μM) in the bath solution is indicated. One-way ANOVA, ***p<0.001, ****p<0.0001, n=5–20/group.
Figure 2
Figure 2. HCN4 current (If) has a Q10 of ~2.0 that is independent of cAMP signaling
Representative If (HCN4 current) tracings recorded under lower temperature and increased temperature (left panels) conditions from a, isolated SAN cells or b, in human embryonic kidney cells (HEK) transfected with HCN4 (see Methods). If current-voltage relationship (right panels). The right-most panels are expanded to highlight the physiological cell membrane potential range for SAN cells (−40 to − 80 mV). The horizontal scale bar is 500 ms and the vertical scale bar is 5 pA/pF in both (a) and (b). c, Summary data for Q10 from HCN4 channel currents at −60 mV from HEK cells expressing HCN4 in the presence or absence of cAMP (n=12–34/group). d, Summary Q10 data for If at −60 mV from isolated SAN cells treated with ISO (1μM), and/or Ivabradine (Iva, 4 μM) or ZD7288 (ZD, 4 μM) (n=4–13/group). one way ANOVA *p<0.05, **p<0.01, ***p<0.001.
Figure 3
Figure 3. Two amino acids on the 4–5 intracellular linker are essential for heat sensing in HCN4.
a, Schematic depiction of the subunit structure of HCN4. The pore, voltage-sensing, intracellular linker, disc and cyclic nucleotide binding domains are highlighted. b, Ribbon diagram showing superimposed HCN4 in apo/closed and holo/activated (cAMP bound) conformations: 6GYN (apo/closed, in purple) and 6GYO (holo/activated, in orange). c, Total solvent accessible surface area (SASA) exposed (right side) or buried (left side) in the residues of the S4–5 intracellular linker (top), disk domain (Disk, middle) and CNBD (cyclic nucleotide binding domain, lower) in response to channel opening, apolar (green), polar (blue) and amphipathic (orange) residues are shown as dots. TM indicates transmembrane domain. d, Representative whole cell mode HCN4 currents (left) recorded at lower (left, LT: 24–30-°C) and higher temperature (middle, HT: 34–43°C) from cultured HEK 293 cells expressing HCN4 heat insensitive mutants (407/409); summary Q10 data (right) for HCN4 current recorded from HEK 293 cells expressing wild type and 407/409 HCN4 (see Methods). Scale bars are 500 ms horizontal and 5 pA/pF vertical, ****p<0.0001, n=13–31/group. e, Sequence alignments between human HCN4 and a homologous channel from Tardigrades. The candidate temperature sensing residues are marked with rectangles and the blue box indicates the position of the intracellular 4–5 linker. The green dots show the residues targeted for mutation in this study. Amino acid sequence entries are from UniProt databank. f, Ribbon diagram comparing the closed state of human HCN4 (gold) and the homologous Tardigrade channel (green). g, Amino acid sequence alignments comparing the 4–5 intracellular linker for human and mouse HCN1–4. h, comparison of HCN4 current mean activation responses to temperature increases from HEK 293 cells expressing HCN4 (left) or HCN4407/409 (middle). WT (left) or HCN4407/409 (middle) HCN4 current activation voltage dependence during baseline (empty symbols) and after increased temperature (filled red symbols). Solid lines show Boltzmann fitting (see Methods). The right panel shows comparison of the voltage dependent of activation for WT and HCN4407/409 mutants at lower baseline temperature. Solid lines show Boltzmann fitting to the data (see Methods). Values are reported in Table S2. i, Summary data for midpoint voltage of activation (V1/2). ****p<0.0001, n=20–21/group. Values are reported in Table S2.
Figure 4
Figure 4. Mice with Hcn4407/409 mutant channels lack physiological responses to heat
a, Example of If current tracings recorded under lower temperature (left) and increased temperature (middle) conditions from isolated single SAN cells of Hcn4+/QF mice. Right bar graph is the summary of Q10 calculations based on current density at −60 mV from Hcn4+/QF mice and WT mice. b, Example of action potentials (AP) recorded under lower temperature (left) and increased temperature (middle) conditions from isolated single SAN cells of Hcn4+/QF mice. Right bar graph is the summary of Q10 calculations based on action potential rates from Hcn4+/QF mice and WT mice. c, Example of ECG tracings recorded under lower temperature (left) and increased temperature (middle) conditions from isolated hearts of littermate WT control (upper) or Hcn4+/QF (lower) mice. Right bar graph is the summary of Q10 calculations based on ECG rates (beats/min, BPM) from Hcn4+/QF mice and littermate control WT mice. d, Upper panels show examples of If currents recorded under baseline (left) and increased temperature (middle) conditions from cultured Hcn4flox/flox SAN cells infected with Ad-mCherry-Cre and Ad-HCN4-WT. Scale bar is 5 pA/pF (vertical) and 500 ms (horizontal). If current density and voltage relationship between 0 to −140 mV (right, middle) and between −40 to −80 mV (right). All If current examples are from the same cell. Full symbols = 31°C, open symbols = 43°C Lower panels show example AP recordings under basal (left) and increased temperature (right) conditions from cultured SAN cells isolated from Hcn4flox/flox mice infected with Ad-Cre-HCN4-WT. The horizontal line marks 0 mV. Scale bars are 200 ms (horizontal) and 20 mV (vertical). e, Upper panels show examples of If currents recorded under lower baseline (left) and increased temperature (middle) conditions from cultured Hcn4flox/flox SAN cells infected with Ad-mCherry-Cre and Ad-HCN4QF/QF. Scale bar is 5 pA/pF (vertical) and 500 ms (horizontal). If current density and voltage relationship between 0 and −140 mV (right, middle) and between −40 to −80 mV (right). If recordings and current voltage relationships are from the same cell. Full symbols = 31-°C, open symbols = 41°C Lower panels show example AP tracings recorded under lower basal (left) and increased temperature (right) conditions from cultured single SAN cells isolated from Hcn4flox/flox mice and infected with Ad-mCherry-Cre and HCN4QF/QF. The horizontal line marks 0 mV. Scale bars are 200 ms (horizontal) and 20 mV (vertical). f, Summary Q10 data for If currents (n=5–11/group) at −60 mV from cultured Hcn4flox/flox SAN cells expressing HCN4 WT, or HCN4QF/QF. ***p<0.001. g, Summary Q10 data for AP rates (n=7–8/group) from cultured Hcn4flox/flox SAN cells expressing HCN4 WT, or HCN4QF/QF. ***p<0.001.
Figure 5
Figure 5. Heat sensing is required for cAMP-dependent activation of HCN4
a, Representative If currents recorded from HCN4 transfected HEK 293 cells with or without intracellular dialysis of cAMP (1 mM) (left panel). Boltzmann distribution for HCN4 transfected HEK 293 cells (middle panel) and summary data for midpoint voltage of activation (right panel, V1/2). ****p<0.0001, n=14–20/group. b, Representative If currents recorded from mutant HCN4 (EA) transfected HEK 293 cells with or without intracellular dialysis of cAMP (1 mM) (left panel). Data are analyzed and displayed in b middle and right panels as in a panel (above), n=11–22/group. c, Representative If currents recorded under lower (left) and increased (middle) temperature conditions from cultured HEK 293 cells expressing HCN4 EA mutants. Summary Q10 data for If currents at −60 mV from HEK 293 cells (right panel). ****p<0.0001, n=9–31/group. d, Representative If currents in the presence or absence of intracellular dialysis with cAMP (1 mM) (left panels) in HCN4407/409 mutant expressing HEK 293 cells. Right two panels, HCN4407/409 current activation curves without (empty symbols) and with cAMP (1 mM) (filled symbols) dialysis. Summary data for midpoint voltage of activation (V1/2) with or without cAMP (right), n=13–27/group. Solid lines show Boltzmann fitting to the data (middle, see Methods). Values are reported in Table S2. a-d, Scale bars are 500 ms horizontal and 5 pA/pF vertical.

References

    1. Clark A.J., The effect of alterations of temperature upon the functions of the isolated heart. J Physiol, 1920. 54(4): p. 275–86. - PMC - PubMed
    1. Tanner J.M., The relationships between the frequency of the heart, oral temperature and rectal temperature in man at rest. J Physiol, 1951. 115(4): p. 391–409. - PMC - PubMed
    1. Kirschen G.W., et al., Relationship between body temperature and heart rate in adults and children: A local and national study. Am J Emerg Med, 2020. 38(5): p. 929–933. - PubMed
    1. Biel M., et al., Hyperpolarization-Activated Cation Channels: From Genes to Function. Physiological Reviews, 2009. 89(3): p. 847–885. - PubMed
    1. DiFrancesco D., Pacemaker mechanisms in cardiac tissue. Annual review of physiology, 1993. 55(1): p. 455–472. - PubMed

Publication types