

This is a preprint.
Characterizing Subcortical Structural Heterogeneity in Autism
- PMID: 37693556
- PMCID: PMC10491091
- DOI: 10.1101/2023.08.28.554882
Characterizing Subcortical Structural Heterogeneity in Autism
Abstract
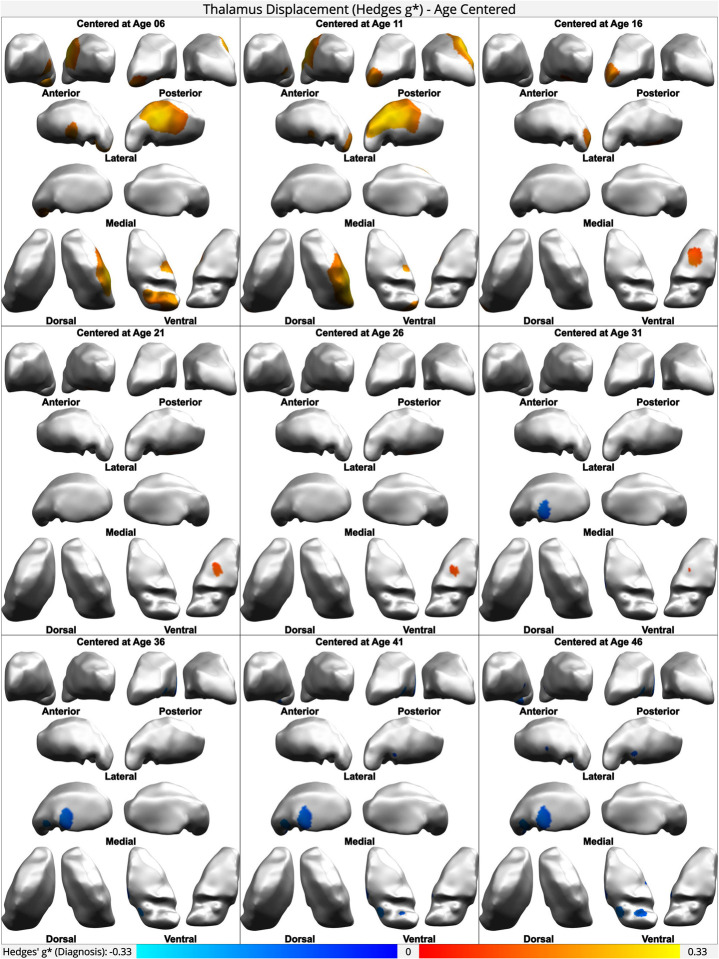
Autism presents with significant phenotypic and neuroanatomical heterogeneity, and neuroimaging studies of the thalamus, globus pallidus and striatum in autism have produced inconsistent and contradictory results. These structures are critical mediators of functions known to be atypical in autism, including sensory gating and motor function. We examined both volumetric and fine-grained localized shape differences in autism using a large (n=3145, 1045-1318 after strict quality control), cross-sectional dataset of T1-weighted structural MRI scans from 32 sites, including both males and females (assigned-at-birth). We investigated three potentially important sources of neuroanatomical heterogeneity: sex, age, and intelligence quotient (IQ), using a meta-analytic technique after strict quality control to minimize non-biological sources of variation. We observed no volumetric differences in the thalamus, globus pallidus, or striatum in autism. Rather, we identified a variety of localized shape differences in all three structures. Including age, but not sex or IQ, in the statistical model improved the fit for both the pallidum and striatum, but not for the thalamus. Age-centered shape analysis indicated a variety of age-dependent regional differences. Overall, our findings help confirm that the neurodevelopment of the striatum, globus pallidus and thalamus are atypical in autism, in a subtle location-dependent manner that is not reflected in overall structure volumes, and that is highly non-uniform across the lifespan.
Conflict of interest statement
Conflict of Interest EO is an employee of Genentech, Inc. DGMM has served on advisory Boards to Roche and Servier. He also receives a stipend for editorial work from Springer. M-CL serves as an editor of the journal Autism and has received editorial honorarium from SAGE Publications.
Figures


References
-
- Lai M-C, Lombardo MV, Baron-Cohen S (2014) Autism. Lancet 383:896–910 - PubMed
-
- Boucher J (2008) The Autistic Spectrum: Characteristics, Causes and Practical Issues. SAGE
-
- Johnson CP, Myers SM, American Academy of Pediatrics Council on Children With Disabilities (2007) Identification and evaluation of children with autism spectrum disorders. Pediatrics 120:1183–1215 - PubMed
Publication types
Grants and funding
LinkOut - more resources
Full Text Sources