[Preprint]. 2023 Aug 29:2023.08.28.555193.
doi: 10.1101/2023.08.28.555193.

A systems vaccinology resource to develop and test computational models of immunity

Affiliations

A systems vaccinology resource to develop and test computational models of immunity

Pramod Shinde et al. bioRxiv. .

Update in

  • A multi-omics systems vaccinology resource to develop and test computational models of immunity.
    Shinde P, Soldevila F, Reyna J, Aoki M, Rasmussen M, Willemsen L, Kojima M, Ha B, Greenbaum JA, Overton JA, Guzman-Orozco H, Nili S, Orfield S, Gygi JP, da Silva Antunes R, Sette A, Grant B, Olsen LR, Konstorum A, Guan L, Ay F, Kleinstein SH, Peters B. Shinde P, et al. Cell Rep Methods. 2024 Mar 25;4(3):100731. doi: 10.1016/j.crmeth.2024.100731. Epub 2024 Mar 14. Cell Rep Methods. 2024. PMID: 38490204 Free PMC article.

Abstract

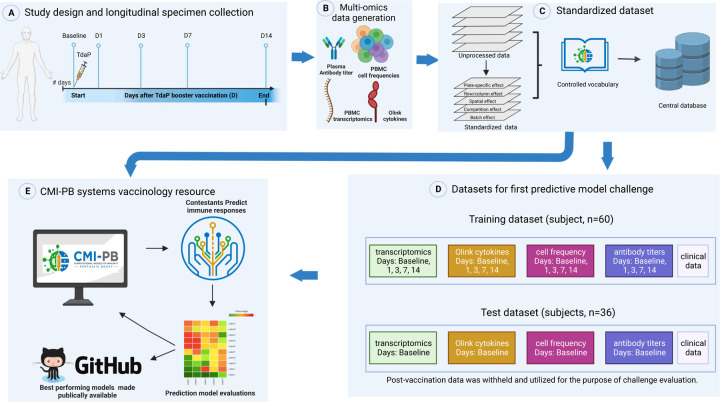
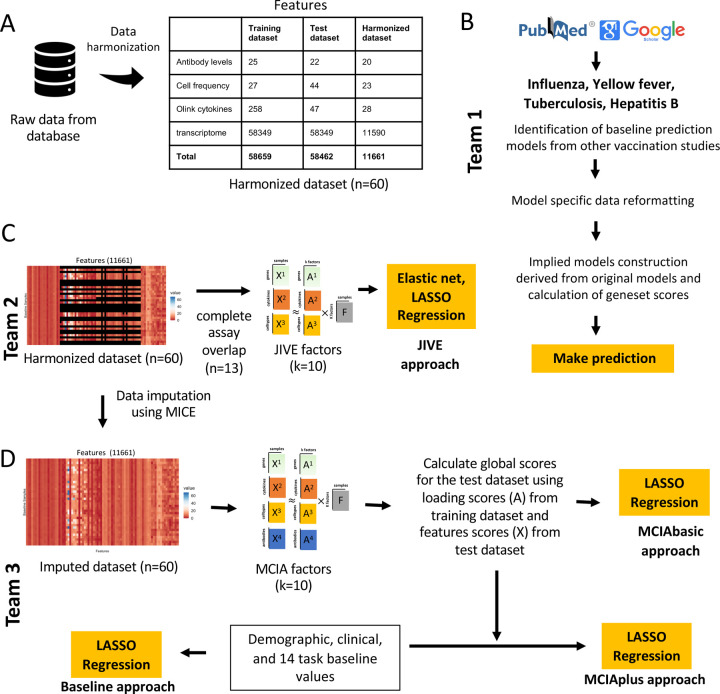
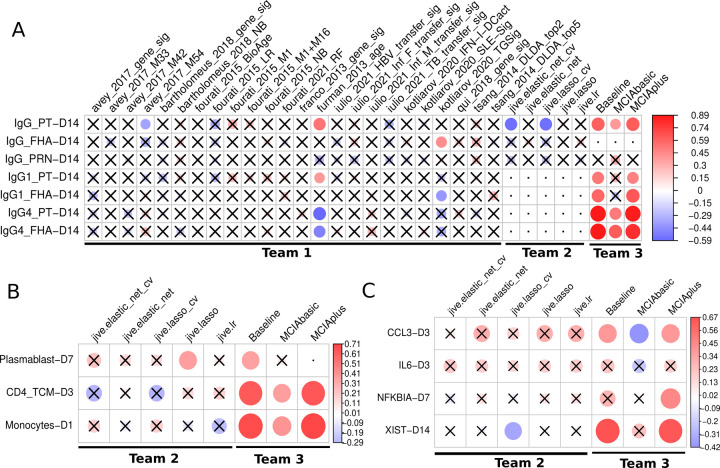
Computational models that predict an individual's response to a vaccine offer the potential for mechanistic insights and personalized vaccination strategies. These models are increasingly derived from systems vaccinology studies that generate immune profiles from human cohorts pre- and post-vaccination. Most of these studies involve relatively small cohorts and profile the response to a single vaccine. The ability to assess the performance of the resulting models would be improved by comparing their performance on independent datasets, as has been done with great success in other areas of biology such as protein structure predictions. To transfer this approach to system vaccinology studies, we established a prototype platform that focuses on the evaluation of Computational Models of Immunity to Pertussis Booster vaccinations (CMI-PB). A community resource, CMI-PB generates experimental data for the explicit purpose of model evaluation, which is performed through a series of annual data releases and associated contests. We here report on our experience with the first such 'dry run' for a contest where the goal was to predict individual immune responses based on pre-vaccination multi-omic profiles. Over 30 models adopted from the literature were tested, but only one was predictive, and was based on age alone. The performance of new models built using CMI-PB training data was much better, but varied significantly based on the choice of pre-vaccination features used and the model building strategy. This suggests that previously published models developed for other vaccines do not generalize well to Pertussis Booster vaccination. Overall, these results reinforced the need for comparative analysis across models and datasets that CMI-PB aims to achieve. We are seeking wider community engagement for our first public prediction contest, which will open in early 2024.


Figures

Figure 1:
Figure 1:. Outline for establishing the CMI-PB resource.
A) Recruitment of human subjects and longitudinal specimen collection. B) Generation of multi-omics data to obtain a comprehensive understanding of the collected specimens. C) Implementation of a data standardization approach to ensure consistency and comparability of the generated data. D) The resulting dataset is provided in training and test formats to enable contestants to develop their predictive models. E) The CMI-PB resource website serves as a platform for hosting an annual prediction challenge, offering data visualization tools for generated data, and providing access to teaching materials and datasets.
Figure 2.
Figure 2.. Data processing, computable matrices, and prediction model generation.
A) Generation of a harmonized dataset involved identifying shared features between the training and test datasets and filtering out low-information features. Literature-based models used raw data from the database and applied data formatting methods specified by existing models. In contrast, JIVE and MCIA utilized harmonized datasets for constructing their models. B) Flowchart illustrates the steps involved in identifying baseline prediction models from the literature, creating a derived model based on the original models’ specifications, and performing predictions as described by the authors. C) The JIVE approach involved creating a subset of the harmonized dataset by including only subjects with data for all four assays. The JIVE algorithm was then applied to calculate 10 factors, which were subsequently used for making predictions. JIVE employed five different regression models for prediction purposes. D) MCIA approach applied MICE imputation on the harmonized dataset and used this data for model construction. MCIA method was applied to the training dataset to construct 10 factors. Then, these 10 factors and feature scores from the test dataset were utilized to construct global scores for the test dataset. LASSO regression was applied to make predictions. MCIAplus model was constructed by including additional features (demographic, clinical features, and 14 task values) as factor scores, and it also utilized LASSO regression to make predictions. D) The MCIA approach utilized MICE imputation on the harmonized dataset for model construction. The MCIA method employed the imputed training dataset to construct 10 factors. These 10 factors, along with feature scores from the test dataset, were used to construct global scores for the test dataset. LASSO regression was applied to make predictions. Additionally, the MCIAplus model incorporated additional features such as demographic, clinical features, and 14 task values as factor scores. Finally, LASSO regression was employed for making predictions.
Figure 3:
Figure 3:. Evaluation of the prediction models submitted for the first CMI-PB challenge.
Model evaluation was performed using Spearman’s rank correlation coefficient between predicted ranks by a contestant and actual rank for each A) Antibody titers, B) Immune cell frequencies and C) transcriptomics tasks. The circles in the heatmaps are sized proportionally according to the absolute values of the Spearman rank correlation coefficient, while crosses represent any correlations that are not significant. The dot represents whether the model does not submit ranks for a particular task or if submitted tasks contain unique ranks. Any submissions featuring unique ranks are not included in the evaluation process. The baseline and MCIAplus models submitted by team 3 outperformed other models for most tasks.

References

    1. Aghaeepour N. et al. Critical assessment of automated flow cytometry data analysis techniques. Nat. Methods 10, 228–238 (2013). - PMC - PubMed
    1. Ioannidis J. P., Ntzani E. E., Trikalinos T. A. & Contopoulos-Ioannidis D. G. Replication validity of genetic association studies. Nat. Genet. 29, 306–309 (2001). - PubMed
    1. Eckstein M. K. et al. The interpretation of computational model parameters depends on the context. eLife 11, e75474 (2022). - PMC - PubMed
    1. Shibley G. S. & Hoelscher H. Studies on whooping cough : I. Type-specific (s) and dissociation (r) forms of hemophilus pertussis. J. Exp. Med. 60, 403–418 (1934). - PMC - PubMed
    1. Edwards K. M. Challenges to Pertussis Control. Pediatrics 144, (2019). - PubMed

Publication types