[Preprint]. 2023 Aug 31:2023.08.29.555444.
doi: 10.1101/2023.08.29.555444.

Loss of finger control complexity and intrusion of flexor biases are dissociable in finger individuation impairment after stroke

Affiliations

Loss of finger control complexity and intrusion of flexor biases are dissociable in finger individuation impairment after stroke

Jing Xu et al. bioRxiv. .

Abstract

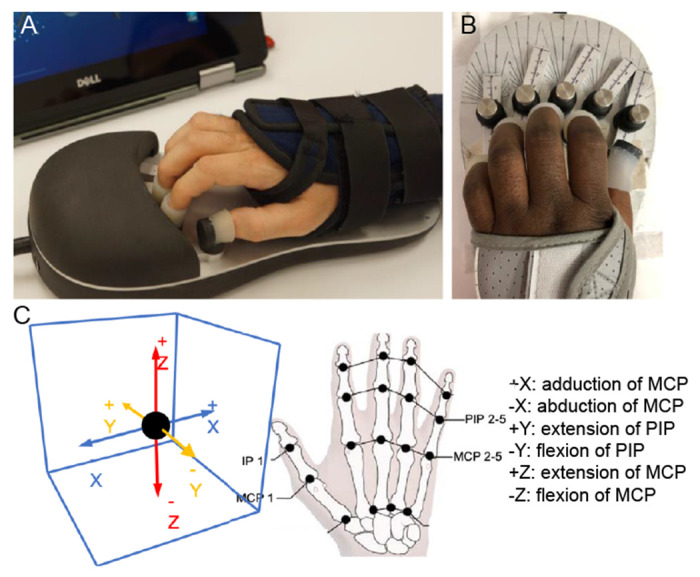
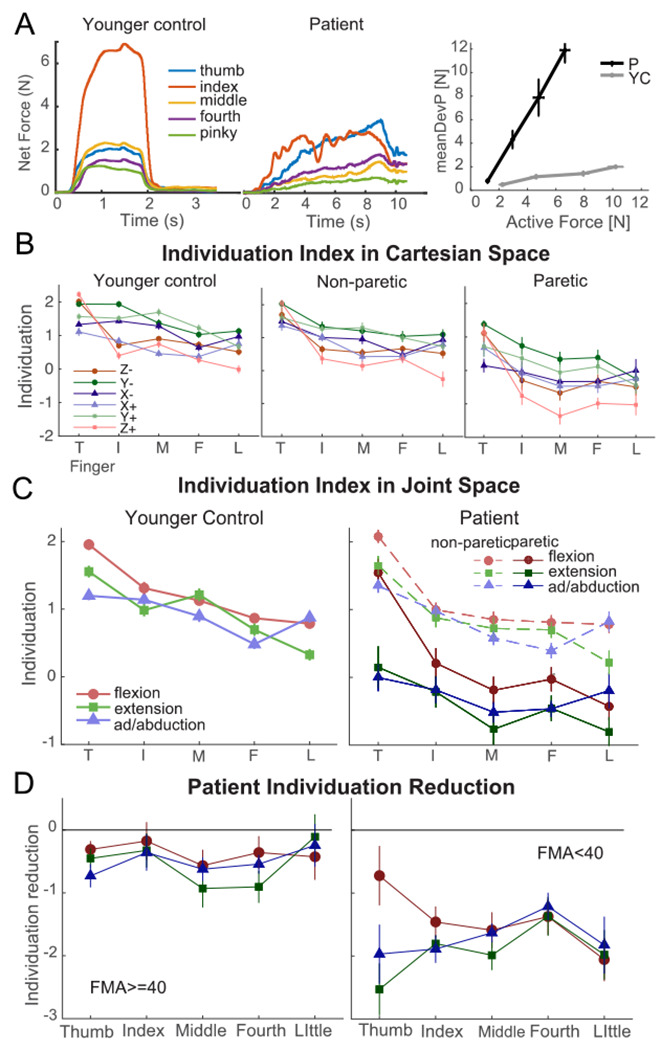
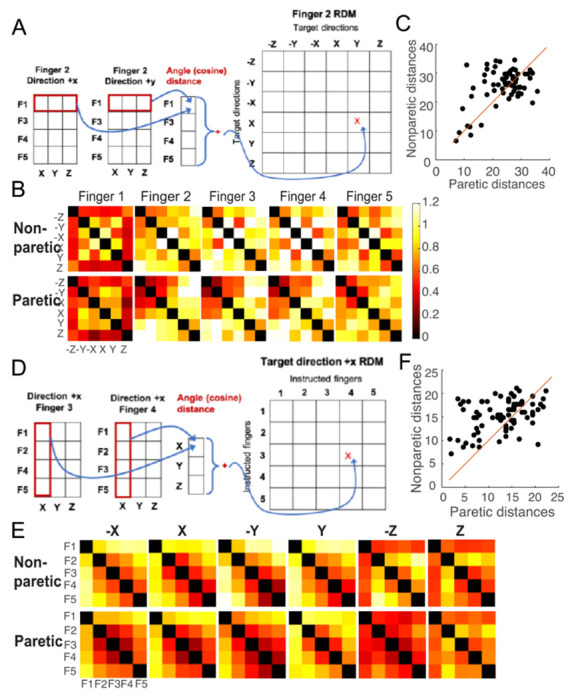
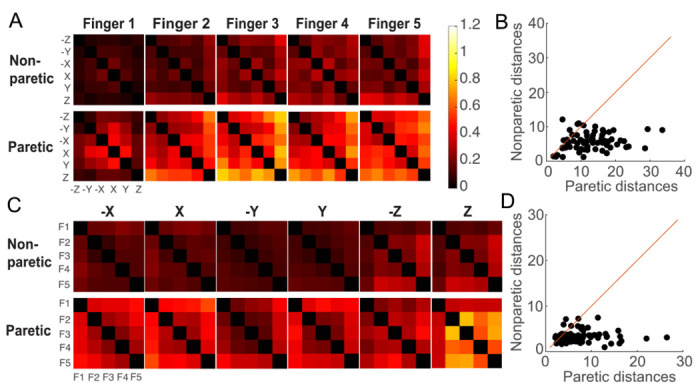
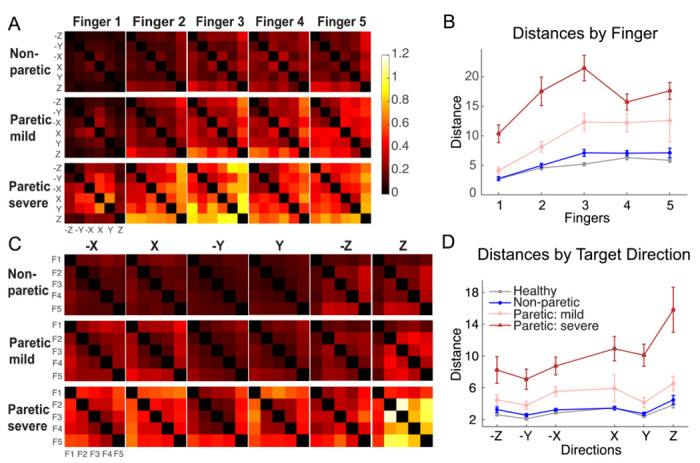
The ability to control each finger independently is an essential component of human hand dexterity. A common observation of hand function impairment after stroke is the loss of this finger individuation ability, often referred to as enslavement, i.e., the unwanted coactivation of non-intended fingers in individuated finger movements. In the previous literature, this impairment has been attributed to several factors, such as the loss of corticospinal drive, an intrusion of flexor synergy due to upregulations of the subcortical pathways, and/or biomechanical constraints. These factors may or may not be mutually exclusive and are often difficult to tease apart. It has also been suggested, based on a prevailing impression, that the intrusion of flexor synergy appears to be an exaggerated pattern of the involuntary coactivations of task-irrelevant fingers seen in a healthy hand, often referred to as a flexor bias. Most previous studies, however, were based on assessments of enslavement in a single dimension (i.e., finger flexion/extension) that coincide with the flexor bias, making it difficult to tease apart the other aforementioned factors. Here, we set out to closely examine the nature of individuated finger control and finger coactivation patterns in all dimensions. Using a novel measurement device and a 3D finger-individuation paradigm, we aim to tease apart the contributions of lower biomechanical, subcortical constraints, and top-down cortical control to these patterns in both healthy and stroke hands. For the first time, we assessed all five fingers' full capacity for individuation. Our results show that these patterns in the healthy and paretic hands present distinctly different shapes and magnitudes that are not influenced by biomechanical constraints. Those in the healthy hand presented larger angular distances that were dependent on top-down task goals, whereas those in the paretic hand presented larger Euclidean distances that arise from two dissociable factors: a loss of complexity in finger control and the dominance of an intrusion of flexor bias. These results suggest that finger individuation impairment after stroke is due to two dissociable factors: the loss of finger control complexity present in the healthy hand reflecting a top-down neural control strategy and an intrusion of flexor bias likely due to an upregulation of subcortical pathways. Our device and paradigm are demonstrated to be a promising tool to assess all aspects of the dexterous capacity of the hand.


Figures

Figure 1.
Figure 1.. Hand Articulating Neuro-Training Device (HAND).
A-B. Participants’ hand fitting in the device, posture recorded with mounting distance and angle. C. Illustration of finger joint motion to Cartesian coordinates in the virtual 3D space.
Figure 2.
Figure 2.. The 3D finger individuation paradigm.
A-B. Natural trajectory task. A. Screenshot of the task for one finger: participant control a white dot by exerting isometric forces towards one of the 6 directions in the 3D virtual space and move the dot between the home position (gray sphere) and a virtual wall. B. Example force traces recorded from index finger during natural trajectory task in a healthy participant and a stroke patient’s paretic hand; C-D. Finger individuation task. C. Screenshot of the task for one finger: participant control a white dot in the virtual space and try to hit a target by following the specified path (thick black line) estimated from that finger’s natural trajectory (shown in B) while attempting to minimize forces from uninstructed fingers (red bar). D. Example force traces recorded from all five fingers in a healthy participant’s left hand and a stroke survivor’s paretic hand during the individuation task when the participants attempted to move their left index finger towards a target (red dot).
Figure 3.
Figure 3.. Individuation Index derivation and results.
A. Illustration of derivation of Individuation Index: overall net force trajectories (first two panels) and the function of mean deviation net force from the uninstructed fingers as a function of the force in the instructed finger towards the instructed direction (3rd panel). Individuation index is -log(slope) of the regression line of the function; B. Individuation Indices of healthy and stroke patients in cartesian spaces; C. Individuation Indices summarized in joint space for healthy controls and patients; D. Reduction of Individuation Indices (paretic subtracted from non-paretic) for patients with mild (FMA>=40) and severe (FMA<40) impairment.
Figure 4.
Figure 4.. Pattern similarity analysis of finger coactivation/enslavement patterns using cosine distances. A larger distance indicates distinct shapes of finger coactivation patterns.
A. An illustration of representation similarity matrix (RDM) computed across coactivation/enslavement patterns for one instructed finger (finger 2) exerting force in two different directions: +X vs. +Y. B. Mean RDMs for each instructed finger direction averaged across all non-paretic and paretic hands. C. Direct comparison of mean distance values for each participant at each instructed finger. D. An illustration of RDM computed across coactivation/enslavement patterns for two different fingers (finger 3 & 4) exerting force in the same target direction (+X). E. Mean RDMs for each target direction averaged across all non-paretic and paretic hands. F. Direct comparison of mean distance values for each participant at each instructed target direction.
Figure 5.
Figure 5.. Pattern similarity analysis of the finger coactivation/enslavement patterns using Cosine distances with mildly (FMA>=40) and severely (FMA<40) impaired patients separated.
A. Mean RDMs for each instructed finger direction averaged across all non-paretic and paretic hands. B. Sum of mean distance values across all participants for each instructed finger. C. Mean RDMs for each target direction averaged across all non-paretic and paretic hands. D. Sum of mean distance values across all participants for each instructed target direction.
Figure 6.
Figure 6.. Pattern similarity analysis of the finger coactivation/enslavement patterns using Euclidean distances.
A. Mean RDMs for each instructed finger direction averaged across all non-paretic and paretic hands. B. Direct comparison of mean distance values for each participant at each instructed finger. C. Mean RDMs for each target direction averaged across all non-paretic and paretic hands. D. Direct comparison of mean distance values for each participant at each instructed target direction.
Figure 7.
Figure 7.. Pattern similarity analysis of finger coactivation/enslavement patterns using Euclidean distances, with mildly (FMA>=40) and severely (FMA<40) impaired patients separated.
A. Mean RDMs for each instructed finger direction averaged across all non-paretic and paretic hands. B. Sum of mean distance values across all participants for each instructed finger. C. Mean RDMs for each target direction averaged across all non-paretic and paretic hands. D. Sum of mean distance values across all participants for each instructed target direction.
Figure 8.
Figure 8.. Bias measures.
A. Mean biases for each subject for all fingers plotted in the same 3D space. Paretic data are separated by severity: (FMA>=40 vs. (FMA<40)). B. Bias summary in the flexion (−Y and −Z), extension (+Y and +Z), and abduction/adduction (+X/−X) directions for the three groups.
Figure 9.
Figure 9.
Scatter plots of Bias Difference between paretic and non-paretic (intrusion of flexor bias) and distance measures. A-B. Cosine Distances by Finger and Target Direction, respectively, and C-D. Euclidean Distances by Finger and Target Direction, respectively. r-values are Pearson correlation coefficients.
Figure 10.
Figure 10.. PCA analysis results.
Variance explained by the number of PCs in finger coactivation/enslavement patterns for the healthy, non-paretic, and paretic hands. Note that there are a maximum of 15 PCs due to the nature of the individuation task.

References

    1. Abolins Valters, and Latash Mark L.. 2021. “The Nature of Finger Enslaving: New Results and Their Implications.” Motor Control 25 (4): 680–703. 10.1123/mc.2021-0044. - DOI - PubMed
    1. Bates Douglas, Machler Märtin, Bolker Ben, and Walker Steve. 2015. “Fitting Linear Mixed-Effects Models Using Lme4.” Journal of Statistical Software 67 (1): 1–48. 10.18637/jss.v067.i01. - DOI
    1. Beck Sandra, and Hallett Mark. 2011. “Surround Inhibition in the Motor System.” Experimental Brain Research 210 (2): 165–72. 10.1007/s00221-011-2610-6. - DOI - PMC - PubMed
    1. Bell-Krotoski Judith, and Tomancik Elizabeth. 1987. “The Repeatability of Testing with Semmes-Weinstein Monofilaments.” The Journal of Hand Surgery 12 (1): 155–61. 10.1016/S0363-5023(87)80189-2. - DOI - PubMed
    1. Carducci Jacob, Olds Kevin, Krakauer John W., Xu Jing, and Brown Jeremy D.. 2022. “Novel Planar Strain Sensor Design for Capturing 3-Dimensional Fingertip Forces from Patients Affected by Hand Paralysis.” Sensors 22 (19): 7441. 10.3390/s22197441. - DOI - PMC - PubMed

Publication types