

This is a preprint.
Environmental circadian disruption re-programs liver circadian gene expression
- PMID: 37693605
- PMCID: PMC10491124
- DOI: 10.1101/2023.08.28.555175
Environmental circadian disruption re-programs liver circadian gene expression
Update in
-
Environmental circadian disruption re-writes liver circadian proteomes.Nat Commun. 2024 Jul 1;15(1):5537. doi: 10.1038/s41467-024-49852-3. Nat Commun. 2024. PMID: 38956413 Free PMC article.
Abstract
Circadian gene expression is fundamental to the establishment and functions of the circadian clock, a cell-autonomous and evolutionary-conserved timing system. Yet, how it is affected by environmental-circadian disruption (ECD) such as shiftwork and jetlag, which impact millions of people worldwide, are ill-defined. Here, we provided the first comprehensive description of liver circadian gene expression under normal and after ECD conditions. We found that post-transcription and post-translation processes are dominant contributors to whole-cell or nuclear circadian proteome, respectively. Furthermore, rhythmicity of 64% transcriptome, 98% whole-cell proteome and 95% nuclear proteome is re-written by ECD. The re-writing, which is associated with changes of circadian cis-regulatory elements, RNA-processing and protein trafficking, diminishes circadian regulation of fat and carbohydrate metabolism and persists after one week of ECD-recovery.
Conflict of interest statement
Competing interests: Authors declare that they have no competing interests.
Figures

 – corresponding groups between (A) and (A’).


 – corresponding groups between (A) and (A’)
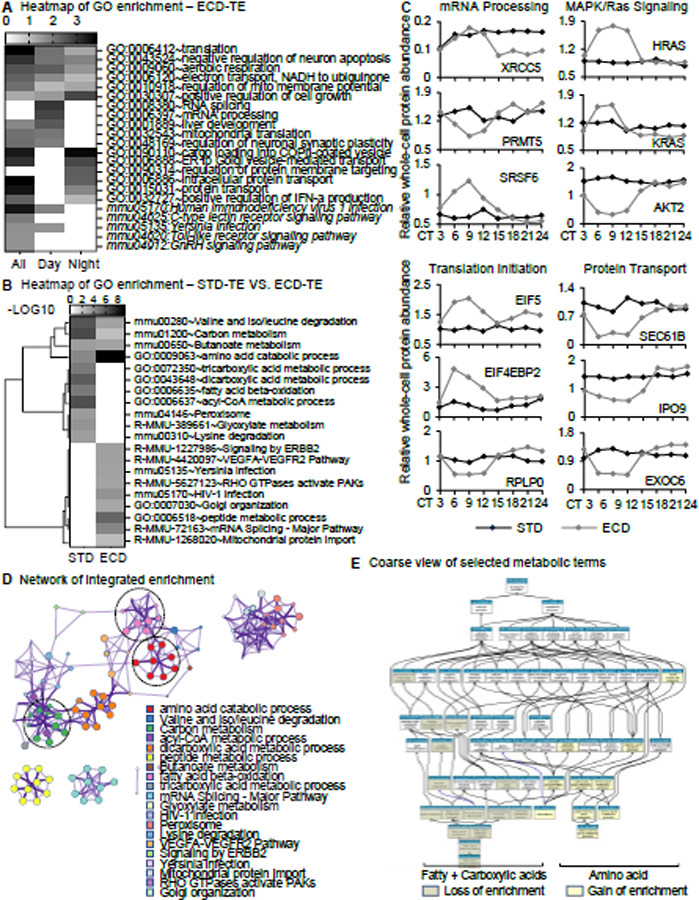
References
Publication types
Grants and funding
LinkOut - more resources
Full Text Sources