[Preprint]. 2024 Jan 29:2023.09.01.23294931.
doi: 10.1101/2023.09.01.23294931.

Distinct genomic signatures and modifiable risk factors underly the comorbidity between major depressive disorder and cardiovascular disease

Affiliations

Distinct genomic signatures and modifiable risk factors underly the comorbidity between major depressive disorder and cardiovascular disease

Jacob Bergstedt et al. medRxiv. .

Update in

Abstract

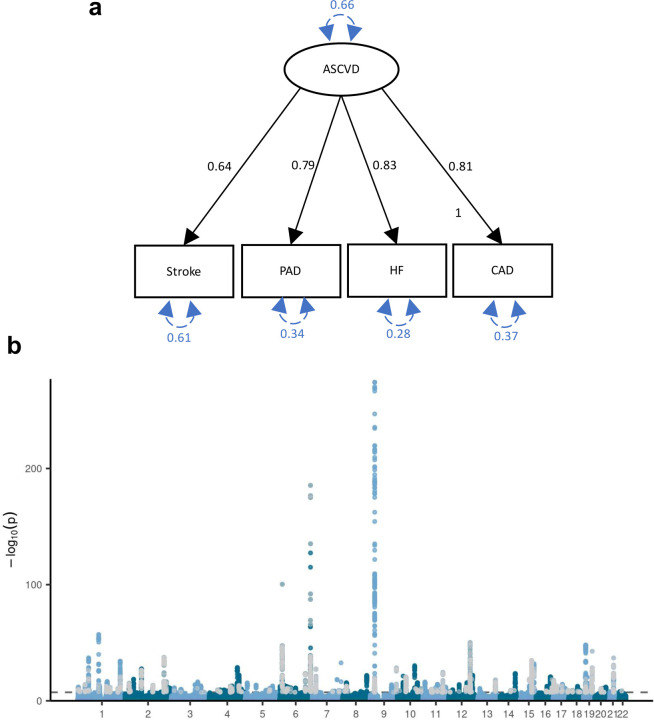
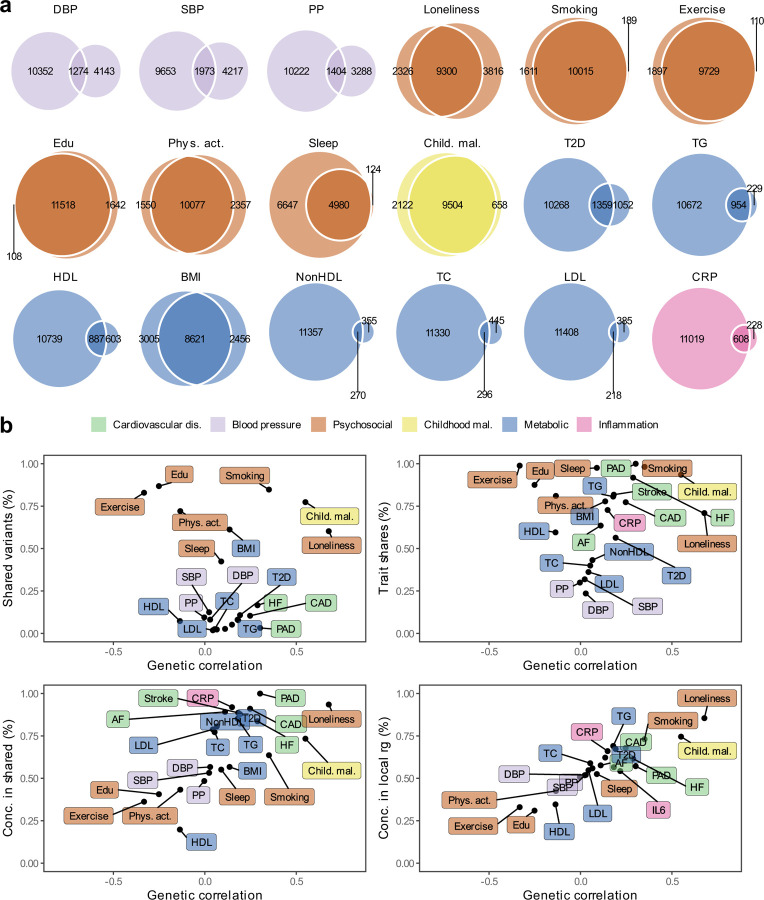
Major depressive disorder (MDD) and cardiovascular disease (CVD) are often comorbid, resulting in excess morbidity and mortality. Using genomic data, this study elucidates biological mechanisms, key risk factors, and causal pathways underlying their comorbidity. We show that CVDs share a large proportion of their genetic risk factors with MDD. Multivariate genome-wide association analysis of the shared genetic liability between MDD and atherosclerotic CVD (ASCVD) revealed seven novel loci and distinct patterns of tissue and brain cell-type enrichments, suggesting a role for the thalamus. Part of the genetic overlap was explained by shared inflammatory, metabolic, and psychosocial/lifestyle risk factors. Finally, we found support for causal effects of genetic liability to MDD on CVD risk, but not from most CVDs to MDD, and demonstrated that the causal effects were partly explained by metabolic and psychosocial/lifestyle factors. The distinct signature of MDD-ASCVD comorbidity aligns with the idea of an immunometabolic sub-type of MDD more strongly associated with CVD than overall MDD. In summary, we identify plausible biological mechanisms underlying MDD-CVD comorbidity, as well as key modifiable risk factors for prevention of CVD in individuals with MDD.


Conflict of interest statement

Competing interests CML sits on the SAB of Myriad Neuroscience and has received speaker/consultancy fees from SYNLAB and UCB. OAA is a consultant to Cortechs.ai, and has received speaker’s honoraria from Lundbeck, Janssen and Sunovion. PFS has receieved consulting fees from and is a shareholder of Neumora therapeutics. Other authors declare no competing interests.

Figures

Extended Data Fig. 1 |
Extended Data Fig. 1 |. Genetic correlation of MDD and MDD symptoms with CVDs.
(a) Results are based on LD Score Regression analysis. Points and error bars represent genetic correlation and 95% CIs. Sample sizes for GWAS summary statistics are reported in Supplementary Table 1. (b) Local genetic correlation between MDD and CVDs in 16 loci in the HLA region. Only loci with marginally significant local heritability for both traits are shown. Points above the vertical line are significant based on multiple testing adjustment for considered loci performed for each CVD trait separately. MDD=Major Depressive Disorder; AF=Atrial Fibrillation; CAD=Coronary Artery Disease; HF=Heart Failure; PAD=Peripheral Artery Disease
Extended Data Fig. 2 |
Extended Data Fig. 2 |. Genetic correlation and polygenicity for MDD, CVD, and risk factors.
(a) Heatmap of the genetic correlations between MDD, the CVDs, and the risk factors, with the color indicating the effect direction (negative: red, positive: blue) and the size and shade of the square illustrating the size of the correlation. Results are based on LD Score Regression analysis. (b) Estimates of number of non-zero variants for from SBayesS for each trait (y-axis) and estimates of non-zero variants required to explain 90% of trait heritability for each trait from MiXeR (x-axis) for MDD, the CVDs, and the risk factors. Note that for PAD polygenicity estimates did not converge for SBayeS, possibly because of few number of cases. MDD=Major Depressive Disorder; AF=Atrial Fibrillation; CAD=Coronary Artery Disease; HF=Heart Failure; PAD=Peripheral Artery Disease; DBP=Diastolic Blood Pressure; SBP=Systolic Blood Pressure; PP=Pulse Pressure; Edu=Educational attainment; Phys. Act.=Physical activity; Child. Mal.=Childhood Maltreatment; T2D=Type II Diabetes; TG=Triglycerides; HDL=High-Density Lipoprotein; NonHDL=Non-High-Density Lipoprotein; TC=Total Cholesterol; LDL=Low-Density Lipoprotein; IL6=Interleukin-6; CRP=C-Reactive Protein
Extended Data Fig. 3 |
Extended Data Fig. 3 |. Common latent factor underlying atherosclerotic CVD.
(a) Latent atherosclerotic CVD (ASCVD) model, defined by stroke, peripheral artery disease (PAD), heart failure (HF), and coronary artery disease (CAD). All ‘observed’ traits are based on GWAS summary statistics. Results are from confirmatory factor analysis in Genomic SEM, and standardized factor loadings are given for each path. Circular dashed arrows give the trait variance. (b) Manhattan plot of the GWAS on ASCVD, with each dot representing a SNP with its position on the x-axis and its P-value on the y-axis. Genome-wide significant SNPs with a significant heterogeneity QSNP (with a strong effect on one or some of the indicators that was not well explained through the common latent factor) are displayed in grey. The dashed line indicates the genome-wide significance threshold (P<5e-8).
Extended Data Fig. 4 |
Extended Data Fig. 4 |. The genomic signature of MDD-ASCVD.
(a) Enrichment for the MDD-ASCVD GWAS SNPs in genome-wide significant SNPs for traits in the GWAS catalog computed using FUMA. The traits are as reported in the original study. Note that sleep duration here is a dichotomization of self-reported sleep. Full name in GWAS catalog of the trait “Coronary artery disease*” is “Coronary artery disease (myocardial infarction, percutaneous transluminal coronary angioplasty, coronary artery bypass grafting, angina or chromic ischemic heart disease)”. The dashed black line indicates the significance threshold after Benjamini-Hochberg adjustment. Adjustment for multiple testing was conducted over all traits in the GWAS catalog (>3500 traits). (b) The five SNPs that were significantly associated with MDD-ASCVD, but not with any of the constituent traits, with their P-value in the GWAS of the constituent traits. The dashed line indicates the genome-wide significance threshold (P<5e-8). (c) Genetic correlation of PHQ-9 MDD symptoms with MDD, and MDD-ASCVD, with bars representing 95% confidence intervals. Results are based on LD Score Regression analysis. (d) Genetic correlation of MDD, MDD-ASCVD, and ASCVD with five psychiatric disorders, with bars representing 95% confidence intervals. Results are based on LD Score Regression analysis. ADHD = Attention Deficit and Hyperactivity Disorder; PTSD = Posttraumatic Stress Disorder.
Extended Data Fig. 5 |
Extended Data Fig. 5 |. Genetic correlation between CVD and risk factors
Results are based on LD Score Regression analysis. Points and error bars represent correlations and 95% CIs. Sample sizes for GWAS summary statistics are reported in Supplementary Table 1. Open dots indicate a non-significant genetic correlation. AF=Atrial Fibrillation; CAD=Coronary Artery Disease; HF=Heart Failure; PAD=Peripheral Artery Disease; DBP=Diastolic Blood Pressure; SBP=Systolic Blood Pressure; PP=Pulse Pressure; Edu=Educational attainment; Phys. Act.=Physical activity; Child. Mal.=Childhood Maltreatment; T2D=Type II Diabetes; TG=Triglycerides; HDL=High-Density Lipoprotein; NonHDL=Non-High-Density Lipoprotein; TC=Total Cholesterol; LDL=Low-Density Lipoprotein; IL6=Interleukin-6; CRP=C-Reactive Protein
Extended Data Fig. 6 |
Extended Data Fig. 6 |. Genetic correlation between MDD traits and risk factors
Results are based on LD Score Regression analysis. Points and error bars represent correlations and 95% CIs. Sample sizes for GWAS summary statistics are reported in Supplementary Table 1. Open dots indicate a non-significant genetic correlation. MDD=Major Depressive Disorder; DBP=Diastolic Blood Pressure; SBP=Systolic Blood Pressure; PP=Pulse Pressure; Edu=Educational attainment; Phys. Act.=Physical activity; Child. Mal.=Childhood Maltreatment; T2D=Type II Diabetes; TG=Triglycerides; HDL=High-Density Lipoprotein; NonHDL=Non-High-Density Lipoprotein; TC=Total Cholesterol; LDL=Low-Density Lipoprotein; IL6=Interleukin-6; CRP=C-Reactive Protein
Extended Data Fig 7 |
Extended Data Fig 7 |. Local genetic correlations between MDD and risk factors.
Volcano plots based on LAVA results. Local genetic correlation between MDD and each of the risk factors (x-axis) and the corresponding -log10 transformed P-value (y-axis). Correlations were estimated in the loci that showed marginally significant local heritability in 2,495 considered genomic regions. Loci exceeding the horizontal line are significant at 𝑃FDR<.05. Multiple testing was adjusted for individually for each trait over considered loci. Psychosocial=Psychosocial/Lifestyle; DBP=Diastolic Blood Pressure; SBP=Systolic Blood Pressure; PP=Pulse Pressure; Edu=Educational attainment; Phys. Act.=Physical activity; Child. Mal.=Childhood Maltreatment; T2D=Type II Diabetes; TG=Triglycerides; HDL=High-Density Lipoprotein; NonHDL=Non-High-Density Lipoprotein; TC=Total Cholesterol; LDL=Low-Density Lipoprotein; IL6=Interleukin-6; CRP=C-Reactive Protein
Extended Data Fig. 8 |
Extended Data Fig. 8 |. Genetic correlation between MDD and CVD when adjusting for individual risk factors
Results from Genomic SEM. Bars represent 95% confidence intervals. Reference estimates of the association without any adjustment are printed in black. AF=Atrial Fibrillation; CAD=Coronary Artery Disease; HF=Heart Failure; PAD=Peripheral Artery Disease; DBP=Diastolic Blood Pressure; SBP=Systolic Blood Pressure; PP=Pulse Pressure; Edu=Educational attainment; Phys. Act.=Physical activity; Child. Mal.=Childhood Maltreatment; T2D=Type II Diabetes; TG=Triglycerides; HDL=High-Density Lipoprotein; NonHDL=Non-High-Density Lipoprotein; TC=Total Cholesterol; LDL=Low-Density Lipoprotein; IL6=Interleukin-6; CRP=C-Reactive Protein
Extended Data Fig. 9 |
Extended Data Fig. 9 |. Assessment of evidence for causal associations between MDD, CVD, and risk factors.
Results from univariable and multivariable Mendelian randomization (MR) analysis (Inverse variance weighted estimates are shown) (a) Effect of liability to MDD (exposure) on CVD and risk factors (outcomes) after excluding the UKB sample from MDD (which was responsible for most of the sample overlap in the exposure and outcome GWAS summary statistics). (b) Estimated fffect of CVD and risk factors on MDD after excluding the UKB. (c) Results from LHC-MR, that corrects for heritable confounders and sample overlap, with the standard inverse variance weighted MR estimate given as reference, for the effect of MDD on CVD and risk factors. (d) Effect of liability to MDD-ASCVD on outcomes and risk factors. A-c Statistically significant pleiotropic estimates are indicated with a red asterisk. The term beta refers to the log odds ratio. Psychosocial=Psychosocial/Lifestyle; AF=Atrial Fibrillation; CAD=Coronary Artery Disease; HF=Heart Failure; PAD=Peripheral Artery Disease; DBP=Diastolic Blood Pressure; SBP=Systolic Blood Pressure; PP=Pulse Pressure; Edu=Educational attainment; Phys. Act.=Physical activity; Child. Mal.=Childhood Maltreatment; T2D=Type II Diabetes; TG=Triglycerides; HDL=High-Density Lipoprotein; NonHDL=Non-High-Density Lipoprotein; TC=Total Cholesterol; LDL=Low-Density Lipoprotein; IL6=Interleukin-6; CRP=C-Reactive Protein
Extended Data Fig. 10 |
Extended Data Fig. 10 |. Effects of liability to MDD on CVDs when adjusting for individual risk factors
Results from multivariable Mendelian randomization. Bars represent 95% confidence intervals. Reference estimates of the association without any adjustment are printed in black. AF=Atrial Fibrillation; CAD=Coronary Artery Disease; HF=Heart Failure; PAD=Peripheral Artery Disease; DBP=Diastolic Blood Pressure; SBP=Systolic Blood Pressure; PP=Pulse Pressure; Edu=Educational attainment; Phys. Act.=Physical activity; Child. Mal.=Childhood Maltreatment; T2D=Type II Diabetes; TG=Triglycerides; HDL=High-Density Lipoprotein; NonHDL=Non-High-Density Lipoprotein; TC=Total Cholesterol; LDL=Low-Density Lipoprotein; IL6=Interleukin-6; CRP=C-Reactive Protein
Figure 1.
Figure 1.
Graphical abstract illustrating the study approach. The comorbidity between MDD and CVD is investigated using genetic and causal inference methods, including assessing overlap with and mediation through shared risk factors (metabolic, psychosocial/lifestyle, inflammatory, and blood pressure; Supplementary Table 1). The risk factor group psychosocial/lifestyle is abbreviated to psychosocial. Created with BioRender.com (license agreements VG26BG3VTL, MK26BG46H3).
Figure 2.
Figure 2.
Genetic overlap between MDD and CVD beyond genome-wide genetic correlation. (a) Volcano plots based on LAVA results showing genomic loci (green dots) with the local genetic correlation between MDD and each of the CVDs (x-axis) and the corresponding P-value (y-axis). Loci exceeding the horizontal line are significant at PFDR<0.05. Multiple testing was performed separately for each trait over all considered loci (b) Venn diagrams based on MiXeR results showing the number of causal variants that are unique to MDD (left circle), unique to CVD (non-overlapping part of right circle), or shared between MDD and CVD (overlapping part of circles). (c) Genetic correlation estimated by LDSC (x-axis) against the percentage of MDD variants that are shared with the CVD trait as estimated by MiXeR (first plot), the percentage of CVD variants that are shared with MDD (second plot), and the percentage of CVD variants that are shared with MDD that have concordant effect directions (third plot). The fourth plot shows the percentage of local genetic correlations from LAVA that have concordant effect directions on the y-axis. a-c Sample sizes and information for underlying summary statistics GWASs are reported in Supplementary Table 1. MDD=Major Depressive Disorder, PAD=Peripheral Artery Disease, CAD=Coronary Artery Disease, AF=Atrial Fibrillation, HF=Heart Failure
Figure 3.
Figure 3.
Shared genetic liability factor for MDD-ASCVD. (a) Latent factor model as specified in Genomic SEM with the ‘observed’ variables in rectangles and the latent variables in circles. Factor loadings (standardized on the latent factors) are given in black and variances in blue. Sample sizes for underlying GWAS summary statistics are reported in Supplementary Table 1 (b) Latent MDD-ASCVD factor GWAS results. The x-axis shows genomic position, and the y-axis shows statistical significance as –log10(P). Genome-wide significant SNPs that were filtered out because of significant heterogeneity QSNP are displayed in grey. The top 10 eQTL genes are displayed with dashed vertical lines indicating their position. (c) Enrichment results in GTEx tissues for the latent MDD-ASCVD factor, with latent ASCVD (without MDD) and MDD-only as comparison. (d) Enrichment results for the latent MDD-ASCVD factor, latent ASCVD, and MDD-only in brain cell types. (e) Proportion of variance explained in MDD and CVD phenotypes in the UKB (defined using ICD-codes listed in Supplementary Table 14) by each of 3 PRSs for the latent MDD-ASCVD factor, latent ASCVD, or MDD-only. c, d Enrichment is measured using significance testing in a two-sided t-test displayed as -log10(P). Only tissues with a significant association (PFDR<0.05) are shown. Multiple testing was performed over tested tissues/cell-types. MDD=Major Depressive Disorder; MDD-ASCVD=common factor for MDD and ASCVD; ASCVD=common factor for the atherosclerotic cardiovascular diseases
Figure 4.
Figure 4.
Local and causal-variant level genetic correlations between MDD and risk factors. The legend is shared among all panels. (a) Venn diagrams based on MiXeR results showing the number of causal variants that are unique to MDD (left circle), the risk factor (non-overlapping part of right circle) or shared between MDD and the risk factor (overlapping part of circles). (b) Genome-wide genetic correlation estimated by LDSC (rg, x-axis) against the percentage of MDD causal variants that are shared with the risk factor as estimated by MiXeR (top left), the percentage of risk factor causal variants that are shared with MDD (top right), the percentage of risk factor causal variants that are shared with MDD that have concordant effect directions (bottom left). The bottom right plot shows the percentage of local genetic correlations from LAVA that have concordant effect directions on the y-axis. Cardiovascular traits are also shown for comparison. a, b Standard errors for MiXeR, LAVA, and LDSC results are reported in Supplementary Tables 2–6. Sample sizes for GWAS summary statistics are reported in Supplementary Table 1. Note that IL6 was excluded from MiXeR results because it failed performance checks (see methods). Psychosocial=Psychosocial/Lifestyle; PAD=Peripheral Artery Disease, CAD=Coronary Artery Disease, AF=Atrial Fibrillation, HF=Heart Failure, DBP=Diastolic Blood Pressure; SBP=Systolic Blood Pressure; PP=Pulse Pressure; Edu=Educational attainment; Phys. Act.=Physical activity; Child. Mal.=Childhood Maltreatment; T2D=Type II Diabetes; TG=Triglycerides; HDL=High-Density Lipoprotein; NonHDL=Non-High-Density Lipoprotein; TC=Total Cholesterol; LDL=Low-Density Lipoprotein; IL6=Interleukin-6; CRP=C-Reactive Protein;
Figure 5.
Figure 5.
Genome-wide correlations between MDD and risk factors. (a) Genetic correlation between MDD and CVD before and after adjustment for groups of risk factors (color coded). (b) Comparison of genetic correlation between MDD (dark green) and the latent CVD-ASMDD factor (lilac) and individual risk factors. a, b Points and error bars represent correlations and 95% CIs. Sample sizes for GWAS summary statistics are reported in Supplementary Table 1. Psychosocial=Psychosocial/Lifestyle; MDD=Major Depressive Disorder; AF=Atrial Fibrillation; CAD=Coronary Artery Disease; HF=Heart Failure; PAD=Peripheral Artery Disease; DBP=Diastolic Blood Pressure; SBP=Systolic Blood Pressure; PP=Pulse Pressure; Edu=Educational attainment; Phys. Act.=Physical activity; Child. Mal.=Childhood Maltreatment; T2D=Type II Diabetes; TG=Triglycerides; HDL=High-Density Lipoprotein; NonHDL=Non-High-Density Lipoprotein; TC=Total Cholesterol; LDL=Low-Density Lipoprotein; IL6=Interleukin-6; CRP=C-Reactive Protein
Figure 6.
Figure 6.
Results from univariable and multivariable MR (IVW estimates). (a) Effect of liability to MDD (exposure) on CVD and risk factors (outcomes). (b) Effects in the opposite direction with MDD as outcome and CVD and risk factors as exposures. (c) Effects of MDD on CVD while adjusting for groups of risk factors in multivariable MR. (d) Schematic overview of levels of evidence for causal effects, with solid lines indicating convincing evidence (consistent across sensitivity analyses) for such effects, and dashed lines indicating evidence for some of the relationships tested within the trait categories. The arrows from the risk factors to the association between MDD and the CVDs indicate that the combined risk factors attenuated the association so that it was no longer statistically significant. a-d Points and error bars represent regression coefficients and 95% CIs. Sample sizes for GWAS summary statistics are reported in Supplementary Table 1. The term beta refers to the log odds ratio. formula image 
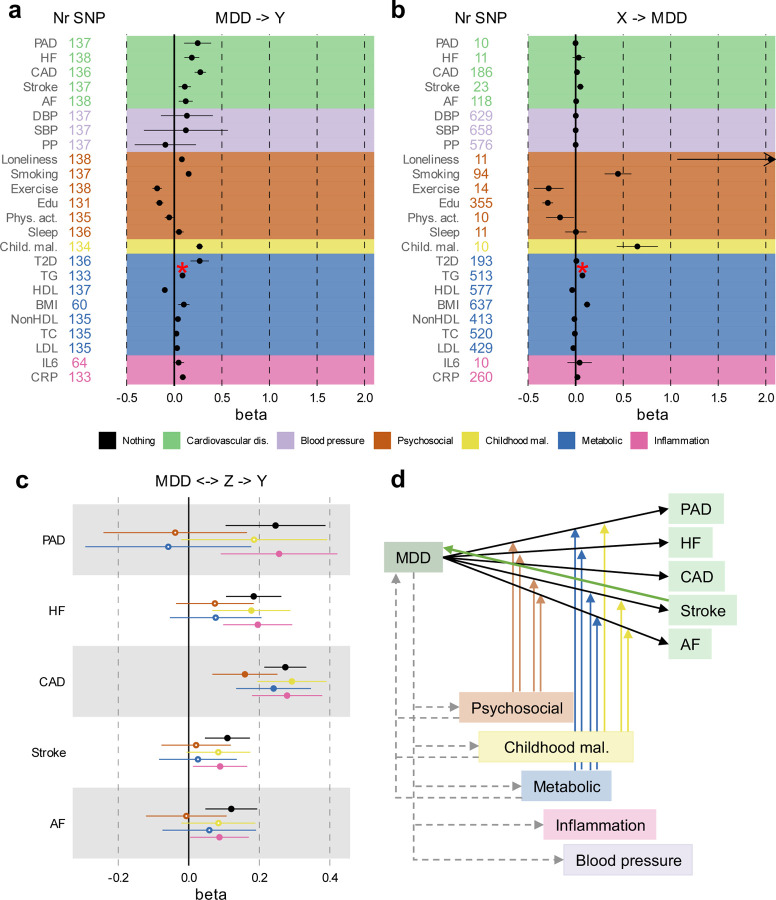
Indicates that the observed statistically significant association suffered from pleiotropy; possible causal effect should not be interpreted. Psychosocial=Psychosocial/Lifestyle; MDD=Major Depressive Disorder; MDD-ASCVD=common factor for CVD and MDD and ASCVD; PAD=Peripheral Artery Disease; HF=Heart Failure; STR=Stroke; CAD=Coronary Artery Disease; AF=Atrial Fibrillation; DBP=Diastolic Blood Pressure; SBP=Systolic Blood Pressure; PP=Pulse Pressure; Edu=Educational attainment; Phys. Act.=Physical activity; Child. Mal.= Childhood Maltreatment; T2D=Type II Diabetes; TG=Triglycerides; HDL=High-Density Lipoprotein; NonHDL=Non-High-Density Lipoprotein; TC=Total Cholesterol; LDL=Low-Density Lipoprotein; IL6=Interleukin-6; CRP=C-Reactive Protein; MR=Mendelian randomization IVW=Inverse Variance Weighted.

References

    1. Han X. et al. Disease trajectories and mortality among individuals diagnosed with depression: a community-based cohort study in UK Biobank. Mol Psychiatry 26, 6736–6746 (2021). - PMC - PubMed
    1. Nemeroff C. B. & Goldschmidt-Clermont P. J. Heartache and heartbreak—the link between depression and cardiovascular disease. Nat Rev Cardiol 9, 526–539 (2012). - PubMed
    1. Kendler K. S., Gardner C. O., Fiske A. & Gatz M. Major Depression and Coronary Artery Disease in the Swedish Twin Registry. Arch Gen Psychiatry 66, 857 (2009). - PMC - PubMed
    1. Xian H. et al. Genetic vulnerability and phenotypic expression of depression and risk for ischemic heart disease in the Vietnam era twin study of aging. Psychosom Med 72, 370–5 (2010). - PMC - PubMed
    1. Zhang F., Cao H. & Baranova A. Shared Genetic Liability and Causal Associations Between Major Depressive Disorder and Cardiovascular Diseases. Front Cardiovasc Med 8, (2021). - PMC - PubMed

Publication types