. 2023 May;2(5):467-485.
doi: 10.1038/s44161-023-00267-1. Epub 2023 May 8.

Statins improve endothelial function via suppression of epigenetic-driven EndMT

Affiliations

Statins improve endothelial function via suppression of epigenetic-driven EndMT

Chun Liu et al. Nat Cardiovasc Res. 2023 May.

Abstract

The pleiotropic benefits of statins in cardiovascular diseases that are independent of their lipid-lowering effects have been well documented, but the underlying mechanisms remain elusive. Here we show that simvastatin significantly improves human induced pluripotent stem cell-derived endothelial cell functions in both baseline and diabetic conditions by reducing chromatin accessibility at transcriptional enhanced associate domain elements and ultimately at endothelial-to-mesenchymal transition (EndMT)-regulating genes in a yes-associated protein (YAP)-dependent manner. Inhibition of geranylgeranyltransferase (GGTase) I, a mevalonate pathway intermediate, repressed YAP nuclear translocation and YAP activity via RhoA signaling antagonism. We further identified a previously undescribed SOX9 enhancer downstream of statin-YAP signaling that promotes the EndMT process. Thus, inhibition of any component of the GGTase-RhoA-YAP-SRY box transcription factor 9 (SOX9) signaling axis was shown to rescue EndMT-associated endothelial dysfunction both in vitro and in vivo, especially under diabetic conditions. Overall, our study reveals an epigenetic modulatory role for simvastatin in repressing EndMT to confer protection against endothelial dysfunction.


Figures

Extended Data Fig. 1 |
Extended Data Fig. 1 |. Statins improve endothelial function and alter epigenetic associated genes in iPSC-ECs.
a, NOS3 expression levels in iPSC-ECs after being treated with seven statins at different concentrations (0.1 μM, 1 μM, and 10 μM). Data are normalized to that of the vehicle control group; prava, pravastatin; atorva, atorvastatin; rosuva, rosuvastatin; meva, mevastatin; fluva, fluvastatin; lova, lovastatin; and simva, simvastatin (n = 6 biological samples). b, Simvastatin decreases the viability of iPSC-ECs at 10 μM (n = 3 biological samples). c, Simvastatin increases ROS production in iPSC-ECs at 10 μM (n = 3 biological samples). d, Representative images showing higher densities of capillary-like networks formed by iPSC-ECs from three healthy donors treated with simvastatin versus vehicle. Scale bars, 250 μm. e, Differentially expressed genes (DEGs) in simvastatin- versus vehicle-treated iPSC-ECs (FDR < 0.05). f, Simvastatin had no effect on iPSC-EC proliferation compared to vehicle (DMSO) (n = 4 biological samples). g, Enrichment (cellular components) analysis of upregulated DEGs shown in e. h, Enrichment (cellular components) analysis of downregulated DEGs shown in (e). All data are presented as mean ± SEM. Unpaired two-sided Student’s t-test (a,b,c).
Extended Data Fig. 2 |
Extended Data Fig. 2 |. Simvastatin alters chromatin accessibility in iPSC-ECs.
a, Annotation of ATAC peaks with differential chromatin accessibility. b and c, Motif enrichment analysis at the ATAC-seq sites with differential chromatin accessibility at enhancer regions. d, KEGG pathway analysis of the ATAC-seq peaks with KLF motifs. e and f, GO pathway analysis of ATAC-seq peaks with KLF motifs and TEAD motifs.
Extended Data Fig. 3 |
Extended Data Fig. 3 |. RNA-seq and ATAC-seq analyses of iPSC-ECs treated with simvastatin at different timepoints.
a, Heatmap of RNA-seq showing changes in transcriptomic patterns of iPSC-ECs after being treated with simvastatin at 0 h, 12 h, 24 h, and 72 h. b, Normalized expression levels of endothelial marker genes (KLF4, CDH5, and KDR) from RNA-seq of simvastatin-treated iPSC-ECs at different timepoints. c, Normalized expression levels of YAP downstream genes (SMAD3, CTGF, GLI2, MCL1, RUNX1, BIRC2, TGFB2, and BIRC5) from RNA-seq of simvastatin-treated iPSC-ECs at different timepoints. d, Normalized expression levels of mesenchymal genes (TGFBR1, TWIST1, SNAI2, and SOX9) from RNA-seq of simvastatin-treated iPSC-ECs at different timepoints. All data are presented as mean ± SEM. n = 2 RNA-seq biological samples.
Extended Data Fig. 4 |
Extended Data Fig. 4 |. Simvastatin inhibits YAP and TEAD activity in iPSC-ECs.
a, Comparative analysis showing that simvastatin exposure to iPSC-ECs for 12 h, 24 h, and 72 h induces highly correlated changes in DEGs and ATAC signal alterations (values indicate log2(fold change)). b, Immunofluorescence of YAP subcellular localization in iPSC-ECs treated with simvastatin versus vehicle control for 24 h. c, Quantification of nuclear/cytoplasmic YAP ratios in iPSC-ECs treated with simvastatin versus vehicle control for 24 h (n = 14 cells). d, iPSC-ECs treated with simvastatin (n = 101 cells) but not vehicle (n = 138 cells) for 24 h showing significantly decreased nuclear TEAD activity. e, Representative images of capillary-like tubular networks formed by iPSC-ECs treated with simva, simva + MA, simva + GGPP, simva + squalene, GGTi298, RhoAi, and vehicle control. All data are presented as mean ± SEM. Unpaired two-sided Student’s t-test (c,d).
Extended Data Fig. 5 |
Extended Data Fig. 5 |. Simvastatin reverses hyperglycemia (HG)-induced endothelial dysfunction by repressing YAP-mediated EndMT process.
a, ROS levels in iPSC-ECs treated with HG, HG + simvastatin, HG + GGTi298, HG + RhoAi, and vehicle control (n = 3 biological samples). b, Gene set enrichment analysis (GSEA) of the differentially regulated genes in HG versus vehicle control (top panel) and HG versus HG + simvastatin (bottom panel) reveals that HG-upregulated EndMT process is blunted by simvastatin. c, Heatmaps of epithelial-mesenchymal-transition gene sets in HG versus vehicle control (left) and HG versus HG + simvastatin (right) based on GSEA analysis. Representative western blot data (d) and densitometric quantification (e) showing the hyperglycemic condition (HG) decreases phosphorylated/total YAP in iPSC-ECs compared to the control condition. GAPDH serves as a loading control (n = 3 biological samples). All data are presented as mean ± SEM. Unpaired two-sided Student’s t-test (a).
Extended Data Fig. 6 |
Extended Data Fig. 6 |. In vivo validation of the endothelial protective effects of simvastatin in a diabetic mouse model.
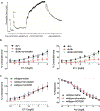
a, A representative trace of isometric tension in the mouse aorta. The aortic rings were equilibrated for 30 min under a resting tension of 10 mN after two sessions of pre-constriction with the vasoconstrictor PGF2α (1 μM). For a vasoconstriction response, endothelin-1 (ET-1, 0.1 nM to 1 μM) was used to induce a contractile response. At the plateau of maximal contraction, acetylcholine (Ach, 1 nM to 1 mM) was added accumulatively to initiate relaxation. b, Concentration-response relationship for ET-1-induced aortic constriction in mice treated with simvastatin (left panel) and GGTi298 (right panel). Developed tension was the force generated by aortic rings normalized to aortic tissue dry weight (mN/mg). Each point represents the mean developed contractile force ± SEM (n = 4 biological samples). c, Concentration-response relationship for ET-1-induced aortic constriction in wildtype mice treated with vehicle (saline), simvastatin (25 mg/kg), or GGTi298 (5 mg/kg) for 8 weeks (left panel). Concentration-response relationship for Ach-induced endothelial-dependent aortic relaxation in wildtype mice treated with vehicle (saline), simvastatin (25 mg/kg), or GGTi298 (5 mg/kg) for 8 weeks (right panel). Each point represents the mean constriction/relaxation response ± SEM (n = 4 biological samples). All data are presented as mean ± SEM.
Extended Data Fig. 7 |
Extended Data Fig. 7 |. RNA-seq analysis shows potent rescue effects of both simvastatin and GGTi298 on diabetes-induced vascular dysfunction in mice.
a, Venn diagram showing overlapped DEGs of db/+ (vehicle), db/db + simvastatin, and db/db + GGTi298 compared to the db/db + vehicle group, respectively. b, EndMT-associated genes, such as Ctgf, Vcam1, Tgfb2, and Smad3, were rescued by simvastatin and GGTi298 in diabetic mouse aortas (n = 2 RNA-seq biological samples). c, KEGG pathway analysis showing both simvastatin and GGTi298 improved genes associated with endothelial functions that were downregulated in db/db mouse aortas. d, Endothelial marker genes, such as Klf2, Nr2f2, and Klf5, were restored by simvastatin (simva) and GGTi298 in db/db mouse aortas (n = 2 RNA-seq biological samples). e, Representative immunofluorescent images showing YAP nuclear localization patterns in iPSC-ECs treated with disturbed flow, disturbed flow + simvastatin, laminar flow, and laminar flow + simvastatin. Blue: DAPI. Green: YAP. Scale bars: 50 μm. All data are presented as mean ± SEM.
Extended Data Fig. 8 |
Extended Data Fig. 8 |. Simvastatin-regulated enhancers identified by YAP ChIP-seq.
a, Western blot analysis showing simvastatin downregulated SOX9 expression in iPSC-ECs under disturbed and laminar flow patterns. b, Densitometric quantification of SOX9 protein expression changes in simvastatin- and vehicle-treated iPSC-ECs under disturbed and laminar flow patterns (n = 2 biological samples). c, Genome Browser snapshots of decreased binding loci at the NOTCH1 enhancer region showing simvastatin and GGTi298 treatment inhibited YAP binding at this region (highlighted in a yellow frame). d, Normalized gene expression levels (from RNA-seq) of Notch1 and Sox9 in aortas (n = 2 RNA-seq biological samples) from diabetic (db/db) and control mice (db/+). All data are presented as mean ± SEM. Unpaired two-sided Student’s t-test (b,d).
Extended Data Fig. 9 |
Extended Data Fig. 9 |. Schematic summary demonstrates that simvastatin rescues endothelial dysfunction by repressing YAP-mediated chromatin remodeling of the EndMT process.
A schematic overview showing our proposed model. In normal endothelial cells (ECs), geranylgeranyltransferase (GGTase) mediates YAP activity through the mevalonate pathway. Active YAP creates an ‘open chromatin status’ at the enhancer regions of genes regulating EndMT, such as SOX9. The diabetic condition further enhances YAP activity, thereby exacerbating endothelial functions by further upregulating EndMT genes. In contrast, statins decrease mevalonate levels via the inhibition of HMG-CoA reductase, followed by suppression of GGTase-mediated RhoA geranylgeranylation, consequently attenuating YAP activity (dashed line). Reduced YAP activity makes chromatin less-open (‘closed status’) at the enhancer regions of genes associated with EndMT. Diabetes-induced endothelial dysfunction can be alleviated by suppressing YAP activity with statins, GGTi298 or RhoA inhibitor (RhoAi), leading to the downregulation of EndMT genes. P, phosphorylation.
Fig. 1 |
Fig. 1 |. Simvastatin improves endothelial function by altering chromatin-associated transcriptome profiles of iPSC-ECs.
a, Schematic diagram of the experimental design. iPSC-ECs differentiated from three healthy donors (D1, D2 and D3) were treated with statins for functional assays and multiomic analysis. CHIR, CHIR99021. b, Representative immunofluorescent images showing iPSC-ECs (iECs) from three healthy donors (D1, D2 and D3) expressing the typical endothelial surface markers CD31 (green) and VE-cadherin (red). Scale bar, 50 μm. c, Simvastatin exhibits a dose-dependent upregulation of NOS3 in iPSC-ECs (n = 4 biological samples). d, Simvastatin-treated iPSC-ECs showing a higher density of capillary-like tubes than the vehicle (DMSO)-treated counterparts (n = 3 biological samples). e, Simvastatin-treated iPSC-ECs produce a higher level of NO than the vehicle-treated counterparts (n = 3 biological samples). f, Transcriptomic analysis showing differential expression of genes in iPSC-ECs after treatment with simvastatin versus vehicle control. g,h, Enrichment analysis showing upregulated (g) and downregulated (h) DEGs in simvastatin-treated iPSC-ECs compared to the vehicle control (red, terms associated with vascular function; blue, terms associated with epigenetic regulation). rRNA, ribosomal RNA. i,j, Circle plots showing upregulated (i) and downregulated (j) DEGs under the indicated ontologies in simvastatin- versus vehicle-treated iPSC-ECs. All data are presented as mean ± s.e.m. Unpaired two-sided Student’s t-test (ce).
Fig. 2 |
Fig. 2 |. Simvastatin reduces chromatin accessibility at TEAD elements and represses YAP activity.
a, Aggregated ATAC-seq signals across the peak summit (±5 kb) showing reduced accessibility of iPSC-ECs in the simvastatin group as compared to the vehicle control group (blue, vehicle control; red, simvastatin). CPM, counts per million. b, Annotation of all chromatin accessibility regions from the ATAC-seq data of simvastatin- and vehicle-treated iPSC-ECs. UTR, untranslated region. c, A heatmap showing the enrichment and depletion of various histone marks (from ENCODE; see Methods for ENCODE accessions) at the peak regions of our ATAC-seq dataset. H3K4me3, H3K4 trimethylation; H3K36me3, histone 3 lysine 36 trimethylation. d, ATAC-seq footprinting heatmap showing global differential accessibility scores between control- and simvastatintreated iPSC-ECs (FDR < 0.1). e, Motif-enrichment analysis at the ATAC-seq sites identified KLFs and TEADs as the most predominantly affected motifs with differential chromatin accessibility. TEAD, TEAD1 (Homer unpublished data); TEAD1 (Homer encode data). f, ATAC-seq footprinting heatmap showing differential accessibility scores between control- and simvastatin-treated samples at loci marked with TEAD or KLF motifs (fold change (FC) > 0.5 and FDR < 0.01). g, KEGG pathway analysis of the ATAC-seq peaks with TEAD motifs. cAMP, cyclic AMP; RAP1, repressor activator protein; TRP, transient receptor potential. h, Representative immunofluorescent images showing reduced YAP nuclear localization in iPSC-ECs treated with simvastatin versus vehicle control. Blue, DAPI; green, YAP. Scale bar, 100 μm. i, Quantitative data showing nuclear/cytoplasmic YAP ratios in iPSC-ECs treated with simvastatin and vehicle control (n = 11 cells). j, Western blot analysis showing that simvastatin downregulated total YAP, SOX9 and CTGF protein levels in iPSC-ECs (n = 2 biological samples). k, Quantification of YAP, SOX9 and CTGF protein-level changes in simvastatin- and vehicle-treated iPSC-ECs. All data are presented as mean ± s.e.m. Unpaired two-sided Student’s t-test (i,k).
Fig. 3 |
Fig. 3 |. RNA-seq and ATAC-seq analyses of simvastatin-treated iPSC-ECs at different time points.
a, PCA plot of RNA-seq results of simvastatin-treated iPSC-ECs at 0 h, 12 h, 24 h and 72 h. PC, principal component. b, KEGG pathway analysis of RNA-seq data showing multiple dysregulated pathways, including the Hippo pathway, in iPSC-ECs after 72 h of treatment with simvastatin. c, Normalized expression levels of endothelial marker genes NOS3 and KLF2 from RNA-seq data of simvastatin-treated iPSC-ECs at different time points (n = 2 RNA-seq biological samples). d, Normalized expression levels of YAP downstream genes TGFB1 and FGF1 from RNA-seq data of simvastatin-treated iPSC-ECs at different time points. e, Heatmap of ATAC-seq data of simvastatin-treated iPSC-ECs at 0 h, 12 h, 24 h and 72 h. f, TEAD motifs were significantly downregulated in iPSC-ECs after simvastatin treatment for 12 h, 24 h and 72 h versus 0 h. Values indicate −log10 (P values). NS, not significant. g, Schematic design of a YAP–TEAD activity fluorescence reporter system. CMV, cytomegalovirus; IRES, internal ribosome entry site. h, Representative fluorescent images of iPSC-ECs transfected with a YAPGFP–TEADmCherry reporter before treatment with simvastatin and vehicle control. i, Schematic design of a YAP–TEAD activity luciferase reporter system. j, Simvastatin reduced TEAD activity in iPSC-ECs compared to vehicle control over the course of 72 h using a TEAD response element-driven luciferase reporter (n = 5 biological samples). All data are presented as mean ± s.e.m. One-way ANOVA corrected with the Bonferroni method (j).
Fig. 4 |
Fig. 4 |. Simvastatin improves endothelial functions through the GGTase–RhoA–YAP signaling axis.
a, Quantitative PCR analysis showing expression levels of KLF2 and VCAM1 in iPSC-ECs treated with simvastatin, simvastatin + MA, simvastatin + GGPP, simvastatin + squalene, GGTi298, RhoAi and vehicle control (n = 3 biological samples). b, Representative immunofluorescent images showing YAP nuclear localization patterns (Cell Signaling Technology, 93622) in iPSC-ECs treated with simvastatin, simvastatin + MA, simvastatin + GGPP, simvastatin + squalene, GGTi298, RhoAi and vehicle control. Blue, DAPI; green, YAP. Scale bar, 100 μm. c, Nuclear/cytoplasmic YAP ratios in iPSC-ECs treated with simvastatin, simvastatin + MA, simvastatin + GGPP, simvastatin + squalene, GGTi298, RhoAi and vehicle control (n = 48 cells). d, Quantification of capillary-like tubular networks formed by iPSC-ECs treated with simvastatin, simvastatin + MA, simvastatin + GGPP, simvastatin + squalene, GGTi298, RhoAi and vehicle control (n = 3 biological samples). e, NO production by iPSC-ECs treated with simvastatin, simvastatin + MA, simvastatin + GGPP, simvastatin + squalene, GGTi298, RhoAi and vehicle control (n = 6 biological samples). f, Schematic overview of the regulation of YAP by the mevalonate pathway. Metabolites are shown in green boxes, and specific enzymes are also labeled. PP, pyrophosphate. All data are presented as mean ± s.e.m. One-way ANOVA corrected with the Bonferroni method (a,ce).
Fig. 5 |
Fig. 5 |. Simvastatin rescues diabetes-induced endothelial dysfunction.
a, Representative images of capillary-like tube densities in iPSC-ECs under conditions of HG, HG + simvastatin, HG + GGTi298, HG + RhoAi and vehicle control. Scale bars, 250 μm. b, Quantification of capillary-like tube numbers in iPSC-ECs under conditions of HG, HG + simvastatin, HG + GGTi298, HG + RhoAi and vehicle control (n = 3 biological samples). D1, donor 1 iPSC-ECs; D2, donor 2 iPSC-ECs. c, NO production levels in iPSC-ECs under the control condition, the HG condition and that of HG + simvastatin reveal that simvastatin restores HG-impaired NO production (n = 3 biological samples). d, Transcriptome profiles of iPSC-ECs treated with HG, HG + simvastatin and vehicle control. e, Venn diagrams of transcriptomic analysis showing overlapping genes in HG versus vehicle control and HG versus HG + simvastatin. Top: overlapping upregulated genes. Bottom: overlapping downregulated genes. f, Gene set enrichment analysis plots of the EMT gene set in HG versus vehicle control (top) and HG versus HG + simvastatin (bottom). NES, normalized enrichment score, relative to vehicle control or HG + simvastatin. g, Heatmap of ATAC-seq data showing differential peaks in diabetic stress HG versus vehicle-treated iPSC-ECs. h, Motif analysis identifies both increased and decreased chromatin accessibility to the ATAC regions in HG-treated iPSC-ECs. i, KEGG pathway analysis shows dysregulated pathways in HG conditions compared to vehicle control-treated iPSC-ECs. HTLV-1, human T lymphotropic virus type 1; ARVC, arrhythmogenic right ventricular cardiomyopathy; AMPK, AMP-activated protein kinase. All data are presented as mean ± s.e.m. Unpaired two-sided Student’s t-test (b), one-way ANOVA corrected with the Bonferroni method (c).
Fig. 6 |
Fig. 6 |. Simvastatin rescues diabetes-induced endothelial dysfunction via inhibition of the YAP-dependent mevalonate pathway bifurcation.
a, Western blot analysis showing that simvastatin downregulated total YAP and SOX9 levels in iPSC-ECs. b, Densitometric quantification of YAP and SOX9 protein expression changes in iPSC-ECs treated with vehicle control, HG medium, HG + simvastatin, HG + GGTi298 and HG + RhoAi (n = 2 biological samples). c, Representative immunofluorescent images showing YAP nuclear localization in iPSC-ECs treated with vehicle control, HG medium, HG + simvastatin, HG + GGTi298 and HG + RhoAi. Blue, DAPI; green, YAP. Scale bar, 100 μm. d, Nuclear/cytoplasmic YAP ratios in iPSC-ECs treated with vehicle control (n = 61 cells), HG medium (n = 58 cells), HG + simvastatin (n = 55 cells), HG + GGTi298 (n = 77 cells) and HG + RhoAi (n = 55 cells). e, Schematic design of CRISPRi to repress YAP1 transcription. Guided by a designed gRNA, CRISPRi uses a Tet-on controlled dCas9 (fused with a KRAB effector domain) to target the YAP1 promoter for transcriptional silencing upon addition of doxycycline. f, Quantitative PCR analysis showing significantly repressed YAP expression after targeted CRISPRi (n = 3 biological samples). g, Capillary-like tube numbers in iPSC-ECs transduced with the YAP CRISPRi (Tet-on dCas9) system in the vehicle control condition with dCas9 off, HG + dCas9 off and HG + dCas9 on (n = 3 biological samples). h, Quantitative PCR analysis showing the expression levels of VCAM1 and SOX9 in iPSC-ECs treated with diabetic medium (HG), HG + simvastatin, HG + GGTi298, HG + RhoAi and HG + YAP CRISPRi (n = 3 biological samples). i, Quantitative PCR analysis of SNAI2 and TWIST1 expression in iPSC-ECs treated with vehicle, HG and HG + YAP CRISPRi (n = 3 biological samples). All data are presented as mean ± s.e.m. Unpaired two-sided Student’s t-test (f), one-way ANOVA corrected with the Bonferroni method (bd,gi).
Fig. 7 |
Fig. 7 |. In vivo validation of the vasculoprotective role of simvastatin in a diabetic mouse model.
a, Experimental design schematic showing four groups of mice with different treatments. b, Concentration–response relationship for acetylcholine (Ach)-induced endothelial-dependent aortic relaxation in mice treated with simvastatin (top) and GGTi298 (bottom). Each point represents the mean relaxation response ±s.e.m. (n = 3 biological samples). c, PCA showing that simvastatin- and GGTi298-treated db/db mice were close to non-diabetic control (db/+) mice. d, KEGG pathway analysis showing GGTi298- and simvastatin-repressed genes that were upregulated in db/db aortas. AKT, serine–threonine kinase; MAPK, mitogen-activated protein kinase; NF-κB, nuclear factor κB; PI3K, phosphoinositide 3-kinase; TNF, tumor necrosis factor. e, Schematic diagram of different regions of the aorta receiving different blood flow shear stress patterns. f, Representative brightfield images of iPSC-ECs under static, disturbed flow, disturbed flow + simvastatin, laminar flow and laminar flow + simvastatin conditions after 72 h. g, Nuclear/cytoplasmic YAP ratios in iPSC-ECs under conditions of disturbed flow (n = 117 cells), disturbed flow + simvastatin (n = 117 cells), laminar flow (n = 127 cells) and laminar flow + simvastatin (n = 127 cells). All data are presented as mean ± s.e.m. Two-way ANOVA corrected with the Bonferroni method (b). Unpaired two-sided Student’s t-test (g). *P < 0.05.
Fig. 8 |
Fig. 8 |. Inhibition of the mevalonate pathway decreases YAP–TEAD binding at the SOX9 enhancer.
a, Average YAP ChIP–seq enrichment scores among vehicle-, GGTi298- and simvastatin-treated iPSC-ECs (blue, vehicle control; orange, GGTi298; red, simvastatin). b, Annotation of ChIP–seq YAP-binding regions. TTS, transcription termination site. c, Unsupervised hierarchical clustering of vehicle-, GGTi298- and simvastatin-treated iPSC-ECs using the differentially enriched binding regions. d, ChIP–seq footprinting heatmap showing differential binding regions between iPSC-ECs treated with vehicle versus GGTi298 or simvastatin (FDR < 0.1). e, Overlapping YAP-binding motifs in iPSC-ECs treated with GGTi298 and simvastatin versus vehicle. f, Top decreased overlapping YAP-binding peaks in iPSC-ECs treated with GGTi298 and simvastatin versus vehicle. g, Genome Browser snapshots of the decreased binding loci (SOX9 enhancer) after simvastatin and GGTi298 treatment (highlighted in a yellow frame). KO, knockout. h, Immunostaining of endothelial markers, CD31 and VE-cadherin in SOX9 enhancer-knockout iPSC-ECs. i, Quantitative PCR analysis showing decreased levels of SOX9 in SOX9 enhancer-knockout cells (n = 3 biological samples). j, Quantitative PCR analysis of SOX9 gene expression in SOX9 enhancer-knockout and WT iPSC-ECs under diabetic conditions (HG) (n = 3 biological samples). k, Tube formation changes in HG-treated SOX9 enhancer-knockout and WT iPSC-ECs (n = 3 biological samples). All data are presented as mean ± s.e.m. Unpaired two-sided Student’s t-test (ik).

Comment in

References

    1. Arnett DK et al. 2019 ACC/AHA Guideline on the primary prevention of cardiovascular disease: executive summary: a report of the American College of Cardiology/American Heart Association Task Force on Clinical Practice Guidelines. Circulation 140, e563–e595 (2019). - PMC - PubMed
    1. Chou R, Dana T, Blazina I, Daeges M & Jeanne TL Statins for prevention of cardiovascular disease in adults: evidence report and systematic review for the US Preventive Services Task Force. JAMA 316, 2008–2024 (2016). - PubMed
    1. Sen-Banerjee S et al. Kruppel-like factor 2 as a novel mediator of statin effects in endothelial cells. Circulation 112, 720–726 (2005). - PubMed
    1. Laufs U, La Fata V, Plutzky J & Liao JK Upregulation of endothelial nitric oxide synthase by HMG CoA reductase inhibitors. Circulation 97, 1129–1135 (1998). - PubMed
    1. Greenwood J & Mason JC Statins and the vascular endothelial inflammatory response. Trends Immunol. 28, 88–98 (2007). - PMC - PubMed