Review
. 2023 Aug 24:3:1240544.
doi: 10.3389/fradi.2023.1240544. eCollection 2023.

Spatial assessments in texture analysis: what the radiologist needs to know

Affiliations
Review

Spatial assessments in texture analysis: what the radiologist needs to know

Bino A Varghese et al. Front Radiol. .

Abstract

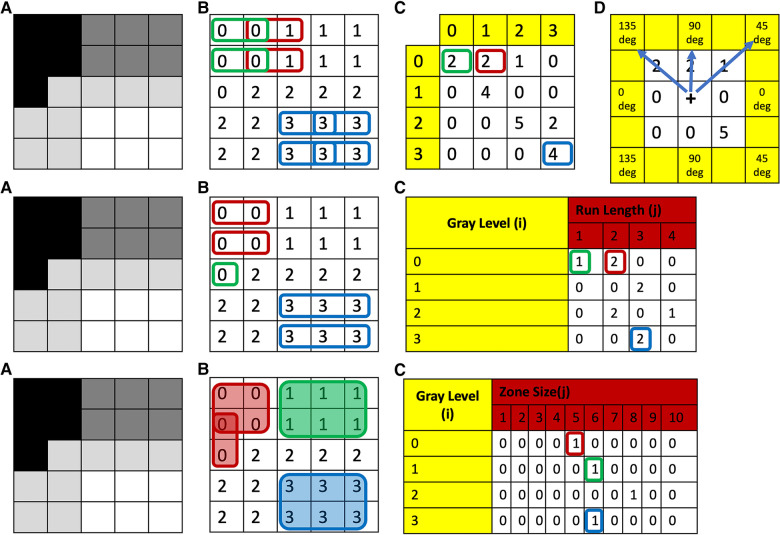
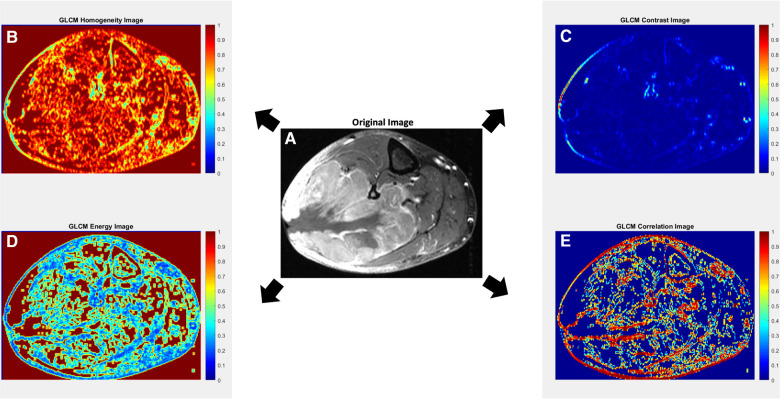
To date, studies investigating radiomics-based predictive models have tended to err on the side of data-driven or exploratory analysis of many thousands of extracted features. In particular, spatial assessments of texture have proven to be especially adept at assessing for features of intratumoral heterogeneity in oncologic imaging, which likewise may correspond with tumor biology and behavior. These spatial assessments can be generally classified as spatial filters, which detect areas of rapid change within the grayscale in order to enhance edges and/or textures within an image, or neighborhood-based methods, which quantify gray-level differences of neighboring pixels/voxels within a set distance. Given the high dimensionality of radiomics datasets, data dimensionality reduction methods have been proposed in an attempt to optimize model performance in machine learning studies; however, it should be noted that these approaches should only be applied to training data in order to avoid information leakage and model overfitting. While area under the curve of the receiver operating characteristic is perhaps the most commonly reported assessment of model performance, it is prone to overestimation when output classifications are unbalanced. In such cases, confusion matrices may be additionally reported, whereby diagnostic cut points for model predicted probability may hold more clinical significance to clinical colleagues with respect to related forms of diagnostic testing.

Keywords: artificial intelligence; machine learning; radiomics; spatial assessment; texture analysis.


Conflict of interest statement

GRM is a consultant for Canon Medical Systems, USA. VAD is a consultant for Radmetrix and Westat and serves on the advisory board for DeepTek. The authors declare that the research was conducted in the absence of any commercial or financial relationships that could be construed as a potential conflict of interest. The author(s) BKKF, BAV and GRM declared that they were an editorial board member of Frontiers, at the time of submission. This had no impact on the peer review process and the final decision.

Figures

Figure 1
Figure 1
Top row: (A) grayscale image with four different gray-levels. (B) Digitized version of the gray-level image with unique numerical values corresponding to the gray-level or a range of gray-levels (dependent on bin size of bin width) for each theoretical pixel/voxel. (C) GLCM map of the image obtained for distance 1 and direction 0 degrees. (D) This same process is then repeated in all other directions: i.e., 45, 90, and 135 deg, respectively. To obtain direction invariant results, all results are normalized and averaged. Middle row: (A) Grayscale image with four different gray-levels. (B) Digitized version of the gray-level image with unique numerical values corresponding to the gray-level or a range of gray-levels (dependent on bin size of bin width) for each theoretical pixel/voxel. (C) GLRLM map of the image obtained for direction zero degrees. This same process is then repeated in all other directions: i.e., 45, 90, and 135 deg, respectively. To obtain direction invariant results all results are normalized and averaged. Bottom row: (A) grayscale image with four different gray-levels. (B) Digitized version of the gray-level image with unique numerical values corresponding to the gray-level or a range of gray-levels (dependent on bin size of bin width) for each theoretical pixel/voxel. (C) GLSZM map of the image. GLCM, Gray-Level Co-Occurrence Matrix; GLRLM, Gray-Level Run-Length Matrix; GLSZM, Gray-Level Size-Zone Matrix.
Figure 2
Figure 2
Axial contrast-enhanced T1-weighted MR image with fat suppression of a 70-year-old male with leiomyosarcoma of the posterolateral calf (A), with corresponding texture parameter maps for Gray-Level Co-Occurrence Matrix (GLCM) homogeneity (B), GLCM contrast (C), GLCM energy (D) and GLCM correlation (E). The GLCM homogeneity map (B) reflects the closeness of the distribution of elements in the GLCM map relative to the GLCM diagonal. Highly homogenous regions (i.e., regions with less variation; close to the GLCM diagonal) receive a value of 1, while highly heterogenous regions receive a value of 0. The GLCM contrast map (C) measures the intensity contrast between an index pixel and its neighborhood pixels. Regions of high contrast show high heterogeneity in values up to a maximum value of 1. A constant image receives a value of 0. In some studies, contrast may also be referred to as variance and inertia. The GLCM energy map (D) measures the sum of the squared elements in the GLCM, whereby highly homogenous regions receive values of 1 and highly heterogenous regions receive values of 0. In some studies, energy may also be referred to as angular second moment, uniformity, or uniformity of energy. The GLCM correlation map (E) reflects how correlated a given pixel is to its neighboring pixels, with highly correlated regions receiving values of 1. In general, a neighborhood of 3 × 3 was adopted for the GLCM approach. Original image (A) courtesy of The Cancer Genome Atlas Sarcoma Collection (TCGA-SARC) based on data generated by the TCGA research network: http://cancergenome.nih.gov/ (38, 39).

References

    1. Juntu J, Sijbers J, De Backer S, Rajan J, Van Dyck D. Machine learning study of several classifiers trained with texture analysis features to differentiate benign from malignant soft-tissue tumors in T1-MRI images. J Magn Reson Imaging. (2010) 31(3):680–9. 10.1002/jmri.22095 - DOI - PubMed
    1. Wang H, Nie P, Wang Y, Xu W, Duan S, Chen H, et al. Radiomics nomogram for differentiating between benign and malignant soft-tissue masses of the extremities. J Magn Reson Imaging. (2020) 51(1):155–63. 10.1002/jmri.26818 - DOI - PubMed
    1. Wang H, Zhang J, Bao S, Liu J, Hou F, Huang Y, et al. Preoperative MRI-based radiomic machine-learning nomogram may accurately distinguish between benign and malignant soft-tissue lesions: a two-center study. J Magn Reson Imaging. (2020) 52(3):873–82. 10.1002/jmri.27111 - DOI - PubMed
    1. Varghese BA, Cen SY, Hwang DH, Duddalwar VA. Texture analysis of imaging: what radiologists need to know. AJR Am J Roentgenol. (2019) 212(3):520–8. 10.2214/AJR.18.20624 - DOI - PubMed
    1. Fields BKK, Hwang D, Cen S, Desai B, Gulati M, Hu J, et al. Quantitative magnetic resonance imaging (q-MRI) for the assessment of soft-tissue sarcoma treatment response: a narrative case review of technique development. Clin Imaging. (2020) 63:83–93. 10.1016/j.clinimag.2020.02.016 - DOI - PubMed

LinkOut - more resources