. 2023 Aug 23:30:546-557.
doi: 10.1016/j.omtm.2023.08.020. eCollection 2023 Sep 14.

Scalable GMP-compliant gene correction of CD4+ T cells with IDLV template functionally validated in vitro and in vivo

Affiliations

Scalable GMP-compliant gene correction of CD4+ T cells with IDLV template functionally validated in vitro and in vivo

Claudia Asperti et al. Mol Ther Methods Clin Dev. .

Abstract

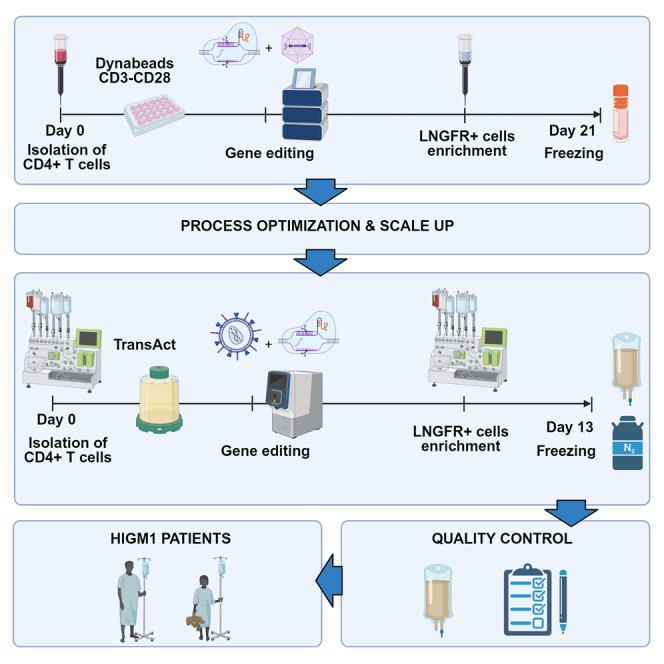
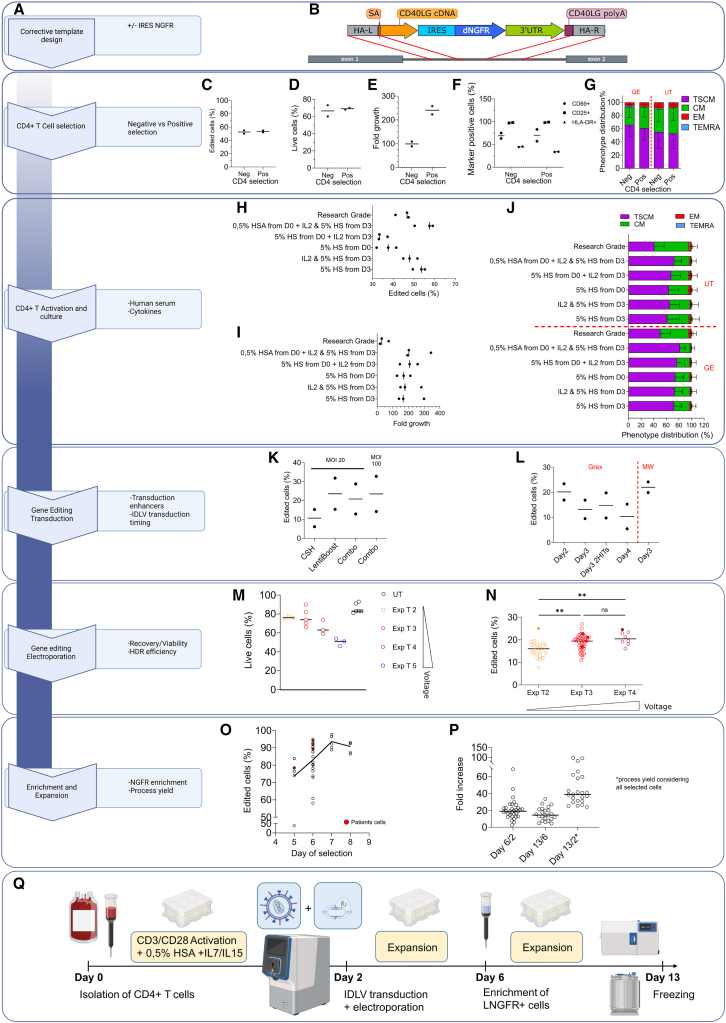
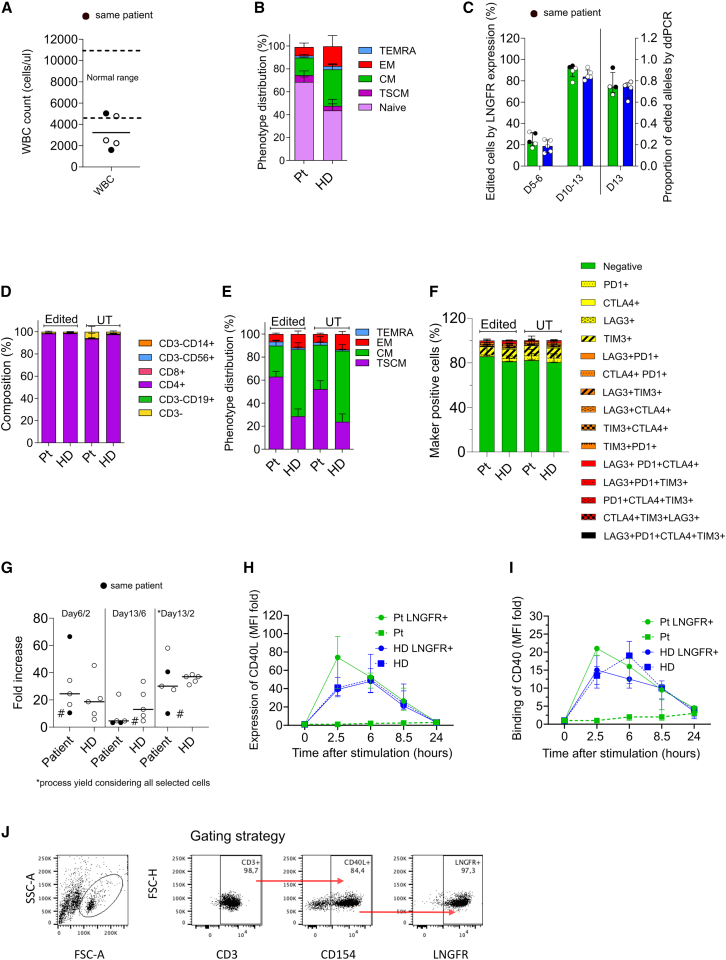
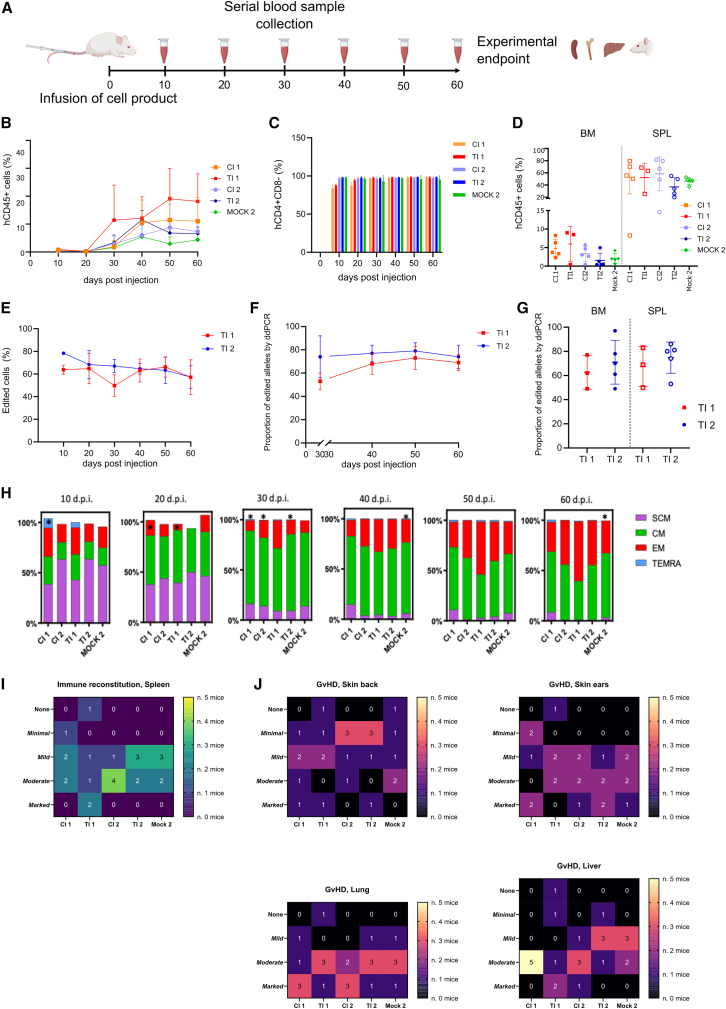
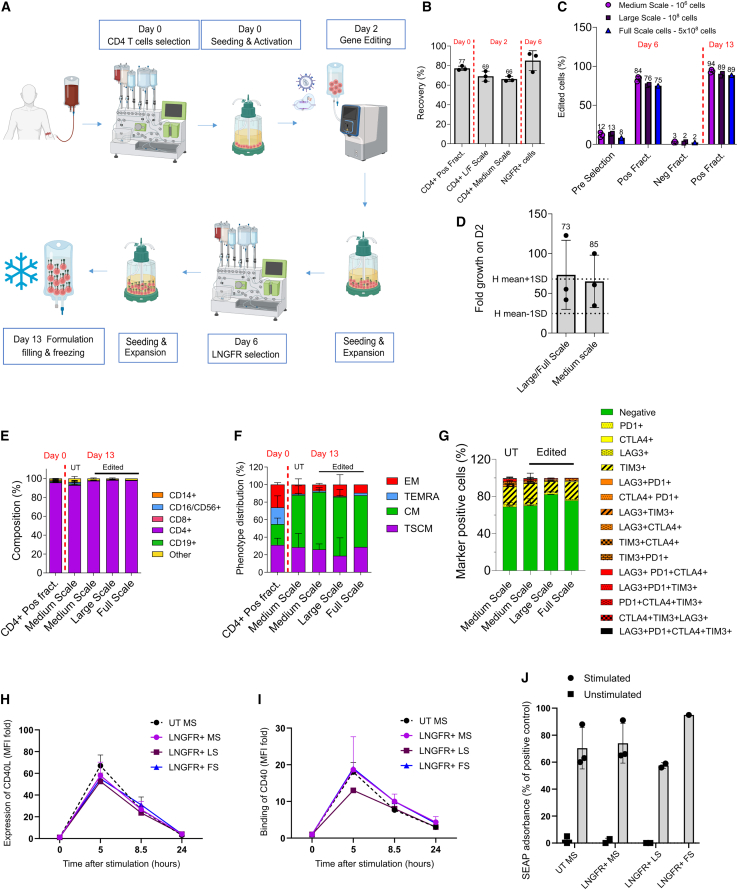
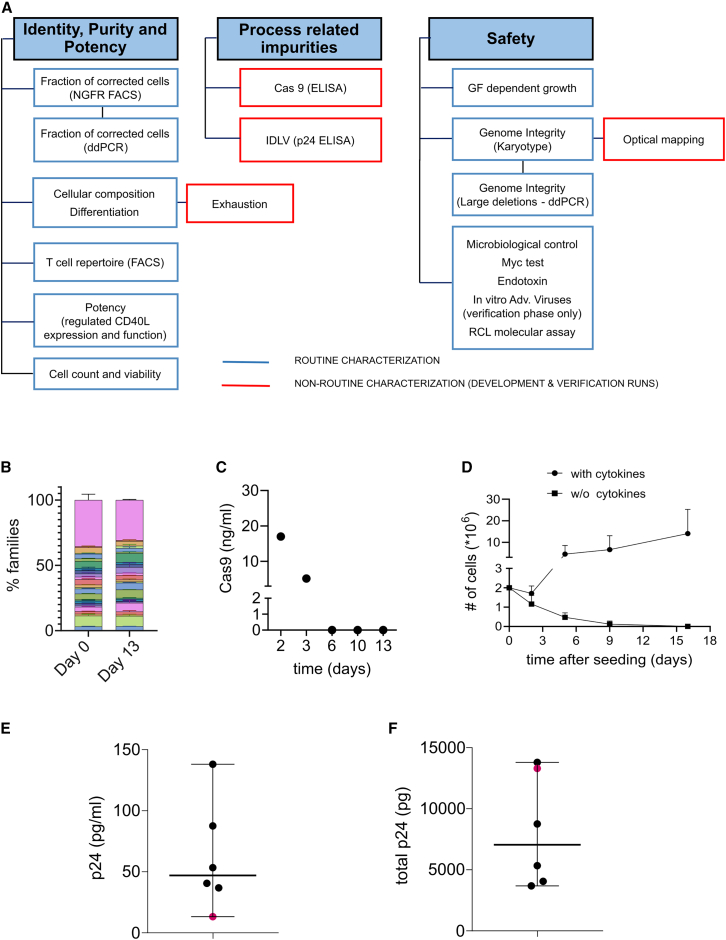
Hyper-IgM1 is a rare X-linked combined immunodeficiency caused by mutations in the CD40 ligand (CD40LG) gene with a median survival of 25 years, potentially treatable with in situ CD4+ T cell gene editing with Cas9 and a one-size-fits-most corrective donor template. Here, starting from our research-grade editing protocol, we pursued the development of a good manufacturing practice (GMP)-compliant, scalable process that allows for correction, selection and expansion of edited cells, using an integrase defective lentiviral vector as donor template. After systematic optimization of reagents and conditions we proved maintenance of stem and central memory phenotypes and expression and function of CD40LG in edited healthy donor and patient cells recapitulating the physiological CD40LG regulation. We then documented the preserved fitness of edited cells by xenotransplantation into immunodeficient mice. Finally, we transitioned to large-scale manufacturing, and developed a panel of quality control assays. Overall, our GMP-compliant process takes long-range gene editing one step closer to clinical application with a reassuring safety profile.

Keywords: Cas9; GMP; IDLV; gene editing; hyper-IgM1; large-scale process.


Conflict of interest statement

L.N., C.A., M.R., V.V., A.V., S.F., S.P., D.C., and A.J. are inventors of patent applications owned by Ospedale San Raffaele S.r.l. and Fondazione Telethon ETS, including one patent application on CD40LG gene editing. L.N. is founder, quota holder, and consultant of GeneSpire S.r.l.

Figures

None
Graphical abstract
Figure 1
Figure 1
Small- and medium-scale manufacturing of edited CD4+ T cells (A) Flow chart with the decision points for manufacturing process development. For each step, corresponding panels are encircled in blue. (B) Gene editing strategy: the corrective cassette is integrated by homologous recombination (red lines) in the first intron of the CD40LG gene (dark gray). HA-L, homology arm left; SA, splice acceptor; HA-R, homology arm right. (C–E) Comparison of CD4+ selection by single-antibody-positive selection vs. negative selection by antibody cocktail in terms of editing efficiency (C), viability (D), proliferation rate (E), expression of activation markers (F), and phenotype (mean ± SD) (G). (H–J) Impact of human serum (HS) and IL-2 supplementation at different time points on HDR efficiency (H), cell growth (I), and phenotype (J) (mean ± SD), with AAV6 donor template. (K) Impact of transduction enhancers cyclosporine H (CsH) and Lentiboost on editing efficiency, alone or in combination (Combo) targeting the AAVS1 locus with a GFP reporter IDLV. (L) Impact of timing of transduction on editing efficiency, assessed by LNGFR expression in CD40LG locus with IDLV donor template (B). (M and N) Relative performance of different Maxcyte GTx electroporation protocols in terms of cell viability (M) and HDR efficiency (N). Kruskal-Wallis test with Dunn’s multiple comparisons. Exp T2-T5 correspond to increased voltage settings. Exp, expanded. (O) Immunomagnetic enrichment of LNGFR+ cells at different days after isolation and editing. (P) Fold growth at D6, D13, and cumulative growth of healthy donor (HD) cells. D6/D2 is the cell fold growth measured at day 6, 4 days after gene editing, before the cell selection step. D13/D6 is the fold growth obtained at the end of the process (from day 6 to day 13), D13/D2 is the total fold growth from the day of the electroporation to the end of the process considering the loss of cells after the selection step. (Q) Schematic representation of the optimized small- and medium-scale protocol. Cells were immunomagnetically selected from buffy coats or peripheral blood samples using CD4 microbeads and activated in G-Rex 24-6-6M on day 0; transduced with IDLV and electroporated with Cas9 RNP using MaxCyte GTx on day 2; on day 6 LNGFR+ cells were enriched and seeded for cell expansion; and, at day 13, cells were frozen. AAV6 donor was used in (C–J). IDLV donor was used in the remaining panels. Empty dots indicate HD cells; full dots indicate patient cells. Editing efficiency, phenotype, and activation markers were assessed by flow cytometry. UT, untreated; GE, gene edited; TSCM, T stem cell memory; CM, central memory; EM, effector memory; TEMRA, terminal differentiated; MOI, multiplicity of infection; MW, multiwell. Percentage of live cells was assessed by trypan blue exclusion.
Figure 2
Figure 2
Confirmatory experiments on patient cells (A) White blood cell (WBC) count from patient blood samples. Dotted lines indicate the normal range of WBC in HDs. Full dots indicate the same patient analyzed at different time points. (B) Naive, TSCM, CM, EM, and TEMRA distribution in CD4+ cell-positive fraction (mean ± SEM). (C) Editing efficiency at day 5–6 by LNGFR expression and at day 13 by LNGFR expression and ddPCR (median ± IQR). Green bars, Pt; blue bars, HD. (D–F) Composition, phenotype distribution, and expression of exhaustion markers in patients and HD cells, (mean ± SEM). (G) Fold growth at D6, D13, and cumulative growth of patient and control cells. # indicates sample shipped overnight in suboptimal conditions. (H) Relative MFI of CD40L in LNGFR+ cells (median ± IQR). (I) Relative binding to CD40 in LNGFR+ cells (median ± IQR). (J) Gating strategy for expression of LNGFR in CD40L-expressing cells upon stimulation. Pt, patient; HD, healthy donor.
Figure 3
Figure 3
Xenotransplantation of edited cells (A) Scheme of experiment: NSG mice (n = 5/group) were transplanted with 20E+06 cells/mouse isolated from two HDs and left untreated (CI 1–2), edited (TI 1–2), or mock electroporated (Mock 2). Infused cells were manipulated as described in Figure 1A. Mice were followed by serial bleeding until experiment termination (day 60) when organs were collected for cytofluorimetric, molecular, and histopathological analysis. (B) Percentage of hCD45+ cells in human graft evaluated in peripheral blood (PB) of NSG mice over time (mean ± SD). (C) Percentage of hCD3+CD4+ cells in human graft evaluated in peripheral blood (PB) of NSG mice over time (mean ± SD). (D) Percentage of human CD45+ cells in bone marrow (BM) and spleen (SPL) of NSG mice at termination (day 60), mean ± SD. n = 5 mice/group with the exception of the TI1 group in which two mice were excluded due to failure in human cell engraftment and premature death. (E–G) Percentage of LNGFR+ cells analyzed by FACS (mean ± SD) (E) and proportion of edited alleles by ddPCR (mean ± SD) in PB over time (F) and in BM and SPL (G) at the end of experiment at day 60. (H) Phenotype of CD4+ cells in PB over time (10–30 days post injection [d.p.i.]). ∗Population in which only 1 or 2 out of 5 samples were above the low limit of quantification of the method (3+ cells/μL). Phenotype of n = 5 mice/group with the exception of the TI1 group in which two mice were excluded due to failure in human cell engraftment and premature death. (I) Heatmap indicating the spleen repopulation by engrafted cells. n = number of mice with none, minimal, mild to moderate, and marked mononuclear infiltration. (J) Heatmap indicating GvHD damage in skin (back and ear), lung, and liver. n = number of mice with none, minimal, mild to moderate, and marked GvH reaction. CI1-2, control item 1–2, untreated cells; TI1-2, test item 1–2, edited cells; Mock, mock electroporation.
Figure 4
Figure 4
Large-scale manufacturing process (A) Overview of the process. CD4+ cells were immunomagnetically selected from leukapheresis using CliniMACS Prodigy and activated in G-REX 100 CS on day 0, transduced with IDLV, and electroporated with Cas9 RNP using MaxCyte GTx on day 2, enriched for LNGFR expression on day 6, and frozen after 7 days of expansion. (B) Recovery of CD4+ T cells after CD4+ immunomagnetic selection with CliniMACS Prodigy (day 0), after cell activation (day 2), and recovery of LNGFR+ cells after LNGFR immunomagnetic selection (day 6), (mean ± SD). L/F, large/full scale. (C) Purity of HDR edited cells by LNGFR expression at the day of selection (day 6) and at the end of the process (day 13) using G-Rex 6M (medium scale) and G-Rex 100-CS (large scale), and G-Rex 500-CS (full scale) (mean ± SD). (D) Large- and full-scale process yield compared with the historical mean ± 1 SD of the medium-scale processes (dotted lines) (mean ± SD). (E–G) Composition (E), phenotype (F), and expression of exhaustion markers (G) at the end of the process (mean ± SD). (H–J) Potency assessed by CD40L expression (H) and binding to CD40 (F) (median ± IQR), and CD40 downstream signal transduction by SEAP colorimetric assay (J) in healthy donor cells (mean ± SD). LNGFR and CD40LG expression, phenotype, and binding to CD40 were assessed by flow cytometry. MS, medium scale; LS, large scale; FS, full scale.
Figure 5
Figure 5
Critical quality attributes (A) Overview of the quality control panel. The panel includes identity purity and potency assays, the identification of process-related impurities and safety tests. Blue boxes include routine characterization, either with release specifications or for information only (FIO), while red boxes include non-routine characterization of the cell product. (B) Cytofluorimetric analysis of the VBeta repertoire at day 0 or on the drug substance at day 13, n = 2 HDs. Each color represents VBeta sub-families, pink area shows uncovered repertoire (mean ± SD). (C) Residual Cas9 on the cell product at different time points during the manufacturing. (D) Growth factor-dependent growth assay. Cells from DP were seeded in presence or in absence of human cytokines and cell growth was measured by counting at different time points (mean ± SD). (E–F) Quantification of p24 concentration (E) and the amount of total p24 (F) to determine residual IDLV from the supernatant of cells before the formulation (median ± range).

References

    1. de la Morena M.T., Leonard D., Torgerson T.R., Cabral-Marques O., Slatter M., Aghamohammadi A., Chandra S., Murguia-Favela L., Bonilla F.A., Kanariou M., et al. Long-term outcomes of 176 patients with X-linked hyper-IgM syndrome treated with or without hematopoietic cell transplantation. J. Allergy Clin. Immunol. 2017;139:1282–1292. doi: 10.1016/j.jaci.2016.07.039. - DOI - PMC - PubMed
    1. Ferrua F., Galimberti S., Courteille V., Slatter M.A., Booth C., Moshous D., Neven B., Blanche S., Cavazzana M., Laberko A., et al. Hematopoietic stem cell transplantation for CD40 ligand deficiency: Results from an EBMT/ESID-IEWP-SCETIDE-PIDTC study. J. Allergy Clin. Immunol. 2019;143:2238–2253. doi: 10.1016/j.jaci.2018.12.1010. - DOI - PubMed
    1. Qamar N., Fuleihan R.L. The hyper IgM syndromes. Clin. Rev. Allergy Immunol. 2014;46:120–130. doi: 10.1007/s12016-013-8378-7. - DOI - PubMed
    1. Díaz Á., González-Alayón I., Pérez-Torrado V., Suárez-Martins M. CD40-CD154: A perspective from type 2 immunity. Semin. Immunol. 2021;53 doi: 10.1016/j.smim.2021.101528. - DOI - PubMed
    1. Ledbetter J.A., Shu G., Gallagher M., Clark E.A. Augmentation of normal and malignant B cell proliferation by monoclonal antibody to the B cell-specific antigen BP50 (CDW40) J. Immunol. 1987;138:788–794. - PubMed