. 2023 Aug 12;26(9):107624.
doi: 10.1016/j.isci.2023.107624. eCollection 2023 Sep 15.

Tangent functional connectomes uncover more unique phenotypic traits

Affiliations

Tangent functional connectomes uncover more unique phenotypic traits

Kausar Abbas et al. iScience. .

Abstract

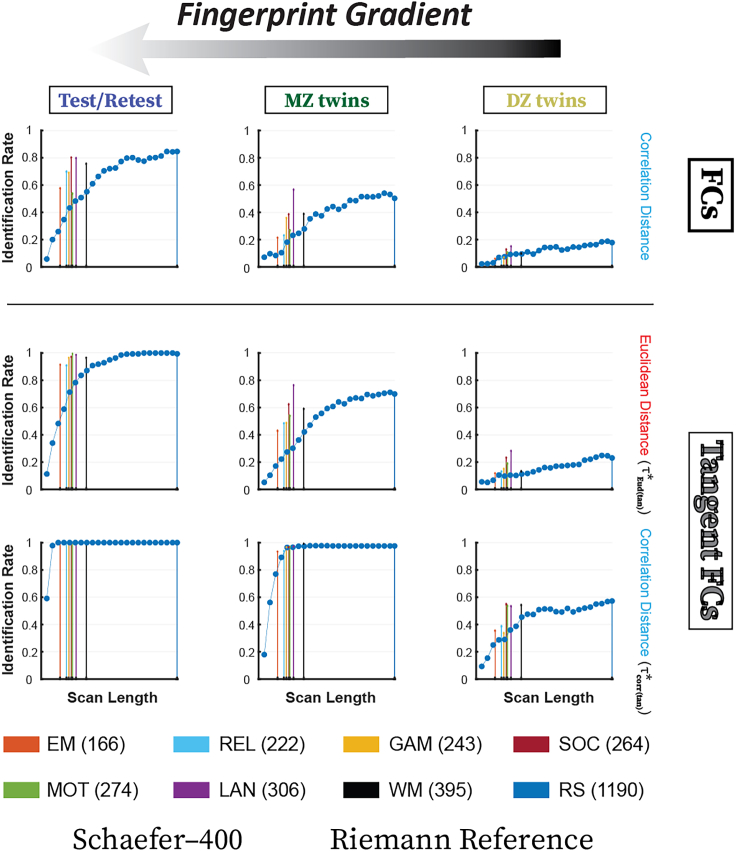
Functional connectomes (FCs) containing pairwise estimations of functional couplings between pairs of brain regions are commonly represented by correlation matrices. As symmetric positive definite matrices, FCs can be transformed via tangent space projections, resulting into tangent-FCs. Tangent-FCs have led to more accurate models predicting brain conditions or aging. Motivated by the fact that tangent-FCs seem to be better biomarkers than FCs, we hypothesized that tangent-FCs have also a higher fingerprint. We explored the effects of six factors: fMRI condition, scan length, parcellation granularity, reference matrix, main-diagonal regularization, and distance metric. Our results showed that identification rates are systematically higher when using tangent-FCs across the "fingerprint gradient" (here including test-retest, monozygotic and dizygotic twins). Highest identification rates were achieved when minimally (0.01) regularizing FCs while performing tangent space projection using Riemann reference matrix and using correlation distance to compare the resulting tangent-FCs. Such configuration was validated in a second dataset (resting-state).

Keywords: Biological sciences; Phenotyping.


Conflict of interest statement

The authors declare no competing interests.

Figures

None
Graphical abstract
Figure 1
Figure 1
Illustration of a Tangent Space Projection of FCs A sample of FCs is used to compute a reference matrix, Cref, which is used as the point of the SPD manifold upon which the tangent space is created. Using Cref and the analytical formula for the tangent space projection, all FCs (being correlation matrices) can then be projected to a tangent space.
Figure 2
Figure 2
Preliminary analysis on the effect of tangent space projection on the ID rates using 426 unrelated participants Results are shown for all eight fMRI conditions (using entire scan length for each condition and session), Schaefer 100 parcellation granularity, and Riemann reference for Cref. From left to right, the conditions are presented in descending order of scan length, as inscribed below the condition labels (in number of time points). Since FCs for all conditions are full rank at 100 parcellation granularity, FCs were not regularized before projection onto the tangent space, i.e., τ=0. Legend indicates different scenarios: Light-gray circles represent ID rates using correlation distance (IDcorr(orig)), while hollow triangles represent Euclidean distance ID rates (IDEud(orig)). Black squares represent ID rates when Euclidean distance is used to compare tangent-FCs (IDEud(tan)). (Of note, the error bars reflecting the standard error of the mean across cross-validation resamples are small enough to be hidden by the symbols).
Figure 3
Figure 3
Effect of tangent space projection on ID rates using 426 unrelated participants when FCs are regularized (τ=1 for all cases) and Euclidean distance is used to compare tangent-FCs Results are shown for all eight fMRI conditions (utilizing maximum available TRs for each condition) and increasing granularity of Schaefer parcellations (100–900). Left panel shows ID rates for FCs using correlation and Euclidean distance metrics to compare FCs (IDcorr(orig) and IDEud(orig), respectively). Right panel shows ID rates for tangent-FCs when applying different reference matrices (Cref). For tangent-FCs, Euclidean distance is used to compare FCs (IDEud(tan)). (Of note, the error bars reflecting the standard error of the mean across cross-validation resamples are small enough to be hidden by the symbols).
Figure 4
Figure 4
Optimal Regularization (τEud(tan)) and Euclidean Distance—Effect of tangent space projection on ID rates when FCs are regularized by optimal magnitude (τEud(tan)) and Euclidean distance is used to compare tangent-FCs Results are shown for all eight fMRI conditions (using entire fMRI scan length) and increasing granularity of Schaefer parcellations (100–900). For each fMRI condition and parcellation granularity, an optimal regularization magnitude was determined by the procedure in Table Optimal Regularization, and then the corresponding FCs were regularized by that magnitude. Left panel shows ID rates for FCs when correlation distance is used to compare FCs (IDcorr(orig)). Right panel shows the ID rates for tangent-FCs which are obtained by tangent space projection of FCs using six different reference matrices (Cref). For tangent-FCs, only Euclidean distance is used to compare FCs for this figure. (Of note, the error bars reflecting the standard error of the mean across cross-validation resamples are small enough to be hidden by the symbols).
Figure 5
Figure 5
Optimal Regularization (τcorr(tan)) and correlation Distance—Effect of tangent space projection on ID rates when FCs are regularized by optimal magnitude (τcorr(tan)) and correlation distance is used to compare tangent-FCs Results are shown for all eight fMRI conditions (utilizing maximum available TRs for each condition) and increasing granularity of Schaefer parcellations (100–900). For each fMRI condition and parcellation granularity, an optimal regularization magnitude was determined by the procedure detailed in Table optimal regularization, and then the corresponding FCs were regularized by that magnitude. Left panel shows ID rates for FCs when correlation distance is used to compare FCs, i.e., IDcorr(orig). Right panel shows the ID rates for tangent-FCs which are obtained by tangent space projection of FCs using different reference matrices (Cref). For tangent-FCs, only correlation distance is used to compare FCs for this figure, i.e., IDcorr(tan). (Of note, the error bars reflecting the standard error of the mean across cross-validation resamples are small enough to be hidden by the symbols).
Figure 6
Figure 6
Effect of optimal regularization on ID rates Only results corresponding to the Riemann reference are presented. (A) Optimal regularization magnitudes for all the fMRI conditions and parcellation granularities when Euclidean (τEud(tan); left) and correlation (τcorr(tan); right) distance is used to compare tangent-FCs (left). (B) ID rates corresponding to the optimal regularization magnitudes shown in (A). The subscript in each title indicates the distance metric used to compare the FCs: Eud(tan) for Euclidean and corr(tan) for correlation distance on tangent-FCs. The superscript indicates the type of optimal regularization that was used to regularize FCs. (C) ID rate gains when optimizing regularization for each distance: element-wise difference in the ID rates shown in (B) within Euclidean and correlation distance. The title at the top of each matrix shows this difference in an equation form.
Figure 7
Figure 7
Effect of tangent space projection and distance metric (correlation, Euclidean) on the Fingerprint Gradient Results are shown for all eight fMRI conditions (using maximum available TRs for each condition) and increasing granularity of Schaefer parcellations (100–900). Top row shows ID rates for FCs when correlation distance is used to compare FCs, i.e., IDcorr(orig). The ID rates for tangent-FCs using the Riemann reference are shown when using Euclidean distance (middle row) and correlation distance (bottom row). The corresponding optimal regularization values ensure that maximum available ID rates are presented for each given scenario. Sample sizes across the three cohorts (Test/Retest, MZ, and DZ twins; sample size = 63 pairs) were matched before computation of ID rates to enable meaningful comparisons. (Of note, the error bars reflecting the standard error of the mean across cross-validation resamples are small enough to be hidden by the symbols).
Figure 8
Figure 8
Effect of resting-state fMRI scan length (number of TRs) on the Fingerprint Gradient, and interaction with tangent space projections and the distance metrics (correlation, Euclidean) Results are shown for parcellation granularity of 400, and Riemann reference for projecting FCs into a tangent space. Left panel shows the ID rates for FCs and tangent-FCs for unrelated participants when the fMRI scan length increases (x axis shows the number of TRs used to construct FCs). Middle and right panels show results for the MZ and the DZ twins, respectively. The corresponding optimal regularization values are used to ensure that maximum available ID rates are presented for each given scenario. (Of note, the error bars reflecting the standard error of the mean across cross-validation resamples are small enough to be hidden by the symbols).
Figure 9
Figure 9
Effect of the fMRI scan length on the Fingerprint Gradient for resting state vs. task conditions Blue curve shows the ID rates for resting-state data with the fMRI scan length trimmed to shorter and longer than the task conditions (50–1190 TRs in steps of 50). Results are shown only for the parcellation granularity of 400, and when Riemann reference is used to project FCs into the tangent space. Left, middle, and the right columns show results for the unrelated test-retest participants, MZ twins, and the DZ twins, respectively. Top row shows results for the FCs when correlation distance is used (IDcorr(orig)), and bottom rows show the results for tangent-FCs when Euclidean (IDEud(tan); second row) and correlation (IDcorr(tan); third row) are used. Sample size (number of FCs) was matched across the three groups according to the smallest sample size (63 pairs). For tangent-FCs, when Euclidean distance was used, FCs were regularized by optimal magnitude τEud(tan), whereas when correlation distance was used, FCs were regularized by τcorr(tan). This ensured maximum available ID rates for each given scenario. (Of note, the error bars reflecting the standard error of the mean across cross-validation resamples are small enough to be hidden by the symbols).
Figure 10
Figure 10
Validation dataset. Effect of parcellation granularity and tangent space projection on ID rates on a cohort of 181 healthy controls Results are shown for resting-state condition and increasing granularity of Schaefer parcellations (100–1000). ID rates for FCs and tangent-FCs are shown when correlation distance is used to compare FCs, i.e., IDcorr(orig) and IDcorr(tan). For each parcellation granularity, a fixed regularization magnitude 0.01 and Riemann reference are used in tangent space projection of FCs. This configuration is based on the results obtained for the HCP young-adult. (Of note, the error bars reflecting the standard error of the mean across cross-validation resamples are small enough to be hidden by the symbols).

References

    1. Fornito A., Zalesky A., Bullmore E. Academic Press; 2016. Fundamentals of Brain Network Analysis.
    1. Sporns O. MIT Press; 2016. Networks of the Brain.
    1. Mantwill M., Gell M., Krohn S., Finke C. Brain connectivity fingerprinting and behavioural prediction rest on distinct functional systems of the human connectome. Commun. Biol. 2022;5:261. doi: 10.1038/s42003-022-03185-3. - DOI - PMC - PubMed
    1. Sripada C., Angstadt M., Rutherford S., Kessler D., Kim Y., Yee M., Levina E. Basic units of inter-individual variation in resting state connectomes. Sci. Rep. 2019;9:1900. doi: 10.1038/s41598-018-38406-5. - DOI - PMC - PubMed
    1. Abbas K., Liu M., Venkatesh M., Amico E., Kaplan A.D., Ventresca M., Pessoa L., Harezlak J., Goñi J. Geodesic distance on optimally regularized functional connectomes uncovers individual fingerprints. Brain Connect. 2021;11:333–348. doi: 10.1089/brain.2020.0881. - DOI - PMC - PubMed