. 2023 Aug 29:6:100152.
doi: 10.1016/j.bioflm.2023.100152. eCollection 2023 Dec 15.

Bacillus subtilis NDmed, a model strain for biofilm genetic studies

Affiliations

Bacillus subtilis NDmed, a model strain for biofilm genetic studies

Yasmine Dergham et al. Biofilm. .

Abstract

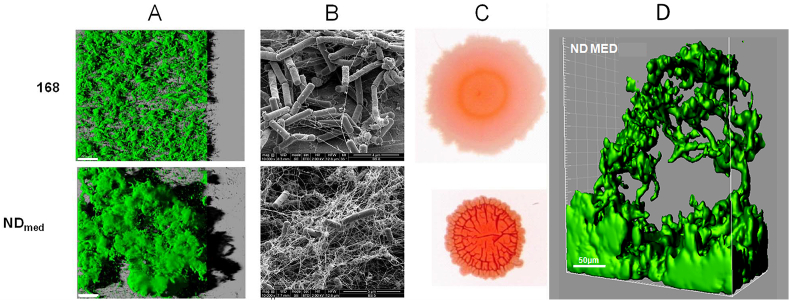
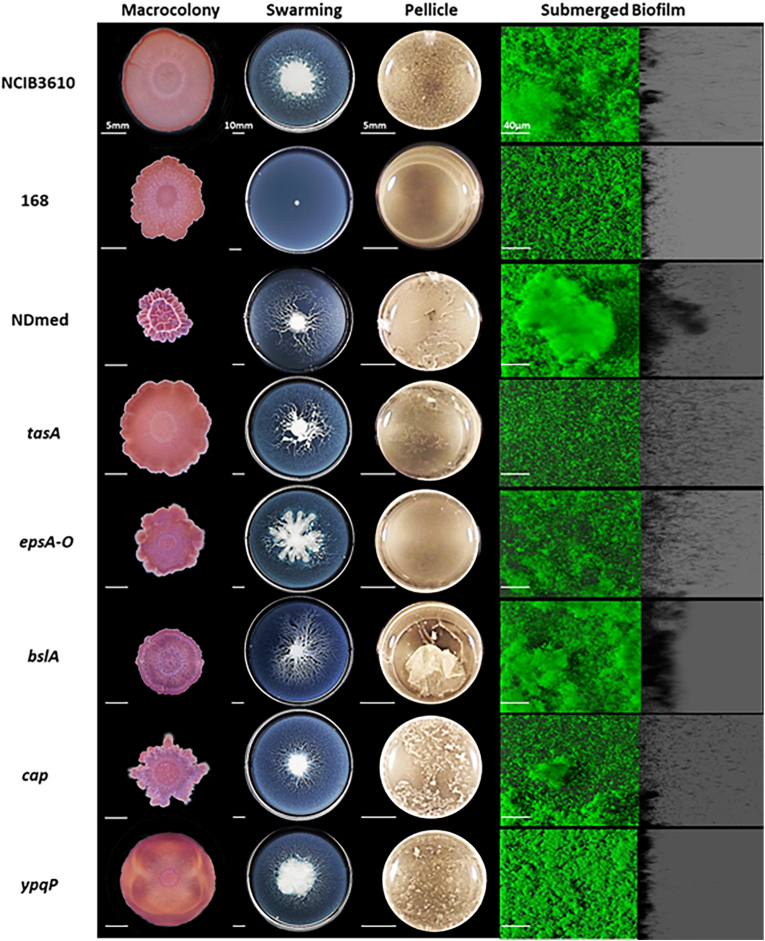
The Bacillus subtilis strain NDmed was isolated from an endoscope washer-disinfector in a medical environment. NDmed can form complex macrocolonies with highly wrinkled architectural structures on solid medium. In static liquid culture, it produces thick pellicles at the interface with air as well as remarkable highly protruding ''beanstalk-like'' submerged biofilm structures at the solid surface. Since these mucoid submerged structures are hyper-resistant to biocides, NDmed has the ability to protect pathogens embedded in mixed-species biofilms by sheltering them from the action of these agents. Additionally, this non-domesticated and highly biofilm forming strain has the propensity of being genetically manipulated. Due to all these properties, the NDmed strain becomes a valuable model for the study of B. subtilis biofilms. This review focuses on several studies performed with NDmed that have highlighted the sophisticated genetic dynamics at play during B. subtilis biofilm formation. Further studies in project using modern molecular tools of advanced technologies with this strain, will allow to deepen our knowledge on the emerging properties of multicellular bacterial life.

Keywords: Bacillus subilis; Biofilms; CLSM; Colony; NDmed; Pellicle.


Conflict of interest statement

The authors declare that they have no known competing financial interests or personal relationships that could have appeared to influence the work reported in this paper.

Figures

Fig. 1
Fig. 1
Macro-colony of B. subtilis NDmed. Composite image of a colony of B. subtilis NDmed taken in digital photography (left part) and confocal scanning laser microscopy (right part); (diameter of the colony is approximately 2 cm). This artwork picture has been presented among 10 finalists at an artistic scientific photographs concourse organized by the French Embassy in Tokyo (Japan) in Dec. 2022.
Fig. 2
Fig. 2
Comparison of architectures of biofilms formed by B. subtilis 168 and NDmed strains. (A) Aerial views of 168 and NDmed biofilm structure, with a virtual three-dimensional shadow projection on the right. Scale bars correspond to 50 μm. (B) Scanning Electron Microscopy images of 24-h biofilms. (C) Dye binding properties of 72 h macrocolonies grown on Congo red indicator medium. (D) Iso-surface representation of a particular ‘‘beanstalk-like’’ structure for NDmed (From Refs. [42,50]).
Fig. 3
Fig. 3
Peracetic acid (PAA) activity in B. subtilis biofilms. Visualization of the kinetics of membrane permeabilization (Chemchrome V6 fluorescence loss) in B. subtilis 168 and NDmed biofilms during PAA treatment (0.05%). Scale bars correspond to 20 μm (From Ref. [50]). Besides, when grown in mixed biofilm with Staphylococcus aureus, the B. subtilis NDmed strain demonstrated the ability to protect this pathogen from PAA action, thus enabling its persistence in the environment (Fig. 4) [50,51].
Fig. 4
Fig. 4
Architecture of S. aureus AH478 and B. subtilis NDmed/S. aureus AH478 mixed biofilm. (A) 3D reconstruction of S. aureus AH478 biofilm. (B) 3D reconstruction of mixed species biofilm of B. subtilis NDmed (green)/S. aureus AH478 (red). Scale bars correspond to 20 μm (From Ref. [50]). (For interpretation of the references to colour in this figure legend, the reader is referred to the Web version of this article.)
Fig. 5
Fig. 5
Three-dimensional organization of B. subtilis NDmed and S. aureus mixed biofilms. Mixed biofilms of S. aureus mCherry (red) and B. subtilis GFP (green) strains were grown for 48 h. Representative 3D reconstruction images of S. aureus and B. subtilis NDmed Wild-Type (A) or spsM mutant (B) mixed biofilms are presented. The scale bars represent 50 μm (From Ref. [61]). (For interpretation of the references to colour in this figure legend, the reader is referred to the Web version of this article.)
Fig. 6
Fig. 6
Visualization of the effect of ypqP (spsM) disruption on submerged-biofilm structure and complex colony morphology in B. subtilis NDmed. (A) Colonies of the NDmed Wild-Type, ypqP mutant, and ypqP-complemented strains were grown on TSB agar for 3 days. (B and C) Biofilms of the three strains were grown for 48 h and stained with SYTO9. For each strain, representative images of the adherent cells in contact with the surface (B) and the 3D reconstruction using IMARIS software (C) are presented. The scale bars represent 50 μm (From Ref. [61]).
Fig. 7
Fig. 7
Comparative phenotype for B. subtilis strains and NDmed mutants on different multicellular culture assays. Macrocolonies were grown on 1.5% agar TSA for 6 days at 30 °C. For swarming, 0.7% agar B-medium plates were inoculated on the middle and incubated for 24 h at 30 °C. Pellicles were obtained after 24 h of culture at 30 °C of bacteria in TSB in a 24-well plate. Macrocolony, swarming, and pellicle images are representative of the majority of the phenotype from at least three replicates for each strain revealing the effect of mutations on the biofilm formation. In a microplate system, immersed biofilms are labeled by SYTO 9 after 24 h of incubation at 30 °C. The shadow on the right represents the vertical projection of the submerged biofilm (scale bars represent 40 μm) (From Ref. [72]).
Fig. 8
Fig. 8
3D architecture of B. subtilis NDmed biofilm. (A) Three-dimensional reconstruction of biofilm from Confocal Laser Scanning Microscopy (CLSM) stack images. (C) Field Emission Scanning Electron Microscopy (FESEM) micrograph of biofilm. (B and D) Environmental Scanning Electron Microscopy (ESEM) micrographs of biofilm at pressure in a microscope chamber of 4 and 5 Torr, respectively (From Ref. [43]).
Fig. 9
Fig. 9
The biphasic process of submerged biofilm formation by B. subtilis NDmed. Left panel: (A) 4D-CLSM of B. subtilis NDmed GFP on submerged surfaces. Imaris Easy 3D reconstructions (top) and sections views as an XZ projection (bottom) at specific time points of a representative experiment of three independent experiments. The shadow on the right represents a vertical (YZ) projection of the submerged biofilm (scale bars represent 20 μm). (B) Space-time kymograph generated with BiofilmQ from 4D-CLSM series showing the brutal apparition of free cells in all the wells 3 h after biofilm initiation and the late initiation of submerged biofilm after 7 h. dz represents the distance to the surface in μm and Ich1 the GFP fluorescence intensity in relative arbitrary units. Representative of n = 3 independent biofilms. (C) Individual cell length coordinately and brutally drops during chain fragmentation 2–3 h after biofilm initiation. Chains fragmentation is correlated with an increased number of detected individual objects in the medium. Mean cell length ± SD calculated from n = 3 experiments. Right panel: Space-time kymographs for reporters (D) hag (motility), (E) tapA (matrix), (F) fnr (anaerobiosis) transcription during submerged biofilm formation of B. subtilis NDmed. Representative of n = 3 independent biofilms for each reporter. Kymographs were constructed with BiofilmQ visualization toolbox from 4D-CLSM image sequences with fluorescent transcriptional fusions (NDmed547 [amyE::Phag-gfp sacA::PtapA-mKate2] and GM3361 [Pfnr-gfpmut3]). dz represents the distance to the surface in μm and Ich1 the fluorescent reporter intensity in relative arbitrary units. (G) graph representing the oxygen concentration measured in two wells with a microelectrode showing a sharp decrease of oxygen concentration that drops from around 185 ppm at t = 0 below the probe detection limit after less than 5 h (From Ref. [74]).
Fig. 10
Fig. 10
Temporal tiling array transcriptome of Bacillus subtilis NDmed colonizing microplate wells. All the biomass from the wells was collected for the transcriptome analysis 1, 3, 4, 5, 7, 24, and 48 h after inoculation. A log2 fold change (log2FC) of expression was calculated for the genes from the ratio of expression over the average of expression across all temporal samples. The heatmap displays data for 48 genes selected from Subtiwiki categories, as representatives for the different functional categories [75]. The yellow and the blue represent respectively an upregulation or a downregulation of a gene compared to its average expression over the time course, with a scale adjusted to a log2FC of ±2.8 (From Ref. [74]). (For interpretation of the references to colour in this figure legend, the reader is referred to the Web version of this article.)
Fig. 11
Fig. 11
CLSM of NDmed 547 reporting in green the expression of hag (motility) and in red the expression of tapA (matrix synthesis). (A) 4D-CLSM of the biphasic submerged biofilm formation process. The scale bars represent 50 μm. (B) CLSM visualization of the wells colonization after 24 h, both on the surface (with a zoom on submerged biofilm on the bottom right with a scale bar of 30 μm) and at the liquid-air interface (with a zoom on a floating pellicle on the up right with a scale bar of 30 μm) (From Ref. [74]). (For interpretation of the references to colour in this figure legend, the reader is referred to the Web version of this article.)
Fig. 12
Fig. 12
Gene silencing by CRISPRi in B. subtilis NDmed. (A) Schematic view of CRISPRi-mediated silencing of gene expression. (B) Phase contrast images of NDmed_Pxyl-dcas9 cells expressing gRNAs targeting the mreB, mreC or ftsZ genes. Cells were cultivated in the presence of xylose1% for 5 h prior to observation. Control cells do not contain targeting gRNA sequences. Scale bars represent 10 μm. (C and D) Biofilm macrocolony assay. NDmed_Pxyl-dcas9 cells expressing gRNAs targeting the epsC gene or a negative control guide were inoculated at the center of a MSgg agar plate containing 1% xylose and grown at 30 °C for 40 h (C) or 60 h (D). The macrocolony phenotype resulting from the CRISPRi-mediated gene silencing of epsC was compared to those of the NDmed Wild-Type and ΔepsA-O mutant. The macrocolony images are representative of three replicates.

Similar articles

Cited by

References

    1. Flemming H.-C., Wingender J. The biofilm matrix. Nat Rev Microbiol. 2010;8:623–633. doi: 10.1038/nrmicro2415. - DOI - PubMed
    1. Flemming H.-C., Wuertz S. Bacteria and archaea on Earth and their abundance in biofilms. Nat Rev Microbiol. 2019;17:247–260. doi: 10.1038/s41579-019-0158-9. - DOI - PubMed
    1. Flemming H.-C., Wingender J., Szewzyk U., Steinberg P., Rice S.A., Kjelleberg S. Biofilms: an emergent form of bacterial life. Nat Rev Microbiol. 2016;14:563–575. doi: 10.1038/nrmicro.2016.94. - DOI - PubMed
    1. Stewart P., Franklin M. Physiological heterogeneity in biofilms. Nat Rev Microbiol. 2008;6:199–210. doi: 10.1038/nrmicro1838. - DOI - PubMed
    1. Chen Y., Yan F., Chai Y., Liu H., Kolter R., Losick R., et al. Biocontrol of tomato wilt disease by Bacillus subtilis isolates from natural environments depends on conserved genes mediating biofilm formation. Environ Microbiol. 2013;15:848–864. doi: 10.1111/j.1462-2920.2012.02860.x. - DOI - PMC - PubMed

LinkOut - more resources