. 2024 Jan;20(1):511-524.
doi: 10.1002/alz.13471. Epub 2023 Sep 11.

Delirium is associated with loss of feedback cortical connectivity

Affiliations

Delirium is associated with loss of feedback cortical connectivity

Klevest Gjini et al. Alzheimers Dement. 2024 Jan.

Abstract

Introduction: Post-operative delirium (POD) is associated with increased morbidity and mortality but is bereft of treatments, largely due to our limited understanding of the underlying pathophysiology. We hypothesized that delirium reflects a disturbance in cortical connectivity that leads to altered predictions of the sensory environment.

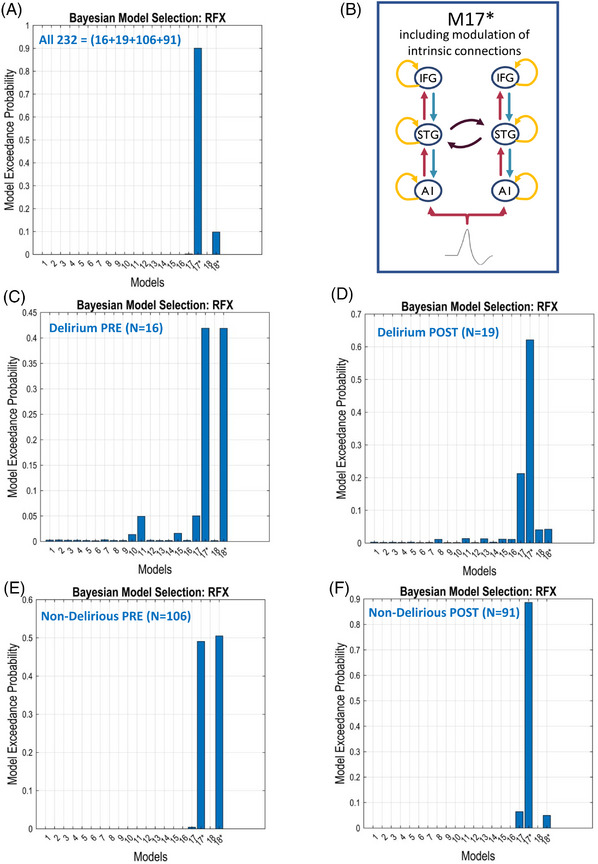
Methods: High-density electroencephalogram recordings during an oddball auditory roving paradigm were collected from 131 patients. Dynamic causal modeling (DCM) analysis facilitated inference about the neuronal connectivity and inhibition-excitation dynamics underlying auditory-evoked responses.

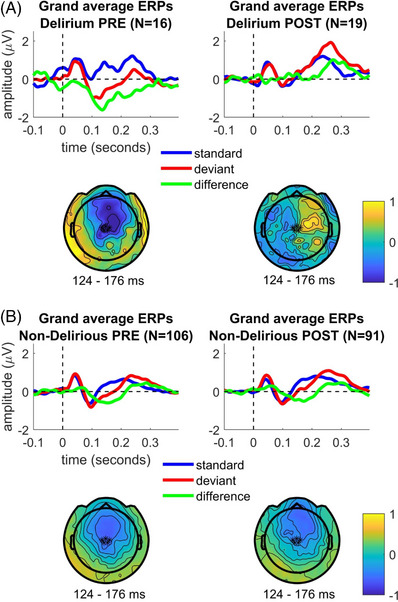
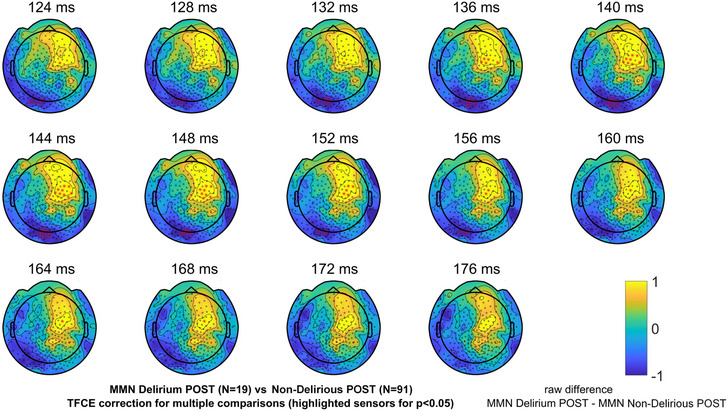
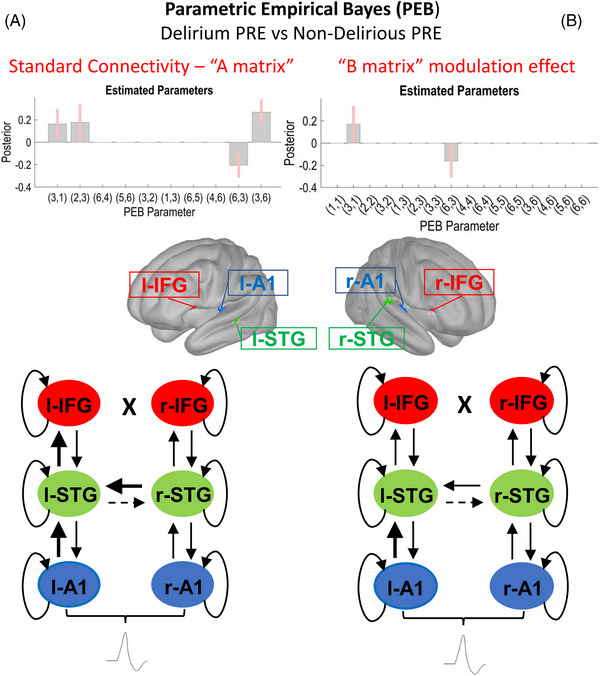
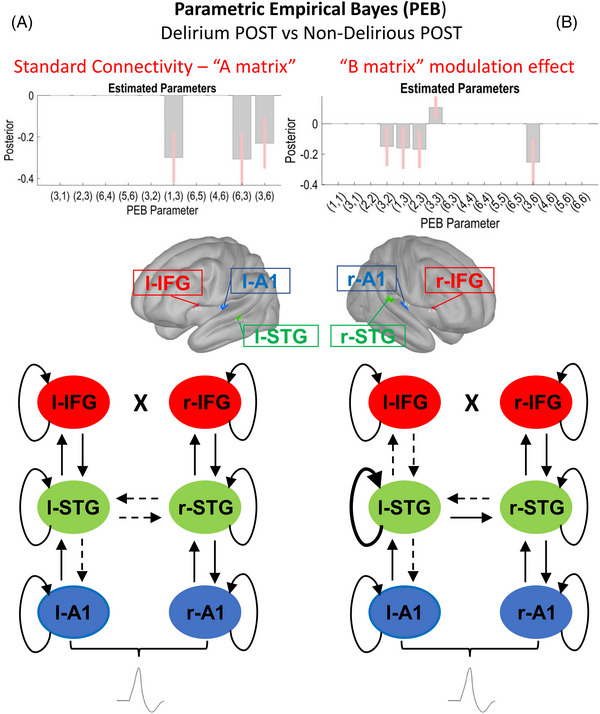
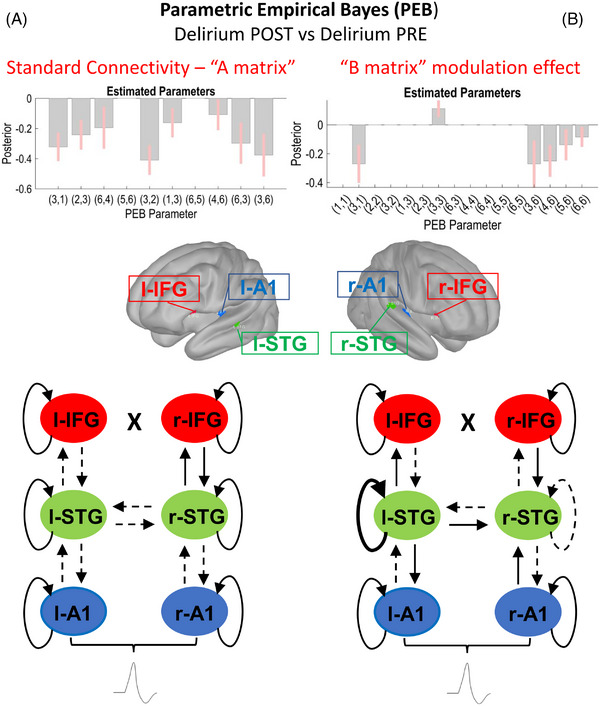
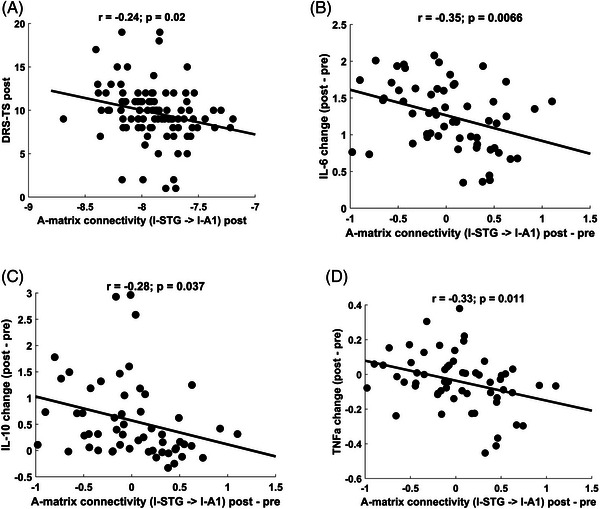
Results: Mismatch negativity amplitudes were smaller in patients with POD. DCM showed that delirium was associated with decreased left-sided superior temporal gyrus (l-STG) to auditory cortex feedback connectivity. Feedback connectivity also negatively correlated with delirium severity and systemic inflammation. Increased inhibition of l-STG, with consequent decreases in feed-forward and feed-back connectivity, occurred for oddball tones during delirium.

Discussion: Delirium is associated with decreased feedback cortical connectivity, possibly resulting from increased intrinsic inhibitory tone.

Highlights: Mismatch negativity amplitude was reduced in patients with delirium. Patients with postoperative delirium had increased feedforward connectivity before surgery. Feedback connectivity was diminished from left-side superior temporal gyrus to left primary auditory sensory area during delirium. Feedback connectivity inversely correlated with inflammation and delirium severity.

Keywords: auditory roving oddball paradigm; delirium; dynamic causal modeling; event-related potentials; evoked response potentials; high-density electroencephalogram; mismatch negativity; postoperative delirium; predictive coding framework.


Conflict of interest statement

The authors declare no conflicts of interest pertinent to this manuscript. Author disclosures are available in the supporting information.

Figures

FIGURE 1
FIGURE 1
Sensor space evoked response data from patients who experienced postoperative delirium collected preoperatively (Delirium PRE) and postoperatively (Delirium POST). A, Topographical plots of MMN grand averages from Delirium PRE and Delirium POST conditions, as well as MMN grand‐averaged waveforms from a representative sensor combination for MMN on scalp (signal average of E8/FCz and four other neighboring mid‐frontocentral sensors) highlighted with asterisks (*) in the displayed topoplots. B, The same is shown for Non‐Delirious PRE and Non‐Delirious POST participants’ data. ERP, evoked response potential; MMN, mismatch negativity
FIGURE 2
FIGURE 2
Sensor space evoked response data from patients who experienced delirium postoperatively (Delirium POST) and those who did not (Non‐Delirious POST). Topographical plots of raw differences in MMN amplitudes between Delirium POST and Non‐Delirious POST participants’ data for each time point in the evaluated time interval (124–176 ms). Significant differences (P < 0.05, TFCE‐corrected for multiple comparisons) of MMN amplitudes being smaller in Delirium POST compared to Non‐Delirious POST participants for each time point in the evaluated time interval (124–176 ms) are highlighted with red asterisks. MMN, mismatch negativity; TFCE, threshold‐free cluster enhancement
FIGURE 3
FIGURE 3
Population‐level best model resulting from a Bayesian model comparison. Random effects Bayesian model selection showed that labeled Model #17* (representing here a fully connected original M17 model with modulation of intrinsic/self‐connection at each node, with exception of lateral IFG connections [B]) had greater evidence compared to the other models, and was selected for subsequent quantitative analysis of effective connectivity between the subgroups (Delirium, Non‐Delirious) or conditions (PRE, POST). Here, Bayesian model comparison was conducted for all data (A) and separately for (C) Delirium PRE, (D) Delirium POST, (E) Non‐Delirious PRE, and (F) Non‐Delirious POST. Note: Exceedance probability is the probability of each model being better than any other model. The advantage of using exceedance probabilities is that they are sensitive to the confidence in the posterior probability and easily interpretable (because they sum to unity over all models tested). The best model is the one with highest exceedance probability (equivalently, the highest expected posterior probability; the ranking is the same). A1, primary auditory sensory area; IFG, inferior frontal gyrus; RFX, random effect analysis; STG, superior temporal gyrus
FIGURE 4
FIGURE 4
Secondary outcome: comparison of preoperative data from patients who experienced postoperative delirium (Delirium PRE, N = 16) and those who did not experience postoperative delirium (Non‐Delirious PRE, N = 106). Schematic display of the results of the parametric empirical Bayes (PEB) analysis following the dynamic causal modeling (DCM) based estimation (i.e., fitting the winning model to the individual data, to get estimates of the parameters). The PEB model has parameters encoding the deviation from the mean due to the group difference (covariate 2). For the two‐group difference, positive estimated parameters indicate stronger connectivity in first group than second group and negative parameters indicate the opposite. Posterior probabilities > 95% (corresponding to a strong evidence level) for the deviance detection effect of interest are shown. Sources #: (1) left A1; (2) left IFG; (3) left STG; (4) right A1; (5) right IFG; (6) right STG. In the diagrams, dashed and thicker lines for internodal connections mean decreased and increased connectivity, respectively. In case of curved lines for intrinsic inhibition, thicker and dashed lines mean increased and decreased inhibition, respectively. (A) Left section: Standard tone connectivity analyses (“A matrix”)—comparison of preoperative data from patients who experienced postoperative delirium (Delirium PRE, N = 16) and those who did not experience postoperative delirium (Non‐Delirious PRE, N = 106). PEB results interpretation (increase/decrease in connection strength): left A1 → l‐STG (increased in Delirium PRE), left STG → left IFG (increased in Delirium PRE), left STG → right STG (decreased in Delirium PRE), right STG → left STG (increased in Delirium PRE). (B) Right section: Difference between oddballs and standards (“B matrix”) modulation effect—comparison of preoperative data from patients who experienced postoperative delirium (Delirium PRE, N = 16) and those who did not experience postoperative delirium (Non‐Delirious PRE, N = 106). PEB results interpretation (increase/decrease in connection strength): left A1 → l‐STG (increased in Delirium PRE), left STG → right STG (decreased in Delirium PRE). A1, primary auditory sensory area; IFG, inferior frontal gyrus; STG, superior temporal gyrus
FIGURE 5
FIGURE 5
Primary outcome: comparison of postoperative data from delirious (Delirium POST, N = 19) and non‐delirious (Non‐Delirious POST, N = 91) patients. Schematic display of the results of the parametric empirical Bayes (PEB) analysis following the dynamic causal modeling (DCM) based estimation (i.e., fitting the winning model to the individual data, to get estimates of the parameters). The PEB model has parameters encoding the deviation from the mean due to the group difference (covariate 2). For the two‐group difference, positive estimated parameters indicate stronger connectivity in first group than second group and negative parameters indicate the opposite. Posterior probabilities > 95% (corresponding to a strong evidence level) for the deviance detection effect of interest are shown. Sources #: (1) left A1; (2) left IFG; (3) left STG; (4) right A1; (5) right IFG; (6) right STG. In the diagrams, dashed and thicker lines for internodal connections mean decreased and increased connectivity, respectively. In case of curved lines for intrinsic inhibition, thicker and dashed lines mean increased and decreased inhibition, respectively. (A) Left section: Standard tone connectivity analyses (“A matrix”)—comparison of postoperative data from delirious (Delirium POST, N = 19) and non‐delirious (Non‐Delirious POST, N = 91) patients. PEB results interpretation (increase/decrease in connection strength): left STG → left A1 (decreased in Delirium), left STG → right STG (decreased in Delirium), right STG → left STG (decreased in Delirium). (B) Right section: Difference between oddballs and standards (“B matrix”) modulation effect—comparison of postoperative data from delirious (Delirium POST, N = 19) and non‐delirious (Non‐Delirious POST, N = 91) patients. PEB results interpretation (increase/decrease in connection strength): left IFG → left STG (decreased in Delirium), left STG → left A1 (decreased in Delirium), left STG → left IFG (decreased in Delirium), left STG (increased self‐Inhibition in Delirium), right STG → left STG (decreased in Delirium). A1, primary auditory sensory area; IFG, inferior frontal gyrus; STG, superior temporal gyrus
FIGURE 6
FIGURE 6
Secondary outcome: comparison of postoperative (Delirium POST, N = 19) and preoperative data (Delirium PRE, N = 16). Schematic display of the results of the parametric empirical Bayes (PEB) analysis following the dynamic causal modeling (DCM) based estimation (i.e., fitting the winning model to the individual data, to get estimates of the parameters). The PEB model has parameters encoding the deviation from the mean due to the group difference (covariate 2). For the two‐condition difference, positive estimated parameters indicate stronger connectivity in first group than second group and negative parameters indicate the opposite. Posterior probabilities > 95% (corresponding to a strong evidence level) for the deviance detection effect of interest are shown. Sources #: (1) left A1; (2) left IFG; (3) left STG; (4) right A1; (5) right IFG; (6) right STG. In the diagrams, dashed and thicker lines for internodal connections mean decreased and increased connectivity, respectively. In case of curved lines for intrinsic nodal inhibition, thicker and dashed lines mean increased and decreased inhibition, respectively. (A) Left section: Standard tone connectivity analyses (“A matrix”) for the difference between postoperative (Delirium POST, N = 19) and preoperative data (Delirium PRE, N = 16). PEB results interpretation (increase/decrease in connection strength): left A1 → left STG (decreased in Delirium), left STG → left IFG (decreased in Delirium), right A1 → right STG (decreased in Delirium), left IFG → left STG (decreased in Delirium), left STG → left A1 (decreased in Delirium), right STG → right A1 (decreased in Delirium), left STG → right STG (decreased in Delirium). right STG → left STG (decreased in Delirium). (B) Right section: Difference between oddballs and standards (“B matrix”) modulation effect for the difference between postoperative (Delirium POST, N = 19) and preoperative data (Delirium PRE, N = 16). PEB results interpretation (increase/decrease in connection strength): left A1 → left STG (decreased in Delirium), left STG (increased self‐Inhibition in Delirium), right STG → left STG (decreased in Delirium), right STG → right A1 (decreased in Delirium), right STG → right IFG (decreased in Delirium), left STG (decreased self‐Inhibition in Delirium). A1, primary auditory sensory area; IFG, inferior frontal gyrus; STG, superior temporal gyrus
FIGURE 7
FIGURE 7
Secondary outcome: correlations between “A matrix” connectivity changes with DRS‐TS and cytokine levels. Decreased feedback connectivity from l‐STG to l‐A1 (due to standard stimulus effects) significantly correlated with larger DRS‐TS scores postoperatively and increased change in systemic inflammation represented by measured cytokine levels: (A) DRS‐TS (r = −0.24; P = 0.02), (B) IL‐6 (r = −0.35; P = 0.007), (C) IL‐10 (r = −0.28; P = 0.04), (D) TNF‐α (r = −0.33; P = 0.01), supporting the association of loss of feedback connectivity and delirium severity. Cytokine levels were log10‐transformed. A1, primary auditory sensory area; DRS‐TS, Delirium Rating Scale total score; IL, interleukin, STG, superior temporal gyrus; TNF‐α, tumor necrosis factor alpha

References

    1. Goldberg TE, Chen C, Wang Y, et al. Association of delirium with long‐term cognitive decline: A meta‐analysis. JAMA Neurol. 2020;77:1373‐1381. - PMC - PubMed
    1. Pereira JV, Aung Thein MZ, Nitchingham A, Caplan GA. Delirium in older adults is associated with development of new dementia: a systematic review and meta‐analysis. Int J Geriatr Psychiatry. 2021;36(7):993‐1003. - PubMed
    1. Gou RY, Hshieh TT, Marcantonio ER, et al. One‐year medicare costs associated with delirium in older patients undergoing major elective surgery. JAMA Surg. 2021;156:430‐442. - PMC - PubMed
    1. Sanders RD, Pandharipande PP, Davidson AJ, Ma D, Maze M. Anticipating and managing postoperative delirium and cognitive decline in adults. BMJ. 2011;343:d4331. - PubMed
    1. Sanders RD. Hypothesis for the pathophysiology of delirium: role of baseline brain network connectivity and changes in inhibitory tone. Med Hypotheses. 2011;77:140‐143. - PubMed

Publication types