. 2023 Nov 15;83(22):3813-3826.
doi: 10.1158/0008-5472.CAN-23-0401.

SETD2 Deficiency Confers Sensitivity to Dual Inhibition of DNA Methylation and PARP in Kidney Cancer

Affiliations

SETD2 Deficiency Confers Sensitivity to Dual Inhibition of DNA Methylation and PARP in Kidney Cancer

Xinyi Zhou et al. Cancer Res. .

Abstract

SETD2 deficiency alters the epigenetic landscape by causing depletion of H3K36me3 and plays an important role in diverse forms of cancer, most notably in aggressive and metastatic clear-cell renal cell carcinomas (ccRCC). Development of an effective treatment scheme targeting SETD2-compromised cancer is urgently needed. Considering that SETD2 is involved in DNA methylation and DNA repair, a combination treatment approach using DNA hypomethylating agents (HMA) and PARP inhibitors (PARPi) could have strong antitumor activity in SETD2-deficient kidney cancer. We tested the effects of the DNA HMA 5-aza-2'-dexoxydytidine (DAC), the PARPi talazoparib (BMN-673), and both in combination in human ccRCC models with or without SETD2 deficiency. The combination treatment of DAC and BMN-673 synergistically increased cytotoxicity in vitro in SETD2-deficient ccRCC cell lines but not in SETD2-proficient cell lines. DAC and BMN-673 led to apoptotic induction, increased DNA damage, insufficient DNA damage repair, and increased genomic instability. Furthermore, the combination treatment elevated immune responses, upregulated STING, and enhanced viral mimicry by activating transposable elements. Finally, the combination effectively suppressed the growth of SETD2-deficient ccRCC in in vivo mouse models. Together, these findings indicate that combining HMA and PARPi is a promising potential therapeutic strategy for treating SETD2-compromised ccRCC.

Significance: SETD2 deficiency creates a vulnerable epigenetic status that is targetable using a DNA hypomethylating agent and PARP inhibitor combination to suppress renal cell carcinoma, identifying a precision medicine-based approach for SETD2-compromised cancers.


Conflict of interest statement

Conflict of Interest:

G. L. is a consultant for PANGEA LABORATORY. I.S.G. is a consultant for STEBA. D. I. Quinn reports employment by Abbvie Research and Development and Honoraria for advisory board participation from Merck Sharp and Dohme, Genentech/Roche, Pfizer, EMD Serono, Astellas, Seagen and BMS. No potential conflicts of interest were disclosed by the other authors.

Figures

Figure 1.
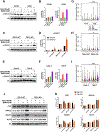
Figure 1.. Combination treatment of an HMA (DAC) with a PARPi (BMN-673) synergistically inhibits cell growth and induces apoptosis in SETD2-deficient RCC cell lines.
A-C: Western blot of H3K36me3 (left panel) and cell proliferation assay (right panel, 5 days after the indicated treatments; NT: non-treated; 25, 50, 100nM DAC; 10nM BMN-673; combination treatments: 25nM DAC + 10nM BMN-673: 50nM DAC + 10nM BMN-673; 100nM DAC + 10nM BMN-673) in ACHN and A498 (A), Caki-2 and 769-P (B) and 786–0 SETD2-WT/KO (C) cell lines. D-F: Cell cycle arrest analysis (5 days post indicated treatments; concentration: NT: non-treated; 100nM DAC; 10nM BMN-673; combination treatment: 100nM DAC 100nM + 10nM BMN-673 in ACHN and A498 (D), Caki-2 and 769-P (E) and 786–0 SETD2-WT/KO (F) cell lines. Bar graphs represent the percentage of cells in G0/G1 (gray), S (red) and G2/M (blue) phases. G-I: Flow cytometry apoptosis analysis (7 days post indicated treatments; NT: non-treated; 100nM DAC; 10nM BMN-673; combination treatment: 100nM DAC + 10nM BMN-673) in ACHN and A498 (G), Caki-2 and 769-P (H) and 786–0 SETD2-WT/KO (I) cell lines. Bar graphs represent the percentage of cells in early apoptosis (red), late apoptosis (black), and necrotic (green) stages. Values are presented as mean ± SEM of three independent experiments. Two-tailed unpaired t-test was used to calculate statistical significance. n.s.: non-significant, * p<0.05, ** p<0.01, *** p<0.001, **** p<0.0001.
Figure 2.
Figure 2.. SETD2-deficent RCC cell lines generate more DNA damage but fail to initiate sufficient DNA damage repair upon combination treatment.
A-B: Western blot of γ-H2A.X (96h post indicated treatments) (A) and bar graphs of γ-H2A.X/H3 relative ratio to NT groups (B) in ACHN and A498 cell lines. C-D: Western blot of γ-H2A.X (96h post indicated treatments) (C) and bar graphs of γ-H2A.X/H3 relative ratio to NT groups (D) in 786–0 SETD2-WT/KO cell lines. E-F: Western blot of γ-H2A.X (96h post indicated treatments) (E) and bar graphs of γ-H2A.X/H3 relative ratio to NT groups (F) in Caki-2 and 769-P cell lines. G-I: Comet assay olive moments relative to NT groups in ACHN and A498 cell lines (G), 786–0 SETD2-WT/KO cell lines (H), Caki-2 and 769-P cell lines(I). J-K: Western blot (J) and fold change bar graphs (K) of HR and NHEJ repair pathway proteins (CtIP, RPA32, RAD51 for HR and Ku70 for NHEJ) in 786–0 SETD2-WT/KO cell lines (96h post indicated treatments). Bar graph values are presented as mean ± SEM of three independent experiments. Comet assay has 70–200 randomly chosen cells detected per treatment group. Two-tailed unpaired t-test was used to calculate statistical significance. * p<0.05, ** p<0.01, *** p<0.001, **** p<0.0001.
Figure 3.
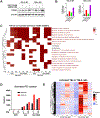
Figure 3.. Combination treatment activates immune response and loss of SETD2 enhanced the promotion of TE expression.
A-B: Western blot (A) and fold change bar graphs (B) of STING expression in 786–0 SETD2-WT/KO cell lines (96h post indicated treatments). C: Normalized enrichment score (NES) heatmap of the top 20 up-regulated GSEA gene ontology (GO) Biological Process (BP) pathways in 786–0 SETD2-WT/KO cells on days 5, 16 and 26 after combination treatment with 100nM DAC and/or 10nM BMN-673. D-E: Activated transposable element (TE) number (D) and Z-score heatmap representation (logFC>1 compared to NT groups) (E) in 786–0 SETD2-WT/KO cells on day 5, 16 and 26 after combination treatment with 100nM DAC 100nM and 10nM BMN-673).
Figure 4.
Figure 4.. Genomic stability related pathways and H1 linker genes are specifically down-regulated in SETD2-KO 786–0 cells after combination treatment.
A: Normalized enrichment score (NES) heatmap of the top 20 down-regulated GSEA gene ontology (GO) Biological Process (BP) pathways of 786–0 SETD2-WT/KO cell lines on days 5, 16 and 26 after the indicated treatments (100nM DAC and/or 10nM BMN-673). B: GSEA plots of down-regulated pathways, nucleosome assembly (GO:0006334, blue), nucleosome organization (GO:0034728, purple), DNA replication-dependent chromatin organization (GO:0034723, green) and chromatin assembly (GO:0031497, red), of 786–0 SETD2-WT/KO cells on day 5 after a one-time combination treatment of 100nM DAC + 10nM BMN-673. C: Volcano plots of genes involved in down-regulated pathway, nucleosome assembly (GO:0006334), of 786–0 SETD2-WT/KO cell lines on day 5 after a one time indicated treatment of 100nM DAC 100nM and 10nM BMN-673.
Figure 5.
Figure 5.. Identification of target genes after DAC and BMN-673 combination treatment in primary ccRCC tumors.
A: Bar graph of up- and down-regulated genes in low/mut-SETD2 patients from TCGA ccRCC data. B: Dot-plots (left panel) and bar graphs (right panel) of the genes up-regulated in low/mut-SETD2 patients but are reversely expressed in 786–0 SETD2 KO cells at day 5 after treatment with 100nM DAC 100nM and/or 10nM BMN-673. C: Dot-plots (left panel) and bar graphs (right panel) of the genes down-regulated in low/mut-SETD2 patients but are reversely expressed in 786–0 SETD2 KO cells at day 5 after the indicated treatments (100nM DAC 100nM and/or 10nM BMN-673). D: Bar graphs of up- and down-regulated genes in high-SETD2 patients from the TCGA database. E: Dot-plots (left panel) and bar graphs (right panel) of the genes up-regulated in SETD2-high patients that display reverse expression in 786–0 SETD2 WT cells at day 5 after the treatments with 100nM DAC 100nM and/or 10nM BMN-673. F: Dot-plots (left panel) and bar graphs (right panel) of the genes down-regulated in SETD2-high patients but display reverse expression in 786–0 SETD2 WT cells at day 5 after treatment with 100nM DAC 100nM and/or 10nM BMN-673.
Figure 6.
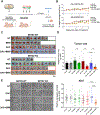
Figure 6.. SETD2 loss sensitizes RCC tumors to DAC and BMN-673 combination therapy in vivo.
A: Experimental design of DAC (0.5mg/kg, 3 times/wk, i.p.) and BMN-673 (0.3mg/kg, 3 times/wk, i.p.) treatment of 786–0 SETD2-WT/KO tumors in nude mice. B: Percentage of body weight change of mice in each group from the start of treatment. C: Original tumor images of xenografts at treatment endpoint. D: Relative tumor sizes (compared to NT groups) of 786–0 SETD2-WT/KO xenografts upon indicated drug treatments. E: Representative immunohistochemistry (IHC) images (left panel) and bar graph of Ki67 expression (right panel) in 786–0 SETD2-WT/KO xenografts. Bar graph values are presented as mean ± SEM. A two-tailed unpaired t-test was used to calculate statistical significance. * p<0.05, ** p<0.01, *** p<0.001, **** p<0.0001.

Comment in

References

    1. Bhatt JR, Finelli A. Landmarks in the diagnosis and treatment of renal cell carcinoma. Nat Rev Urol 2014;11:517–25 - PubMed
    1. Cancer Genome Atlas Research N. Comprehensive molecular characterization of clear cell renal cell carcinoma. Nature 2013;499:43–9 - PMC - PubMed
    1. Xie Y, Sahin M, Sinha S, Wang Y, Nargund AM, Lyu Y, et al. SETD2 loss perturbs the kidney cancer epigenetic landscape to promote metastasis and engenders actionable dependencies on histone chaperone complexes. Nat Cancer 2022;3:188–202 - PMC - PubMed
    1. Ho TH, Park IY, Zhao H, Tong P, Champion MD, Yan H, et al. High-resolution profiling of histone h3 lysine 36 trimethylation in metastatic renal cell carcinoma. Oncogene 2016;35:1565–74 - PMC - PubMed
    1. Santos VE, da Costa WH, Bezerra SM, da Cunha IW, Nobre JQC, Brazao ES Jr., et al. Prognostic Impact of Loss of SETD2 in Clear Cell Renal Cell Carcinoma. Clin Genitourin Cancer 2021;19:339–45 - PubMed

Publication types

Substances