. 2023 Nov 15;83(22):3739-3752.
doi: 10.1158/0008-5472.CAN-22-2679.

Oncogenic KRASG12D Reprograms Lipid Metabolism by Upregulating SLC25A1 to Drive Pancreatic Tumorigenesis

Affiliations

Oncogenic KRASG12D Reprograms Lipid Metabolism by Upregulating SLC25A1 to Drive Pancreatic Tumorigenesis

Ruowen Zhang et al. Cancer Res. .

Abstract

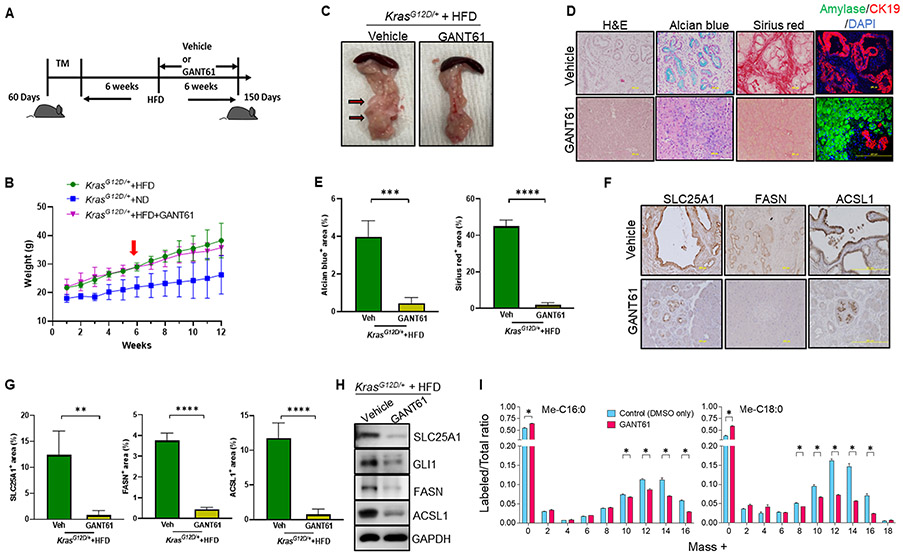
Pancreatic cancer is a highly lethal disease with obesity as one of the risk factors. Oncogenic KRAS mutations are prevalent in pancreatic cancer and can rewire lipid metabolism by altering fatty acid (FA) uptake, FA oxidation (FAO), and lipogenesis. Identification of the underlying mechanisms could lead to improved therapeutic strategies for treating KRAS-mutant pancreatic cancer. Here, we observed that KRASG12D upregulated the expression of SLC25A1, a citrate transporter that is a key metabolic switch to mediate FAO, fatty acid synthesis, glycolysis, and gluconeogenesis. In genetically engineered mouse models and human pancreatic cancer cells, KRASG12D induced SLC25A1 upregulation via GLI1, which directly stimulated SLC25A1 transcription by binding its promoter. The enhanced expression of SLC25A1 increased levels of cytosolic citrate, FAs, and key enzymes in lipid metabolism. In addition, a high-fat diet (HFD) further stimulated the KRASG12D-GLI1-SLC25A1 axis and the associated increase in citrate and FAs. Pharmacologic inhibition of SLC25A1 and upstream GLI1 significantly suppressed pancreatic tumorigenesis in KrasG12D/+ mice on a HFD. These results reveal a KRASG12D-GLI1-SLC25A1 regulatory axis, with SLC25A1 as an important node that regulates lipid metabolism during pancreatic tumorigenesis, thus indicating an intervention strategy for oncogenic KRAS-driven pancreatic cancer.

Significance: Upregulation of SLC25A1 induced by KRASG12D-GLI1 signaling rewires lipid metabolism and is exacerbated by HFD to drive the development of pancreatic cancer, representing a targetable metabolic axis to suppress pancreatic tumorigenesis.


Figures

Figure 1.
Figure 1.. Oncogenic KRAS upregulates SLC25A1 expression in the pancreas
(A) H&E staining, Alcian blue staining, and IHC staining of α-SMA and SLC25A1 on pancreatic tissue sections of fElasCreERT and KrasG12D/+ mice (n=5) (200x). (B) Quantitation of Alcian blue, α-SMA, and SLC25A1 levels in 1A. (C) Western blot analysis of SLC25A1 in the pancreata of fElasCreERT and KrasG12D/+ mice (n=3). (D) qRT-PCR analysis of Slc25a1 gene expression in the pancreata of fElasCreERT and KrasG12D/+ mice (n=5). (E) Western blot analysis of SLC25A1 in HPDE cells and pancreatic cancer BxPC3, MIA PaCa-2, AsPC1, PANC1, SW1990, and Su.86.86 cells. (F) Citrate levels of pancreatic tissues from fElasCreERT and KrasG12D/+ mice. (G) Cytoplasmic to mitochondrial citrate ratio of pancreatic tissue from fElasCreERT and KrasG12D/+ mice. (H) IHC staining of FASN, ACSL1, CPT1, and CPT2 on pancreatic sections of fElasCreERT and KrasG12D/+ mice (n=5) (200x). (I) Quantitation of FASN, ACSL1, CPT1, and CPT2 levels in 1H. Bars were expressed as means ± SD and Results were statistically evaluated with t-test. **, p<0.01; ***, p<0.001; ****, p<0.0001.
Figure 2.
Figure 2.. KRASG12D increases SLC25A1 expression by activating GLI1
(A) Consensus GLI1 binding site in SLC25A1 promoter. The reported consensus GLI1 binding site is GACCACCCA. The putative GLI1 binding site was identified in SLC25A1 promoter. P1 primers (red) are designed to flank the putative GLI1 binding sequence, while P2 primers (green) are designed for detecting negative binding as a control. The length of the detected fragment, including the binding site, is 0.2 kb. (B) Correlative expression of GLI1 and SLC25A1 in 179 pancreatic adenocarcinoma tissues based on GEPIA analysis of PAAD dataset. The correlation coefficient was calculated by Spearman's rank for R=0.66. (C) PANC1 cells were used for a ChIP assay after GLI1 immunoprecipitation, with primers that flanked the putative GLI1 binding sequence (P1) and non-binding sites (P2). The enrichment was assayed by qRT-PCR. Also, the RT-PCR products at the end of 40 cycles were analyzed by agarose gel electrophoresis (bottom). (D) IHC staining of GLI1 on pancreatic tissue sections of fElasCreERT and KrasG12D/+ mice (n=5) (400x). (E) Quantitation of GLI1 level in 2D. (F) Western blot analysis of GLI1 in the pancreata of fElasCreERT and KrasG12D/+ mice (n=3). (G) qRT-PCR of GLI1 in the pancreata of fElasCreERT and KrasG12D/+ mice (n=5). (H) Western blot analysis of GLI1 in HPDE cells and pancreatic cancer BxPC3, MIA PaCa-2, AsPC1, PANC1, SW1990, and Su.86.86 cells using the stripped membrane from Figure 1E. β-Actin loading control is the same as in Figure 1E. (I) Western blot analysis of GLI1 in cytosol and nucleus of HPDE, ASPC1, and PANC1 cells. (J) PANC1 cells with or without GANT61 treatment at indicated concentrations for 72 hours and then the cells were harvested to isolate mRNA. The mRNA of SLC25A1 was analyzed by qRT-PCR. (K) PANC1 cells were treated with different concentrations of GANT61 for 72 hours and the cell lysates were subjected to Western blot for SLC25A1, GLI1, FASN, and ACSL1. (L) PANC1 cells were treated with 20μM of GANT61 for 4 hours and the cells were collected for GLI1 ChIP assay with primers that flanked the putative GLI binding sequence. The results were analyzed by qPCR. PCR products were analyzed by agarose gel electrophoresis (bottom). (M) Western blot analysis of the levels of GLI1 and SLC25A1 in WT (wild type) and GLI1 knockout AsPC1 cells. (N) Representative image (left) and quantification (right) of Transwell migration assays in WT and GLI1 knockout AsPC1 cells. (O) Representative image (left) and quantification (right) of Transwell migration assays in AsPC1 cells treated with or without GANT61 (30 μM). Results were expressed as mean ± SD and statistically evaluated with a t-test. ns, not significant; *, p<0.05; **, p<0.01; ****, p<0.0001.
Figure 3.
Figure 3.. HFD challenge stimulates the KRAS-GLI1 axis to induce SLC25A1 expression
(A) H&E staining and IHC staining of vimentin in pancreatic tissue sections of KrasG12D/+ mice fed with ND or high HFD (n=5) (200x). (B) Quantitation of vimentin level in 3A. (C) IHC staining of GLI1 (400X) and SLC25A1 (200X) on pancreatic tissue sections of KrasG12D/+ mice fed with ND or HFD (n=5). (D) Quantitation of GLI1 and SLC25A1 levels in 3C. (E) Western blot analysis for SLC25A1 and GLI1 in the pancreata of KrasG12D/+ mice fed with ND or HFD (n=3). (F) qRT-PCR analysis of Slc25a1 gene expression in the pancreata of KrasG12D/+ mice fed with ND or HFD (n=5). (G) IHC stains of ACSL1 (200X) and FASN (200X) on pancreatic tissue sections of KrasG12D/+ mice fed with ND or HFD (n=5). (H) Quantitation of ACSL1 and FASN levels in 3G. (I) Western blot analysis of FASN and ACSL1 in the pancreata of fElasCreERT and KrasG12D/+ mice fed with ND or HFD. (J&K) Total citrate and fatty acid levels in pancreatic tissues from KrasG12D/+ mice fed with ND or HFD. Results were expressed as mean ± SD and statistically evaluated with a t-test.**, p<0.01; ***, p<0.001; ****, p<0.0001.
Figure 4.
Figure 4.. Inhibition of GLI1 alleviates pancreatic precancerous lesions by decreasing SLC25A1 expression in KrasG12D/+ mice
(A) Experimental scheme for B-H: 60-day-old male and female ND-fed KrasG12D/+ mice were treated with TM to induce KRASG12D expression in pancreatic acinar cells. These mice were fed HFD for six weeks and then randomly separated into two groups with one group fed HFD with vehicle (n=5) and another group of mice fed with HFD plus GANT61 treatment (i.p. twice per week at 50 mg/kg/time) (n=4) for six weeks. The mice were analyzed at the age of 150 days. (B) Body weight of the KrasG12D/+ mice with ND (n=5), HFD (n=5), or HFD plus GANT61 treatment (n=4). Treatment started at the sixth week of feeding with HFD, as indicated by a red arrow. (C) Gross images for pancreatic tissues of HFD-fed KrasG12D/+ mice with or without GANT61 treatment. The pancreatic cysts were indicated by red arrows with dark edges. (D) Representative H&E stains of the pancreata, Alcian blue staining of acidic mucins, Sirius red staining of collagens on pancreatic tissue sections, and co-immunofluorescence of pancreatic amylase and CK19 in HFD-fed KrasG12D/+ mice with or without GANT61 treatment (n=5) (200X). (E) Quantitation of Alcian blue and Sirius red staining levels in 4D. (F) IHC staining of SLC25A1 (200X), FASN (200X), and ACSL1 (200X) on pancreatic tissue sections of HFD-fed KrasG12D/+ mice with or without GANT61 treatment (n=5). (G) Quantitation of SLC25A1, FASN, and ACSL1 levels in 4F. (H) Western blot analysis of GLI1, SLC25A1, ACSL1, and FASN in the pancreata of HFD-fed KrasG12D/+ mice with or without GANT61 treatment. Results were expressed as mean ± SD and statistically evaluated with a t-test. **, p<0.01; ***, p<0.001; ****, p<0.0001. (I) De novo fatty acid synthesis from glucose is decreased in PANC1 cells following GANT61 treatment. U-13C6-glucose metabolic tracing profile for methyl-palmitate (Me-C16:0) and methyl-stearate (Me-C18:0) chain elongation in PANC1 cells after treatment with either 0.13% DMSO (Control; n=3) or GANT61 (30 μM, also dissolved in 0.13% DMSO; n=2) for 24 h. Free fatty acids were extracted by organic solvents, derivatized as fatty acid methyl esters (FAMEs), and analyzed by GC-MS. The intensity of the endogenous U-12C-Me-C16:0 (M+0) and U-12C-Me-C18:0 (M+0) and the metabolically labeled 13C-isotopomers of Me-C16:0 (M+2 – M+16) and Me-18:0 (M+2 – M+18) are indicated. The ratio of labeled over the total (unlabeled + labeled) was calculated. Results were expressed as mean ± SEM, and statistically analyzed by the multiple unpaired Student t-test with Welch correction. *, p<0.05.
Figure 5.
Figure 5.. Inhibition of SLC25A1 suppresses HFD-induced acinar cell damage and pancreatic precancerous lesions in KrasG12D/+ mice
(A) Experimental scheme for B-G: 60-day-old ND-fed KrasG12D/+ mice were treated with TM to induce KRASG12D expression in pancreatic acinar cells. These male and female mice were fed with HFD for six weeks and then randomly separated into two groups with one group fed HFD with vehicle (n=5) and another group fed with HFD plus CTPI-2 treatment (i.p. twice per week at 50 mg/kg/time) (n=5) for six weeks. The mice were analyzed at the age of 150 days. (B) Body weight of the KrasG12D/+ mice with ND (n=5), HFD (n=5), or HFD+CTPI-2 treatment (n=5). Treatment started after the sixth week of HFD feeding, as indicated by the red arrow. (C) Gross images of HFD-fed KrasG12D/+ mice and their pancreata with or without CTPI-2 treatment. (D) Lipid droplet staining of pancreatic tissue sections isolated from the HFD-fed KrasG12D/+ mice treatment with or without CTPI-2 by using Oil red O staining and Hematoxylin as counterstain. Scale bar, 50 μm. (E) Quantitation of histological sections stained for lipid droplets and depicted in 5D. (F) Representative H&E staining of pancreatic sections with Alcian blue staining of acidic mucins, Sirius red staining of collagens, and co-immunofluorescence of pancreatic amylase and CK19 in HFD-fed KrasG12D/+ mice with or without CTPI-2 treatment (n=5) (200X). (G) Quantitation of Alcian blue and Sirius red stains in 5F. (H) IHC staining of SLC25A1 (200X), FASN (200X), and ACSL1 (200X) on pancreatic tissue sections of HFD-fed KrasG12D/+ mice with or without CTPI-2 treatment (n=5). (I) Quantitation of SLC25A1, FASN, and ACSL1 levels in 5H. Results were expressed as mean ± SD and statistically evaluated with a t-test. **, p<0.01; ***, p<0.001; ****, p<0.0001.
Figure 6.
Figure 6.. SLC25A1 inhibitor suppressed PDAC development in KrasG12D/+ mice under a long-term HFD challenge
(A) Experimental scheme for B-D: 60-day-old ND-fed KrasG12D/+ mice were treated with TM to induce KRASG12D expression in pancreatic acinar cells. These male and female mice were randomly separated into two groups with one group of mice (n=5) fed with HFD for twelve weeks and pancreatic tissue samples were collected at 150 days of age as indicated by the control group. Another group of mice was fed HFD for twelve weeks and then fed with HFD plus CTPI-2 treatment (i.p. twice per week at 50 mg/kg/time) (n=5) for additional six weeks as indicated by the CTPI-2 group. (B) Gross images of HFD-fed KrasG12D/+ mice with or without CTPI-2 treatment. (C) Representative histology shown by H&E stains, Alcian blue stains, and Sirius red stains on pancreatic tissue sections from the HFD-fed control group and CPTI-2 treatment group (200X). (D) Quantitation of Alcian blue and Sirius red staining levels in 6C. (E) Hypothetical model of the KRAS-GLI1-SLC25A1 axis that regulates lipid metabolism. Oncogenic KRASG12D upregulates SLC25A1 expression by increasing GLI1 transcription. More SLC25A1 exports more citrate from mitochondria to the cytosol for fatty acid synthesis, leading to severe lipid accumulation. Thus, SLC25A1 acts as a nodal transporter to enhance lipid metabolism. Targeted inhibition of the KRASG12D-GLI1-SLC25A1 axis by GANT61 or CTPI-2 could suppress cytosolic citrate and fatty acid accumulation under HFD, therefore hindering pancreatic tumorigenesis. Results were expressed as mean ± SD and statistically evaluated with a t-test. **, p<0.01; ****, p<0.0001.

References

    1. Kenner B, Chari ST, Kelsen D, Klimstra DS, Pandol SJ, Rosenthal M, et al. Artificial Intelligence and Early Detection of Pancreatic Cancer: 2020 Summative Review. Pancreas 2021;50:251–79 - PMC - PubMed
    1. Siegel RL, Miller KD, Fuchs HE, Jemal A. Cancer statistics, 2022. CA: a cancer journal for clinicians 2022;72:7–33 - PubMed
    1. Rozeveld CN, Johnson KM, Zhang L, Razidlo GL. KRAS Controls Pancreatic Cancer Cell Lipid Metabolism and Invasive Potential through the Lipase HSL. Cancer research 2020;80:4932–45 - PMC - PubMed
    1. Xu M, Jung X, Hines OJ, Eibl G, Chen Y. Obesity and Pancreatic Cancer: Overview of Epidemiology and Potential Prevention by Weight Loss. Pancreas 2018;47:158–62 - PMC - PubMed
    1. Eibl G, Cruz-Monserrate Z, Korc M, Petrov MS, Goodarzi MO, Fisher WE, et al. Diabetes Mellitus and Obesity as Risk Factors for Pancreatic Cancer. Journal of the Academy of Nutrition and Dietetics 2018;118:555–67 - PMC - PubMed

Publication types