. 2024 May 27;73(1):223-234.
doi: 10.1093/sysbio/syad057.

Two Notorious Nodes: A Critical Examination of Relaxed Molecular Clock Age Estimates of the Bilaterian Animals and Placental Mammals

Affiliations

Two Notorious Nodes: A Critical Examination of Relaxed Molecular Clock Age Estimates of the Bilaterian Animals and Placental Mammals

Graham E Budd et al. Syst Biol. .

Abstract

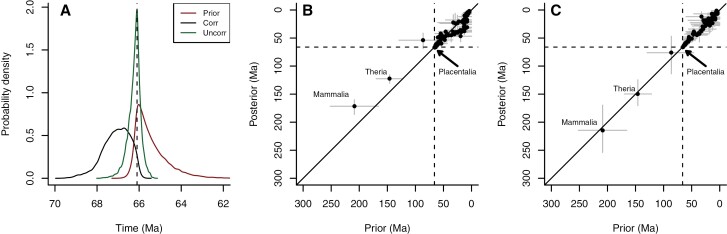
The popularity of relaxed clock Bayesian inference of clade origin timings has generated several recent publications with focal results considerably older than the fossils of the clades in question. Here, we critically examine two such clades: the animals (with a focus on the bilaterians) and the mammals (with a focus on the placentals). Each example displays a set of characteristic pathologies which, although much commented on, are rarely corrected for. We conclude that in neither case does the molecular clock analysis provide any evidence for an origin of the clade deeper than what is suggested by the fossil record. In addition, both these clades have other features (including, in the case of the placental mammals, proximity to a large mass extinction) that allow us to generate precise expectations of the timings of their origins. Thus, in these instances, the fossil record can provide a powerful test of molecular clock methodology, and why it goes astray, and we have every reason to think these problems are general. [Cambrian explosion; mammalian evolution; molecular clocks.].


Conflict of interest statement

The authors have no competing interests to declare.

Figures

Figure 1.
Figure 1.
The uniform calibration densities (blue) and subsequent effective priors (red) were used in dos Reis et al. (2015). The oldest fossil used for setting the youngest soft limit is marked with a blue dot; the dashed line is 20 myr older than this fossil in each case. Note that the Lantian biota, used as a soft maximum age for three of these nodes, has recently been dated to be c. 602 ± 8 Ma (Yang et al. 2022). Note that in each case, the effective prior typically assigns little probability to dates near the oldest fossil, or even to dates 20 myr older than it.
Figure 2.
Figure 2.
Prior–posterior plots for the analysis of dos Reis et al. (2015) on the origin of the animals, using uniform calibration ranges with independent rates. Each point represents a node in the phylogeny with its associated 95% HDP range. The dashed lines in this case represent the soft maximum age for the Metazoa (i.e. the root of the tree). a) The focal analysis of dos Reis et al. (2015) setting the soft maximum age at c. 833 Ma. b) A reanalysis setting the soft maximum age at 580 Ma, that is, just before the oldest Ediacaran assemblages (Matthews et al. 2021).
Figure 3.
Figure 3.
a) Calibration to effective prior conversion in the analysis of mammal origins of Álvarez-Carretero et al. (2022). Dashed line: K-Pg boundary; blue: uniform calibration range with soft limits; blue dot, oldest fossil; red: effective prior. b) The youngest 300 of one million samples of the effective prior, showing the vanishingly low probability of an appearance close to or after the K-Pg boundary. c) The effective prior and posterior distributions for the placental mammals from Álvarez-Carretero et al. (2022). Note that, in this case, the posterior lies far outside the prior distribution. d) The prior–posterior plot for the entire analysis (72 taxa). Note that the nodes close to the placentals trend off the prior–posterior equivalence line, a probable result of the very deep placental prior; the large gap between the Theria and the placentals, and the large number of nodes constrained by their priors to lie after the K-Pg boundary (dashed line). e) The “short” truncated Cauchy prior of Álvarez-Carretero et al. (2022) (red) plotted together with the prior of the focal analysis (blue). Note that when zoomed in f) the Cauchy prior can be seen to assign more probability than the focal prior for ages as deep as c. 93 Ma (red arrow), older than any of the posteriors.
Figure 4.
Figure 4.
The focal analysis of Álvarez-Carretero et al. (2022), rerun with a uniform calibration density on the age of the placentals down to the K-Pg boundary, with soft limits. a) The effective prior and the posteriors for uncorrelated and autocorrelated runs for the placental node. b) prior–posterior plot for the mammals run with an autocorrelated rate model. c) Prior–posterior plot for the mammals run with an uncorrelated log-normal rates model. Note that under such conditions, the posteriors return to plotting broadly along the 1:1 prior–posterior line and that the molecular evidence provides no compelling evidence for a pre-K-Pg boundary emergence of the placentals.
Figure 5.
Figure 5.
a) The central LTT plot of Álvarez-Carretero et al. (2022) for 72 taxa, showing the origin of the crown-group placentals. Note that in their dating, the LTT plot passes unperturbed through the K-Pg boundary, despite the very high rates of mammalian extinction at that point. (b–e) Birth–death models and mass extinctions. Here, a clade commencing at c. 130 Ma, and diversifying to give rise to c. 4000 living species with a background extinction rate of 0.5/myr passes through a mass extinction of 95% at 66 Ma. b) The probability of the crown group forming through time. c) The LTT plot when the crown group emerges at c. 125 Ma (the blue dot indicates the oldest possible crown-group fossil age). d) The same, but for an emergence at the focal time of Álvarez-Carretero et al. (2022). e) The same, but for crown-group emergence just after the mass extinction. Note that, in each case, the LTT plot has a distinct inflection at the point of extinction, reflecting the difficulty of coalescence back through a mass extinction.
Figure 6.
Figure 6.
Heat maps for placental diversification for each of the three scenarios in Figure 5. White dashed line: time of crown-group origin; red dashed line, mass extinction. Note that in both the upper and middle scenarios, significant crown-group diversity should be expected in the Cretaceous, with, in the focal analysis of Álvarez-Carretero et al. (2022), approximately one third of total late-Cretaceous diversity being crown group, and with a total of several hundred species being expected during this interval of time. Conversely, the bottom scenario, with the crown group emerging just after the boundary, matches the known fossil record well.

References

    1. Alroy J. 1999. The fossil record of North American mammals: evidence for a paleocene evolutionary radiation. Syst. Biol. 48:107–118. - PubMed
    1. [dataset]Álvarez-Carretero S., Tamuri A., Battini M., Nascimento F.F., Carlisle E., Asher R., et al.. 2021. Data for “A species-level timeline of mammal evolution integrating phylogenomic data”. Figshare. 10.6084/m9.figshare.14885691.v1. - DOI - PubMed
    1. Álvarez-Carretero S., Tamuri A.U., Battini M., Nascimento F.F., Carlisle E., Asher R.J., Yang Z., Donoghue P.C.J., dos Reis M.. 2022. A species-level timeline of mammal evolution integrating phylogenomic data. Nature 602:263–267. - PubMed
    1. Barba-Montoya J., dos Reis M., Yang Z.. 2017. Comparison of different strategies for using fossil calibrations to generate the time prior in Bayesian molecular clock dating. Mol. Phylogenet. Evol. 114:386–400. - PMC - PubMed
    1. Barba-Montoya J., Dos Reis M., Schneider H., Donoghue P.C.J., Yang Z.. 2018. Constraining uncertainty in the timescale of angiosperm evolution and the veracity of a Cretaceous terrestrial revolution. New Phytol. 218:819–834. - PMC - PubMed