. 2023 Sep 19;120(38):e2308187120.
doi: 10.1073/pnas.2308187120. Epub 2023 Sep 11.

Transgenic expression of the HERV-W envelope protein leads to polarized glial cell populations and a neurodegenerative environment

Affiliations

Transgenic expression of the HERV-W envelope protein leads to polarized glial cell populations and a neurodegenerative environment

Joel Gruchot et al. Proc Natl Acad Sci U S A. .

Abstract

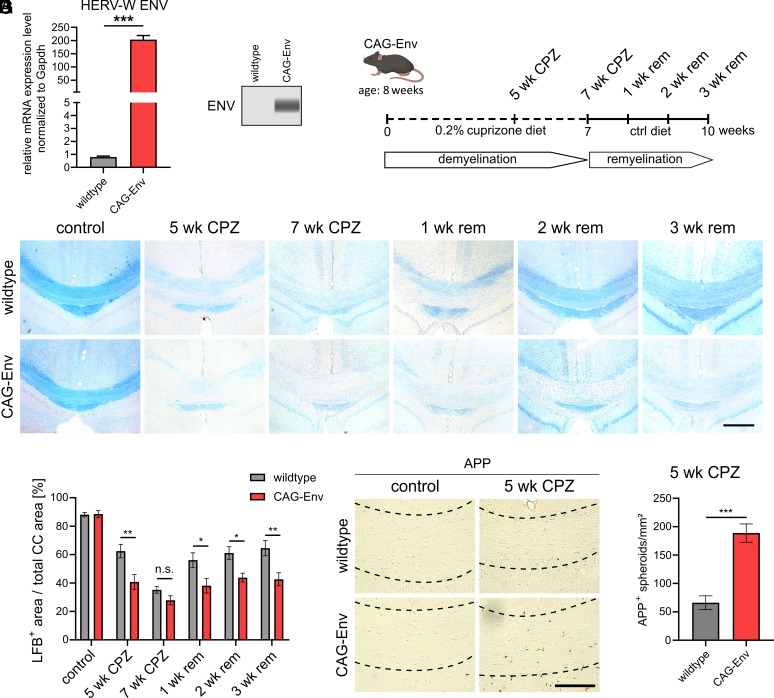
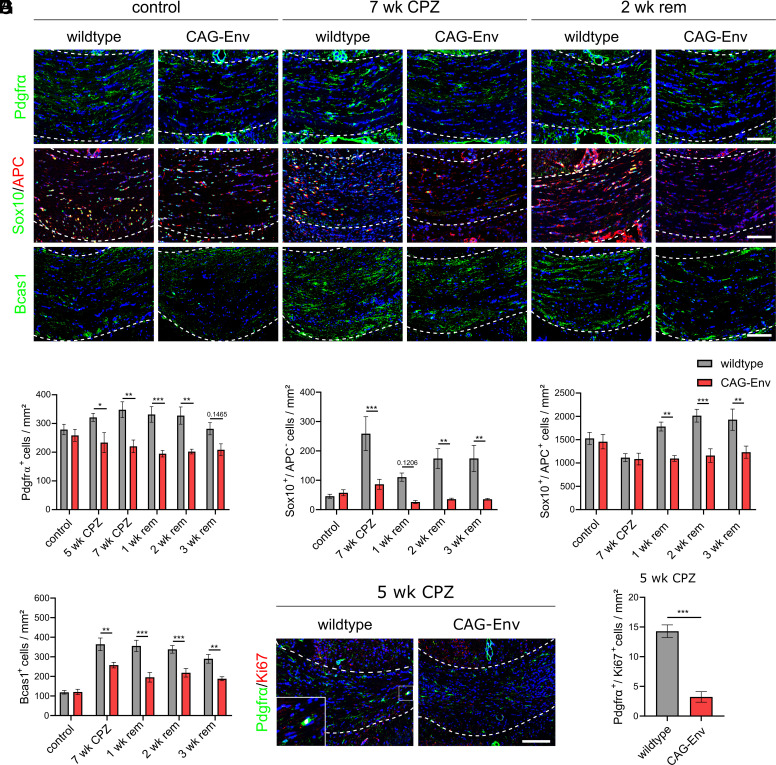
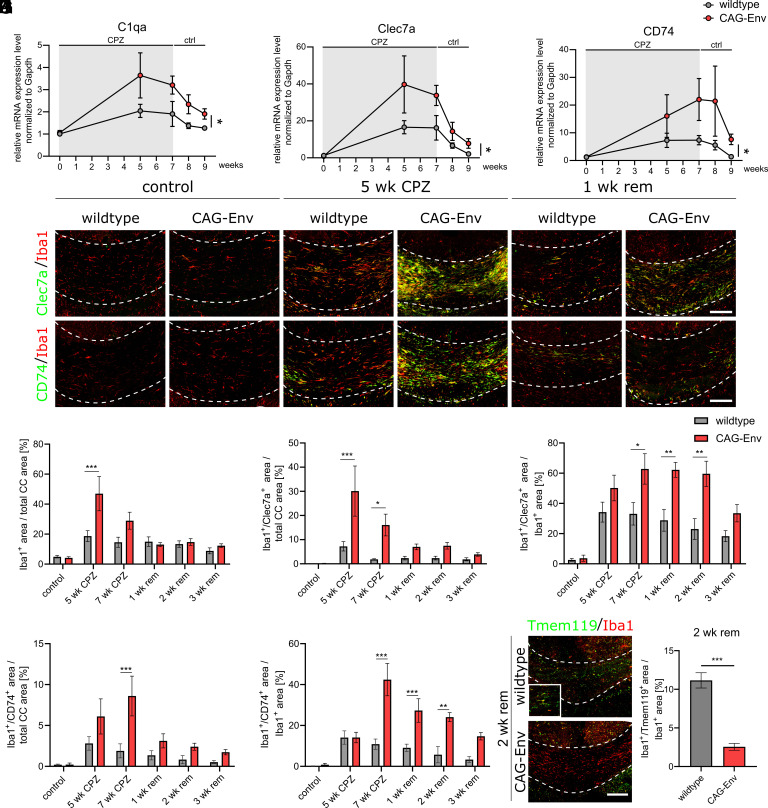
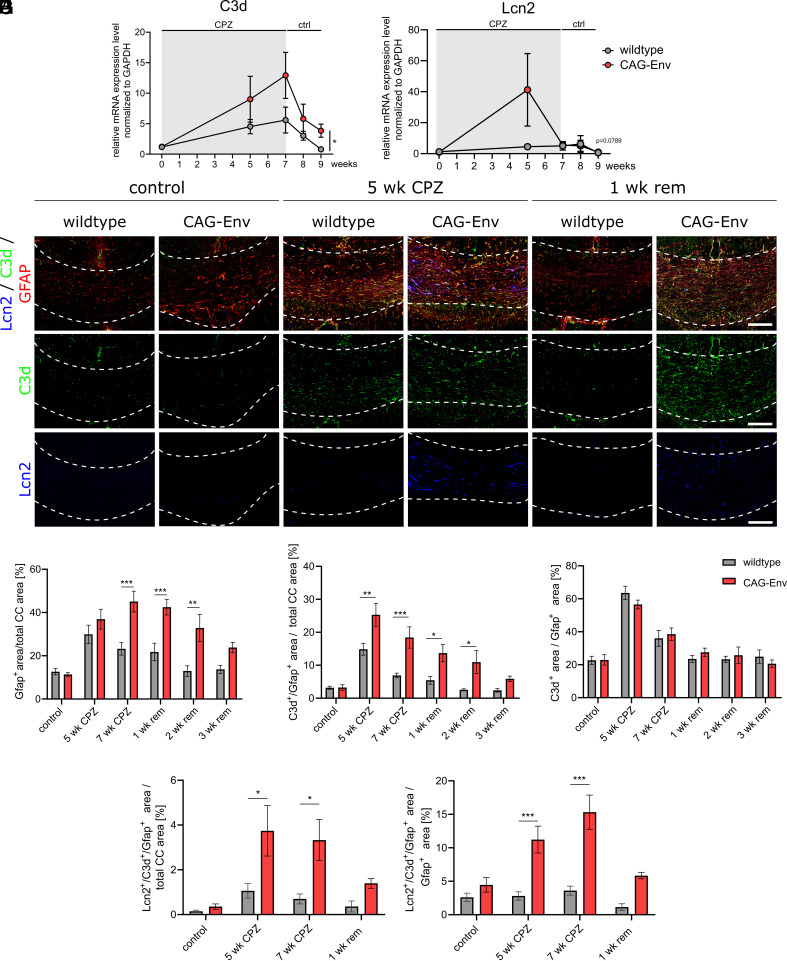
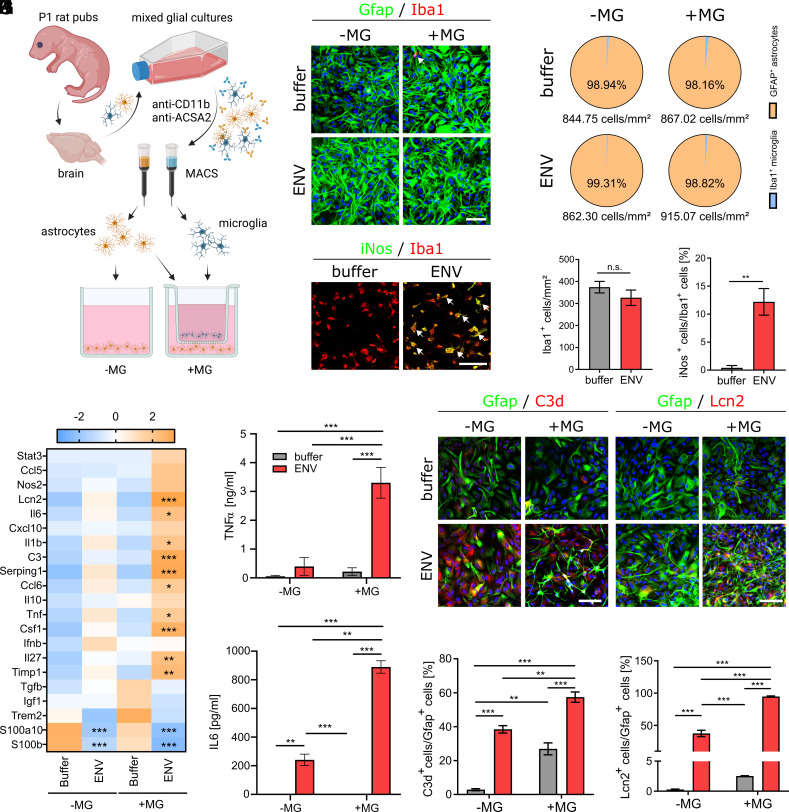
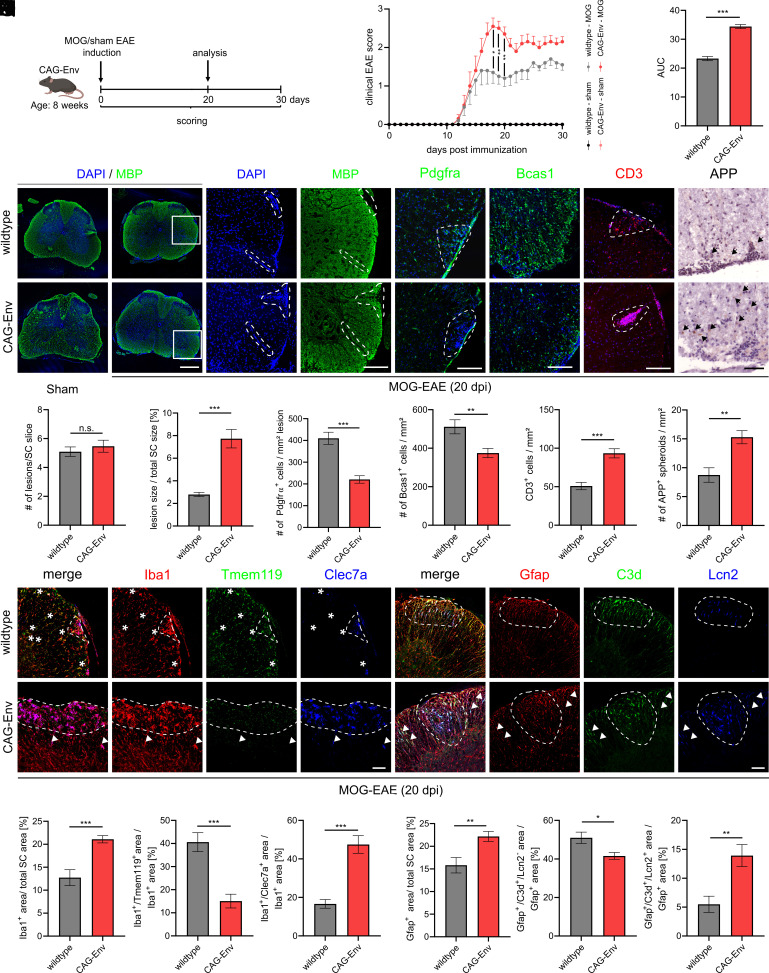
The human endogenous retrovirus type W (HERV-W) has been identified and repeatedly confirmed as human-specific pathogenic entity affecting many cell types in multiple sclerosis (MS). Our recent contributions revealed the encoded envelope (ENV) protein to disturb myelin repair by interfering with oligodendroglial precursor differentiation and by polarizing microglial cells toward an axon-damage phenotype. Indirect proof of ENV's antiregenerative and degenerative activities has been gathered recently in clinical trials using a neutralizing anti-ENV therapeutic antibody. Yet direct proof of its mode of action can only be presented here based on transgenic ENV expression in mice. Upon demyelination, we observed myelin repair deficits, neurotoxic microglia and astroglia, and increased axon degeneration. Experimental autoimmune encephalomyelitis activity progressed faster in mutant mice equally accompanied by activated glial cells. This study therefore provides direct evidence on HERV-W ENV's contribution to the overall negative impact of this activated viral entity in MS.

Keywords: endogenous retrovirus; glia; multiple sclerosis; myelin repair; neurodegeneration.


Conflict of interest statement

P.K. was supported by Stifterverband/Novartisstiftung and received consulting/travel/congress grants from GeNeuro, Sanofi and Servier. H.-P.H. has received fees for consulting, speaking and serving on steering committees from Bayer Healthcare, Biogen, GeNeuro, MedImmune, Merck, Novartis, Opexa, Receptos Celgene, Roche, Sanofi Genzyme, CSL Behring, Octapharma and Teva, with approval from the Rector of HHU. J.G. was supported by Stifterverband/Novartisstiftung and received travel expenses for attending meetings from GeNeuro. B.C. and H.P. receive compensation from GeNeuro-Innovation for their work. All authors declare that the research was conducted in the absence of any commercial or financial relationships that could be construed as a potential conflict of interest.

Figures

Fig. 1.
Fig. 1.
Transgenic HERV-W ENV expression fosters demyelination and alters remyelination upon CPZ treatment. (A) Determination of the relative ENV transcript levels normalized to Gapdh in whole-brain lysates of wt and CAG-Env transgenic mice. (B) Automated western blot analysis of whole-brain lysates detecting HERV-W ENV protein in transgenic mice. (C) Schematic presentation of CPZ demyelination and remyelination experiments. (D) Representative images of LFB-stained control and CPZ-challenged wt and transgenic tissue sections encompassing the caudal corpus callosum (corpus callosum) at time points 5 and 7 wk of CPZ treatment and at 1, 2, and 3 wk during remyelination. (E) Quantification of the percentage of LFB-positive, myelinated area of the corpus callosum. (F) Representative images of anti-APP stained wt and CAG-Env corpus callosum tissue sections at 5 wk of demyelination. (G) Quantification of APP-positive spheroid densities in the corpus callosum of wt and transgenic animals. Data are presented as mean values (A and B: n = 3; EH: n = 6) ± SEM. Significance of HERV-W ENV mRNA levels as well as APP-positive spheroids were assessed by Student’s t test and the significance of the relative LFB-positive areas was accessed by 2-way ANOVA followed by Sidak’s post hoc. Data were considered as statistically significant (95% CI) at *P < 0.05, **P < 0.01, ***P < 0.001. n.s. = not significant. CC = corpus callosum. (Scale bar in E: 250 µm, scale bar in G: 100 µm.)
Fig. 2.
Fig. 2.
Transgenic HERV-W ENV expression affects oligodendroglial differentiation. (A) Representative immunohistochemical images of Pdgfrα-, Sox10/APC- and Bcas1- expression in unchallenged animals (wt and CAG-Env mice), after 7 wk of CPZ treatment and after 2 wk of CPZ withdrawal (2 wk rem). (B) Quantification of Pdgfrα-positive cell densities in the corpus callosum of control vs. CPZ-treated animals. (C) Quantification of Sox10-positive, APC-negative cell densities in the corpus callosum of control vs. CPZ-treated animals. (D) Quantification of Sox10/APC double-positive maturing oligodendroglial cell densities in the corpus callosum of control vs. CPZ-treated mice. (E) Quantification of Bcas1-positive myelinating oligodendrocyte densities in the corpus callosum of control vs. CPZ-treated animals. (F) Representative immunohistochemical pictures of Pdgfrα/Ki67-coexpressing cells in the corpus callosum of wt vs. CAG-Env mice at 5 wk of CPZ treatment. (G) Quantification of Ki67-positive proliferating OPCs in wt vs. CAG-Env corpus callosum tissues after 5 wk of CPZ diet. Data are presented as mean values (n = 6) ± SEM. Significance of Ki67-positive OPCs was analyzed by Student’s unpaired t test, whereas all other significances were accessed by 2-way ANOVA followed by Sidak’s post hoc test (95% CI) at *P < 0.05, **P < 0.01, ***P < 0.001. Dashed lines indicate the area of corpus callosum. (Scale bar: 100 µm.)
Fig. 3.
Fig. 3.
Transgenic HERV-W ENV expression activates microglial cells upon CPZ treatment. (AC)C1qa, Clec7A, and CD74 gene expression analysis in the corpus callosum before and during CPZ treatment in wt vs. transgenic CAG-Env mice. (D) Representative immunohistochemical pictures of Clec7a/Iba1- and CD74/Iba1 coexpressing cells in wt and transgenic corpus callosum tissues (unchallenged and CPZ-treated animals). (E) Quantification of the Iba1-positive area over the total corpus callosum area in control vs. CPZ-treated wt and CAG-Env mice. (F) Quantification of Clec7a/Iba1 double-positive areas over total corpus callosum areas in wt and transgenic CAG-Env mice (control- and under CPZ diet). (G) Quantification of the proportion of Clec7a-positive microglia in wt and transgenic mice (control and under CPZ diet). (H) Quantification of CD74-positive microglial vs. total corpus callosum areas in wt and CAG-Env mice (control and under CPZ diet). (I) Quantification of the proportion of CD74-positive microglia in wt and transgenic mice (control- and under CPZ diet). (J) Representative immunohistochemical images of Tmem119/Iba1 coexpressing cells in wt and transgenic corpus callosum tissues at 2 wk of remyelination. (K) Quantification of the proportion of Tmem119-positive microglia in wt and transgenic mice at 2 wk of remyelination. Data are presented as mean values (n = 6) ± SEM. Significance of gene expression analysis was assessed by a Student’s unpaired t test of calculated AUCs whereas statistical significance of histological data was analyzed via 2-way ANOVA followed by Sidak’s post hoc test. Data were considered as statistically significant (95% CI) at *P < 0.05, **P < 0.01, ***P < 0.001. CC = corpus callosum. Dashed lines in (D and J) demarcate the corpus callosum. (Scale bar in D and J: 100 µm.)
Fig. 4.
Fig. 4.
Transgenic expression of HERV-W ENV activates astrocytes. (A and B) C3d and Lcn2 expression gene expression analysis at various time points, before, during and after CPZ treatment in wt vs. transgenic CAG-Env mice. (C) Representative immunohistochemical images of C3d-, Lcn2- and Gfap- (co)expressing cells in wt and transgenic corpus callosum tissue sections (control and CPZ treated). (D) Quantification of Gfap-positive areas within the corpus callosum of wt and CAG-Env mice (control and CPZ treated). (E) Quantification of C3d/Gfap double-positive areas within the corpus callosum of wt and CAG-Env mice (control and CPZ treated). (F) Relative proportion of C3d/Gfap double-positive astrocytic areas in wt and CAG-Env animals (control- and CPZ treated). (G) Analysis of Lcn2/C3d/Gfap triple-positive astrocytic areas with the corpus callosum of wt and transgenic mice (control and CPZ treated). (H) Relative proportion of Lcn2/C3d/Gfap triple-positive astrocytic areas within the corpus callosum of transgenic and control mice upon CPZ treatment. Data are presented as mean values (n = 6) ± SEM. Significance of gene expression analysis was assessed by Student’s unpaired t test of calculated AUCs whereas the statistical significance of histological data was analyzed via 2-way ANOVA followed by Sidak’s post hoc test. Data were considered as statistically significant (95% CI) at *P < 0.05, **P < 0.01, ***P < 0.001. CC = corpus callosum. Dashed lines in C demarcate the area of the corpus callosum. (Scale bar in C: 100 µm.)
Fig. 5.
Fig. 5.
HERV-W ENV protein exposure leads to an activation of astroglial cells, which is amplified by microglia. (A) Schematic presentation of experimental procedure to generate spatially separated primary cultures of microglia and astrocytes (created using BioRender.com). (B) Representative immunocytochemical images of Gfap-positive astrocytes in absence and presence of microglia, treated with buffer or recombinant HERV-W ENV protein for 24 h. (C) Quantification of astrocyte culture purities under all four conditions. (D) Representative immunocytochemical images of microglial cells grown on cell culture inserts expressing Iba1 and iNos. Arrows point to iNos-positive cells. (E and F) Quantification of Iba1-positive and iNos-positive microglia densities upon buffer and ENV protein stimulation after 24 h. (G) Astrocyte gene expression analysis in absence and presence of microglia and in response to buffer or recombinant HERV-W ENV protein treatment after 24 h. Data are presented as z-scores. (H and I) Quantification of sandwich ELISA using media collected in absence and presence of microglia and in response to buffer or recombinant HERV-W ENV protein treatment after 24 h, identifying secreted TNFα (H) and IL-6 (I). (J) Representative immunocytochemical images of C3d and Lcn2 expressing (Gfap-positive astrocytes) under all four conditions and after 24 h. (K and L) Quantification of C3d-positive and Lcn2-positive astrocytes under all four conditions and after 24 h. Data are presented as mean values (n = 3) ± SEM. Significance of microglia analyses (E and F) was assessed by Student’s unpaired t test whereas the significance of qPCR quantifications (G) was assessed using 2-way ANOVA followed by false discovery rate post hoc test. All other quantifications (H, I, K, and L) were analyzed via 2-way ANOVA followed by Sidak’s post hoc test. Data were considered as statistically significant (95% CI) at *P < 0.05, **P < 0.01, ***P < 0.001. (Scale bar: 50 µm.) The arrow in B points to a single Iba1-positive microglial cell. Arrows in D point to iNOS-positive microglial cells.
Fig. 6.
Fig. 6.
Increased microglial and astroglial activation in transgenic mice upon induction of EAE. (A) Schematic representation of EAE experiments. (B) Clinical score of sham- and MOG-induced wt and CAG-Env mice. (C) Determination of AUC values of clinical scores in MOG-induced wt vs. CAG-Env mice. (D) Representative images of anti-MBP, anti-Pdgfrα, anti-Bcas1, anti-CD3 and anti-APP-stained lumbar spinal cord sections of sham vs. MOG-induced wt and transgenic animals (20 dpi). (E and F) Quantification of lesion formation in MOG-induced animals displaying no differences in lesion numbers (E) but increased lesion sizes in CAG-Env mice (F) at 20 dpi. (G) Quantification of lesion-associated Pdgfrα-positive OPCs in wt and CAG-Env animals (20 dpi). (H) Analysis of Bcas1-positive myelinating oligodendrocytes in wt and transgenic animals (20 dpi). (I) Quantification of CD3-positive T cells in wt vs. CAG-Env mice (20 dpi). (J) Analysis of APP-positive spheroids in spinal cords of wt and transgenic animals (20 dpi). (K) Representative images of Iba1- and Clec7a expression patterns in lumbar spinal cords of MOG-induced wt vs. CAG-Env mice (20 dpi) as well as representative images of Gfap-, C3d-, and Lcn2 expression patterns in lumbar spinal cords of MOG-induced wt vs. transgenic animals (20 dpi). (L) Quantification of Iba1-positive areas (over total spinal cord areas) and (M) Tmem119-positive areas (within Iba1-positive areas) as well as (N) of Clec7a-positive areas (within Iba1-positive areas) in MOG-induced wt and CAG-Env mice at 20 dpi. (O) Quantification of Gfap-positive areas (over total spinal cord areas) in wt and CAG-Env mice at 20 dpi. (P) The proportion of C3d-positive but Lcn2-negative astrocytic areas relative to total Gfap-positive areas was reduced in transgenic CAG-Env mice. (Q) On the other hand, the extent of Lcn2/C3d/Gfap-triple-positive areas (within Gfap-positive areas) was significantly increased in transgenic animals at 20 dpi. Data are presented as mean values ± SEM. EAE course (B) was analyzed in n = 10 mice and histological analysis (DQ) was performed in n = 9 animals. Significance of the clinical EAE score (B) was assessed via 2-way ANOVA followed by Sidak’s post hoc test and all other data were analyzed by Student’s unpaired t test. Data were considered as statistically significant (95% CI) at *P < 0.05, **P < 0.01, ***P < 0.001. [Scale bar in D (overview): 500 µm; scale bar in (D) (detailed): 200 µm; all other scale bars in D and K: 50 µm.] Dashed lines in (D and K) delineate lesion boundaries and arrowheads point to either Clec7a-positive microglia (K, Left) or Lcn2/C3d-positive astrocytes (K, Right) outside lesions.

References

    1. Reich D. S., Lucchinetti C. F., Calabresi P. A., Multiple sclerosis. N Engl. J. Med. 378, 169–180 (2018). - PMC - PubMed
    1. Lassmann H., Multiple sclerosis pathology. Cold Spring Harb. Perspect. Med. 8, 1–15 (2018). - PMC - PubMed
    1. Perron H., et al. , Leptomeningeal cell line from multiple sclerosis with reverse transcriptase activity and viral particles. Res. Virol. 140, 551–561 (1989). - PubMed
    1. Dolei A., Perron H., The multiple sclerosis-associated retrovirus and its HERV-W endogenous family: A biological interface between virology, genetics, and immunology in human physiology and disease. J. Neurovirol. 15, 4–13 (2009). - PubMed
    1. Perron H., et al. , Human endogenous retrovirus protein activates innate immunity and promotes experimental allergic encephalomyelitis in mice. PLoS One 8, e80128 (2013). - PMC - PubMed

Publication types