. 2024;17(1):107-117.
doi: 10.1016/j.jcmgh.2023.08.014. Epub 2023 Sep 9.

Schistosoma mansoni-Induced Oxidative Stress Triggers Hepatocellular Proliferation

Affiliations

Schistosoma mansoni-Induced Oxidative Stress Triggers Hepatocellular Proliferation

Verena von Bülow et al. Cell Mol Gastroenterol Hepatol. 2024.

Abstract

Background & aims: Schistosomiasis is one of the most prominent parasite-induced infectious diseases, affecting more than 250 million people. Schistosoma mansoni causes metabolic exhaustion and a strong redox imbalance in the liver, causing parenchymal damage, and may predispose for cancer. We investigated whether oxidative stress provokes hepatocellular proliferation upon S. mansoni infection.

Methods: The cell cycle, replication stress response, and proliferation were analyzed on transcriptional and protein levels in the livers of S. mansoni-infected hamsters and by mechanistic gain- and loss-of-function experiments in human hepatoma cells. Major results were validated in human biopsy specimens of S. mansoni-infected patients.

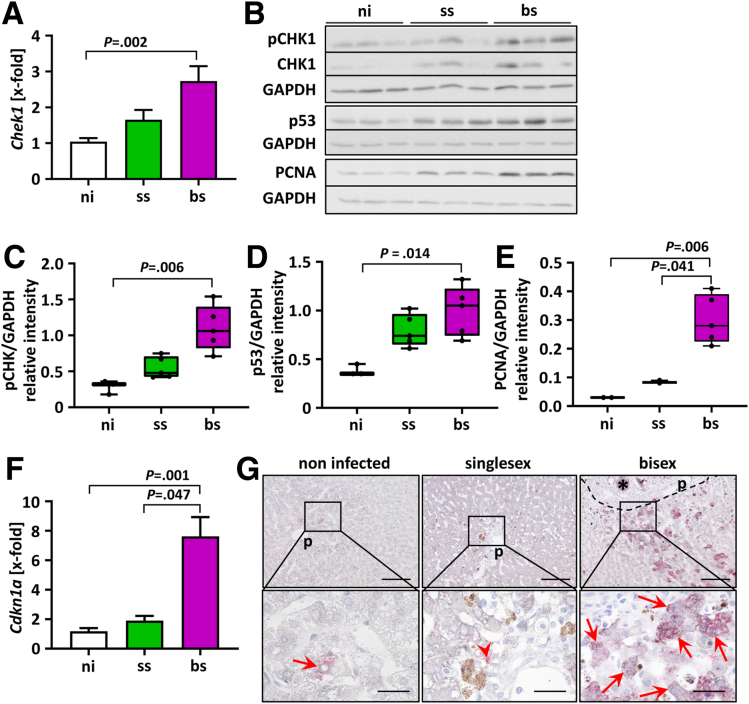
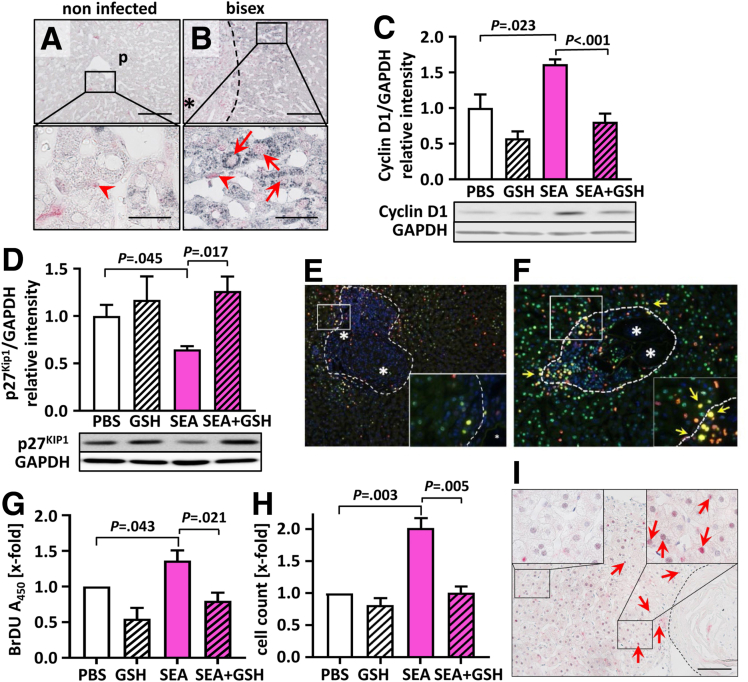
Results: S. mansoni infection induced licensing factors of DNA replication and cell-cycle checkpoint cyclins in parallel with a DNA damage response in hamster hepatocytes. Moreover, even unisexual infection without egg effects, as a reflection of a chronic inflammatory process, resulted in a moderate activation of several cell-cycle markers. S. mansoni soluble egg antigens induced proliferation of human hepatoma cells that could be abolished by reduced glutathione.

Conclusions: Our data suggest that hepatocellular proliferation is triggered by S. mansoni egg-induced oxidative stress.

Keywords: Cell Cycle; DNA Stress Response; Parasite; Replication Licensing.


Figures

None
Graphical abstract
Figure 1
Figure 1
S. mansoni infection caused aberrant expression of hepatic MCM proteins. (A–C) Hepatic mRNA levels of minichromosome maintenance protein (Mcm) genes 4, 6, and 7 were increased in bs-infected hamsters of both sexes (n = 3–5). (D and E) Western blot analysis and densitometric analysis showed the induction of MCM6 in livers of bs-infected hamsters (n = 3). A representative Western blot is shown. (A–E) Data were normalized to the control (ni) group, and the Kruskal–Wallis test was performed to assess group differences. (F) MCM6 (red)/fibrinogen (grey) co-immunostaining of histologic liver sections showed low expression levels of MCM6 in ni animals and ss-infected hamsters, as well as the increased nuclear accumulation of MCM6 in perigranulomatous hepatocytes (red arrows) and to a lesser extent in leukocytes (red arrowheads) of bs-infected hamsters. The acute-phase protein fibrinogen is synthesized in hepatocytes. Here, it stained the cytoplasm of hepatocytes light grey. This allows differentiation between parenchymal MCM6 activation (red arrows) in hepatocytes and MCM6 activation in nonparenchyma cells (red arrowheads). Representative hepatic co-immunostainings of female and male noninfected, ss-infected, and bs-infected hamsters are shown. Original magnification: 200×. Scale bar: 100 μm. Black dotted line indicates a granuloma. ∗ S. mansoni egg. (G) The levels of Mcm7 mRNA increased in HepG2 cells treated with S. mansoni SEA. Data were normalized to the control (phosphate-buffered saline [PBS]) group. These experiments were performed at least 3 times independently. Levels of significance are indicated in the figure (Student t test). cv, central vein; GAPDH, glyceraldehyde-3-phosphate dehydrogenase; p, portal tract.
Figure 2
Figure 2
S. mansoni infection triggered the replication stress response. (A) Gene expression (mRNA level) of checkpoint kinase 1 (Chek1) was up-regulated in livers of bs-infected hamsters (n = 5–8). Data were normalized to the control group, and the Kruskal–Wallis test was performed to assess group differences. (B and C) Phosphorylation of CHK1 at Ser345 revealed checkpoint activation in livers of bs-infected hamsters as determined by Western blot analysis and densitometric analysis. (B and D) The tumor-suppressor protein p53 was up-regulated in livers of bs-infected hamsters as determined by Western blot analysis and densitometric analysis. (B and E) PCNA was increased at the protein level in livers of bs-infected hamsters. (F) The mRNA expression levels of cyclin-dependent kinase inhibitor p21SDI1 (Cdkn1a), essential for DNA damage response, were increased in livers of bs-infected hamsters (n = 5–8). (G) Representative co-immunostainings for p21SDI1 (red)/fibrinogen (grey) in the livers of female hamsters, which were noninfected (control), ss-infected, and bs-infected. The acute-phase protein fibrinogen is synthesized in hepatocytes and here stained the cytoplasm of hepatocytes light grey. This allows identification of parenchymal p21 expression (arrows) in hepatocytes. Arrows indicate p21 staining in hepatocellular cytoplasm, while arrowheads point out p21-stained nonparenchyma cells. Of note, p21SDI1 protein was detected mainly in the cytoplasm of hepatocytes in bs-infected hamsters. Original magnification: 200× and 1000×. Scale bars: 100 and 25 μm. ∗Eggs. Dashed line indicates the granuloma border. Representative Western blots are depicted. Data were normalized to the control group, and the Kruskal–Wallis test was performed to assess group differences. Levels of significance are indicated in the figure. GAPDH, glyceraldehyde-3-phosphate dehydrogenase; ni, noninfected; p, portal tract; pCHK1, phosphorylated checkpoint kinase 1.
Figure 3
Figure 3
S. mansoni infection provoked up-regulation of G1/S checkpoint regulators. (A and B) Hepatic cyclin D1 was strongly up-regulated in livers of bs-infected hamsters as shown by Western blot analysis (n = 6). (A and C) S. mansoni bs-infection caused an increase of the hepatic cyclin-dependent kinase inhibitor p27KIP1 compared with ni- and ss-infected hamsters (n = 3–5). (A and C) As shown by Western blot, hepatic SKP2 protein levels were up-regulated in bs-infected hamsters compared with ss-infected and noninfected controls (n = 3–5). (A) Representative Western blots are shown. (B–D) Data were normalized to the control group, and the Kruskal–Wallis test was performed to assess group differences. (E) Representative immunostaining for p27KIP1 in the livers of female hamsters, noninfected, ss-infected, and bs-infected. Red arrows indicate p27KIP1-positive hepatocellular nuclei, while arrowheads point out p27KIP1-stained nuclei of leukocytes. Please note p27KIP1 products in the cytoplasm of hepatocytes of bs-infected hamsters (black arrows). Original magnification, 1000×. Scale bars: 50 μm. ∗Eggs. Dashed line indicates the granuloma border. (F and G) Hepatic cyclin D1 and (C) cyclin E1 gene (Ccbnd1, Ccne1) expression was increased significantly in bs-infected hamsters (n = 5–8). GAPDH, glyceraldehyde-3-phosphate dehydrogenase; ni, noninfected; p, portal tract; SKP2, S phase kinase-associated protein 2.
Figure 4
Figure 4
Increased proliferation of SEA-stimulated hepatoma cells is abrogated by GSH. (A and B) Representative co-immunostaining of SOD2 and MCM7 in the livers of female hamsters, which were (A) ni-infected (control) and (B) bs-infected. Arrows indicate MCM7 staining (red) in perigranulomatous hepatocellular nuclei with strong cytoplasmic SOD2 staining (grey), while arrowheads point out MCM7-stained nuclei of nonparenchyma cells. Please note the co-expression of cytoplasmic SOD2 and nuclear MCM7 in perigranulomatous hepatocytes. Original magnification, 200× and 1000×. Scale bars: 100 and 50 μm. ∗Eggs. Dashed line indicates the granuloma border. (C) SEA treatment induced the up-regulation of cyclin D1 protein levels in HepG2 cells and their down-regulation to control levels by the addition of the reduction equivalent GSH. Cell-culture experiments were performed 5 times independently. (D) SEA treatment stimulated down-regulation of the p27KIP1 protein level in HepG2 cells, and its up-regulation to control levels by the addition of the reduction equivalent GSH. Cell culture experiments were performed 3 times independently. (C and D) Representative Western blots are depicted. (E and F) Co-staining of the nuclei with Ki67 and the phosphorylated histone variant H2AX (γH2AX) showed proliferating hepatocytes with DNA damage in livers of S mansoni bs-infected hamsters. The 2 liver tissue sections were stained with double-staining multiplex immunohistochemistry. Proliferation of HepG2 cells increased by SEA treatment and remained at basal levels by the addition of reduction equivalents in the form of GSH as shown by (G) BrdU proliferation assay and (H) cell count. Data were normalized to the control (phosphate-buffered saline [PBS]) group. These experiments were performed at least (G) 4 and (H) 3 times independently. Levels of significance are indicated in the figure (Student t test). (I) Perigranulomatous hepatocellular cyclin D1 expression in a patient infected with S. mansoni. Human liver biopsy co-immunohistologically stained for cyclin D1 (red) and hepatocyte nuclear factor 4 alpha (HNF4α) (grey). Original magnification, 200×. Scale bar: 100 μm. Dashed line indicates a granuloma. Box is the area shown with higher resolution. Red arrow indicates hepatocellular nuclei positively stained for cyclin D1. GAPDH, glyceraldehyde-3-phosphate dehydrogenase; ni, noninfected; p, portal tract.
Figure 5
Figure 5
S. mansoni infection enhanced mitogen expression in hamster livers. (A) Hepatic Il-6 expression was increased significantly in bs-infected hamsters compared with ss-infected and ni-infected controls (n = 6–22). (B) Hepatic Il-6 expression levels increased significantly with the hepatic egg burden in bs-infected hamsters. (C) Hepatic expression of Egf was increased significantly compared with ss-infected and ni-infected controls (n = 5–17). Hepatic EGFR protein levels were increased significantly by bs infection (n = 3–5). A representative Western blot is depicted. Data were normalized to the control group, and the Kruskal–Wallis test was performed to assess group differences. GAPDH, glyceraldehyde-3-phosphate dehydrogenase; ni, noninfected.

References

    1. WHO. Fact-Sheets Schistosomiasis 2021. Available at: https://www.who.int/news-room/fact-sheets/detail/schistosomiasis, Accessed 1 February 2023.
    1. Salas-Coronas J., Bargues M.D., Lozano-Serrano A.B., et al. Evidence of autochthonous transmission of urinary schistosomiasis in Almeria (southeast Spain): an outbreak analysis. Travel Med Infect Dis. 2021;44 - PubMed
    1. Chabasse D., Bertrand G., Leroux J.P., et al. Bilharziose à Schistosoma mansoni évolutive découverte 37 ans après l'infestation. Bull Soc Pathol Exot. 1985;78:643–647. - PubMed
    1. Schwartz C., Fallon P.G. Schistosoma "eggs-iting" the host: granuloma formation and egg excretion. Front Immunol. 2018;9:2492. - PMC - PubMed
    1. von Bülow V., Lichtenberger J., Grevelding C.G., et al. Does Schistosoma mansoni facilitate carcinogenesis? Cells. 2021;10:1982. - PMC - PubMed