. 2023 Sep 11;6(12):e202302091.
doi: 10.26508/lsa.202302091. Print 2023 Dec.

Mitochondrial membrane potential acts as a retrograde signal to regulate cell cycle progression

Affiliations

Mitochondrial membrane potential acts as a retrograde signal to regulate cell cycle progression

Choco Michael Gorospe et al. Life Sci Alliance. .

Abstract

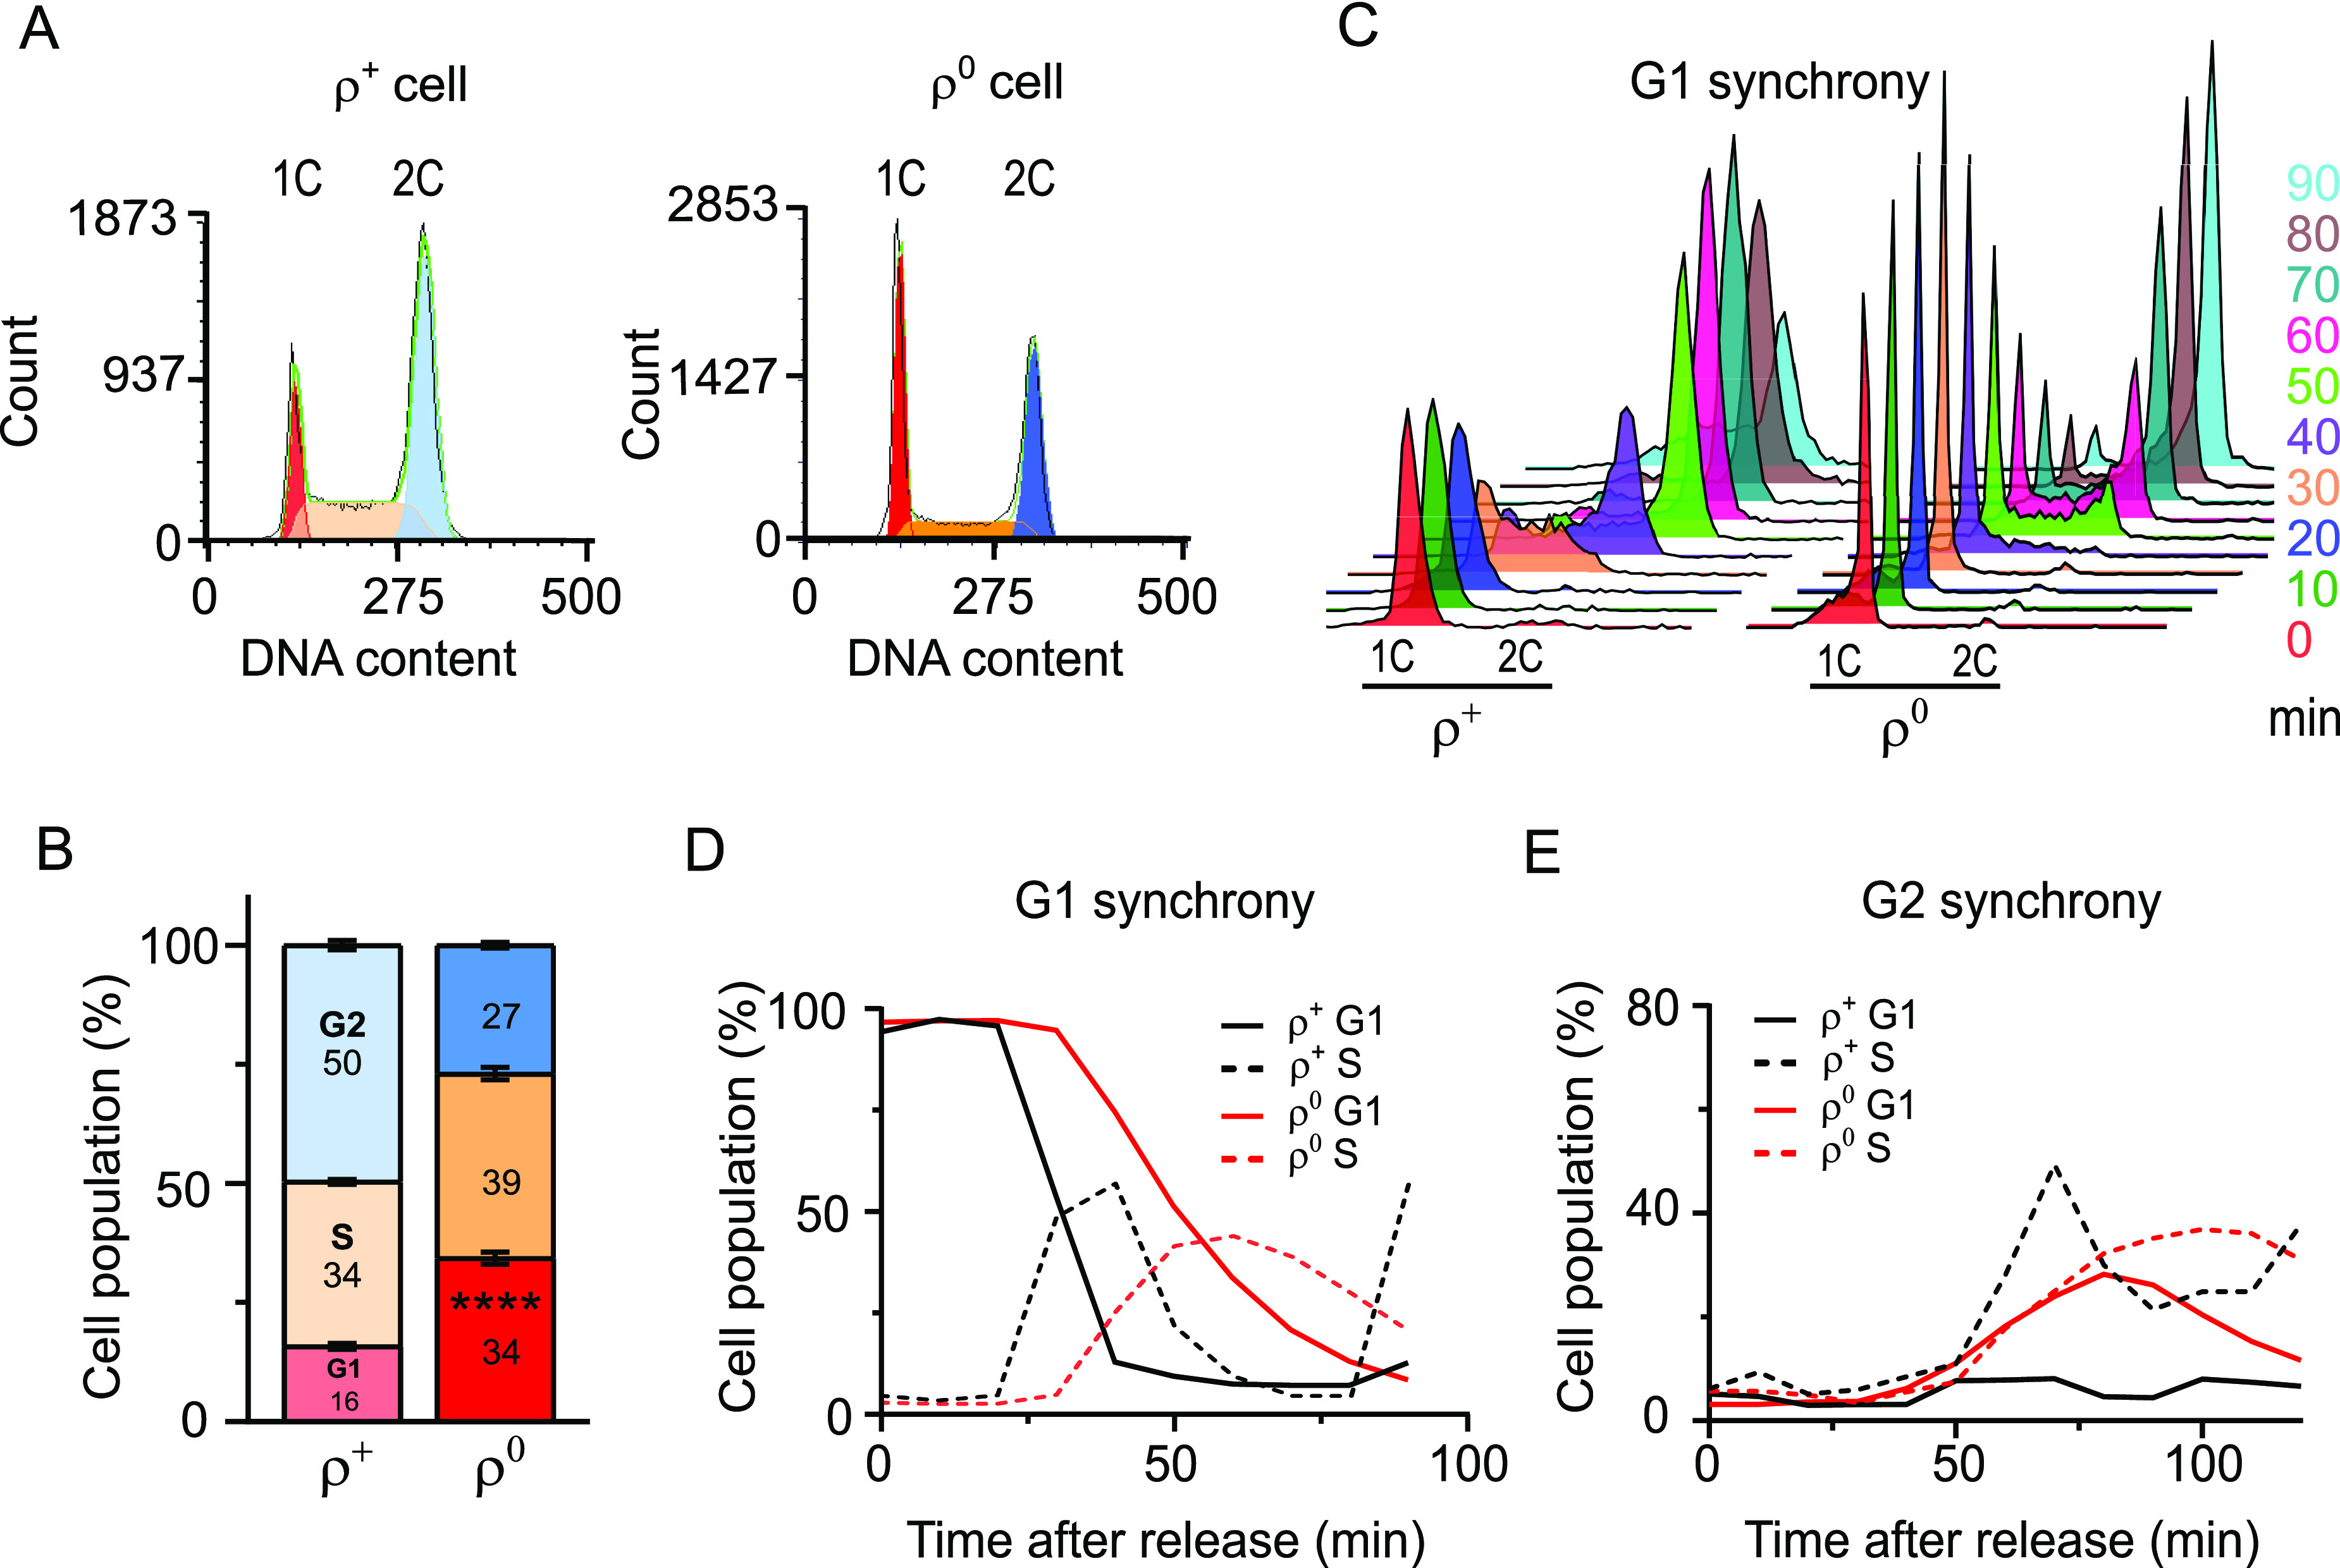
Mitochondria are central to numerous metabolic pathways whereby mitochondrial dysfunction has a profound impact and can manifest in disease. The consequences of mitochondrial dysfunction can be ameliorated by adaptive responses that rely on crosstalk from the mitochondria to the rest of the cell. Such mito-cellular signalling slows cell cycle progression in mitochondrial DNA-deficient (ρ0) Saccharomyces cerevisiae cells, but the initial trigger of the response has not been thoroughly studied. Here, we show that decreased mitochondrial membrane potential (ΔΨm) acts as the initial signal of mitochondrial stress that delays G1-to-S phase transition in both ρ0 and control cells containing mtDNA. Accordingly, experimentally increasing ΔΨm was sufficient to restore timely cell cycle progression in ρ0 cells. In contrast, cellular levels of oxidative stress did not correlate with the G1-to-S delay. Restored G1-to-S transition in ρ0 cells with a recovered ΔΨm is likely attributable to larger cell size, whereas the timing of G1/S transcription remained delayed. The identification of ΔΨm as a regulator of cell cycle progression may have implications for disease states involving mitochondrial dysfunction.


Conflict of interest statement

The authors declare that they have no conflict of interest.

Figures

Figure 1.
Figure 1.. Loss of mtDNA induces a delay in transition from the G1 to the S phase of the cell cycle.
(A) Representative DNA histogram of unsynchronized WT (AC402) ρ+ and ρ0 cells grown to an early logarithmic phase in YPDA. 1C and 2C indicate populations with single and double chromosome contents, corresponding to cells in G1 and G2, respectively. The cell cycle profile was analysed using the multicycle model in FCS Express to determine the percentage of cells in G1 (red), S (orange), and G2 (blue) phases. (B) Quantification of the percentage of cells in the G1, S, or G2 phase. Values represent the average of at least four independent experiments including the one in Fig 1A, and error bars indicate SD. The two-tailed t test was performed to determine statistical significance between the G1 populations in WT ρ+ and ρ0 cultures. ****P < 0.0001. (C) DNA histogram of WT (AC402) ρ+ and ρ0 cells released from G1 synchrony achieved by treatment with 10 μg/ml α-factor. Cells were sampled every 10 min after release. The experiment was repeated at least three times; a representative experiment is shown. (D) Quantification of the percentage of G1 phase (solid lines) and S phase (dashed lines) cells after release from G1 synchrony in the experiment shown in Fig 1D. (E) Quantification of the percentage of G1 phase (solid lines) and S phase (dashed lines) cells after release of WT ρ+ and ρ0 cells from G2 synchrony achieved by nocodazole treatment. The DNA histograms are shown in Fig S1D. Values represent data from a single experiment. See also Fig S1.
Figure S1.
Figure S1.. Cell cycle profiles of cells lacking mtDNA. Related to Fig 1.
(A) Growth of WT (AC403) ρ+ and ρ0 cells in YPDA liquid media. The average of three independent experiments is shown; the error bars represent SD. (B) Representative DNA histograms of WT (AC402) ρ+ and ρ0 cells grown in YPDA. Cells were harvested once they reached an early logarithmic phase, ∼OD600 = 0.35–0.5 (time 0), and every 15 min thereafter. (C) Representative DNA histograms and the quantification of cells in the G1, S, or G2 phase in rim1Δ, mip1Δ, and mgm101Δ cells that lose mtDNA. Values represent the average of three experiments, and error bars indicate SD. The two-tailed t test was performed to determine statistical significance between the G1 populations in WT ρ0 and different mutants to the WT ρ+ cells. ****P < 0.0001. (D) Representative DNA histogram of WT (AC402) ρ+ and ρ0 cells released from G2 synchrony achieved by treatment with nocodazole (10 μg/ml for ρ+ and 25 μg/ml for ρ0) for 2 h. (E) Quantification of G2 cells in the experiment shown in Fig S1D. The percentage of G1 and S phase cells is shown in Fig 1F.
Figure 2.
Figure 2.. Loss of ΔΨm, but not the inhibition of mitochondrial ATP synthesis, delays G1-to-S progression in WT ρ+ cells.
(A) Percentage of G1 phase (solid lines) and S phase (dashed lines) cells in WT ρ+ in an early logarithmic phase left untreated or treated with 20 μM of oligomycin to inhibit mitochondrial ATP synthesis. Aliquots were harvested upon the addition of the drug (0 min) and every 15 min thereafter. Values represent the average of two independent experiments, and error bars indicate SD. Representative DNA histograms are shown in Fig S2A. (B) Percentage of G1 phase (solid lines) and S phase (dashed lines) cells in early logarithmic phase cultures of WT ρ+ cells left untreated or treated with 30 μM of BAM15. Aliquots were harvested upon the addition of the drug (0 min) and every 15 min thereafter. Values represent the average of three independent experiments, and error bars indicate SD. Representative DNA histograms are shown in Fig S2C. (C) DNA histogram of WT ρ+ cells synchronized in G1 with 10 μg/ml α-factor and released into media with or without 30 μM BAM15. Cells were sampled upon release (time 0) and every 10 min thereafter. (C, D) Quantification of G1 phase (solid lines) and S phase (dashed lines) cells in the experiment presented in panel (C). Values represent data from a single experiment. See also Fig S2.
Figure S2.
Figure S2.. The effect of ATP synthase inhibitor or uncouplers on the cell cycle profile of ρ+ and ρ0 cells. Related to Figs 2 and 3.
(A) Representative DNA histograms of WT (AC402) ρ+ and ρ0 cells grown until an early logarithmic stage and treated with 20 μM oligomycin. Aliquots were harvested upon the addition of the drug (0 min) and every 15 min thereafter. The quantification of the % of cells in G1 is shown in Fig 2A. (B) Upper panel: quantification of the % of G1 phase (solid lines) and S phase (dashed lines) cells in the ρ0 strain untreated or treated with 20 μM of oligomycin shown in Fig S2A. Values represent the average of two independent experiments, and error bars indicate SD. Lower panel: the effect of 20 μM oligomycin on the ΔΨm in WT (AC403) ρ+ cells was measured by TMRE fluorescence; treatment with 30 μM CCCP is shown as a positive control. The average of five independent experiments is shown; error bars represent SD. The groups were compared using one-way ANOVA. ****P < 0.0001. (C) Representative DNA histograms of WT (AC402) ρ+ and ρ0 cells grown until an early logarithmic stage and treated with 30 μM BAM15. Aliquots were harvested upon the addition of the drug (0 min) and every 15 min thereafter. The quantification of the % of cells in G1 is shown in Fig 2B (ρ+) and Fig 3B (ρ0). Refer to Fig S2A for the DNA histograms of untreated control samples. (D) Representative DNA histograms of WT (AC402) ρ+ cells grown until an early logarithmic stage and treated with 30 μM CCCP. Aliquots were harvested upon the addition of the drug (0 min) and every 15 min thereafter. Refer to Fig S2A for the DNA histograms of untreated control samples. (E) Quantification of the % of G1 phase (solid lines) and S phase (dashed lines) cells in the ρ+ strain shown in Fig S2D. Values represent data from a single experiment performed twice. (F) Quantification of the % of G1 phase (solid lines) and S phase (dashed lines) cells in the ρ0 strain shown in Fig S2D. Values represent data from a single experiment performed twice. (G) Representative DNA histogram of WT (AC402) ρ+ and ρ0 cells synchronized in G2 with 10 μg/ml nocodazole and released into media with or without 30 μM BAM15. Aliquots were sampled upon release (time 0) and every 10 min thereafter. (H, I, J) Quantification of cells in the G2 phase (H), G1 phase (I), and S phase (J) in the G2-synchrony experiment shown in Fig S2G. Values represent data from a representative experiment.
Figure S3.
Figure S3.. Properties of strains with altered mitochondrial membrane potential. Related to Figs 3 and 4.
(A) Representative microscopy images of WT ρ+ and ρ0 cells grown in YPDA until an early stationary phase co-stained without fixing with NAO and MitoTracker Deep Red. The merged two-colour image is shown at the bottom. Scale bars = 5 μm. (B) Representative histograms of TMRE fluorescence in WT (AC403), ATP1-111, and cox4Δ ρ+ and ρ0 cells left untreated and treated with 30 μM CCCP. (C) Representative histograms of NAO fluorescence in WT (AC403), ATP1-111, and cox4Δ ρ+ and ρ0 cells. (D) Representative DNA histogram of WT (AC402), ATP1-111, and cox4Δ ρ+ and ρ0 cells synchronized in G1 with 10 μg/ml α-factor and released into fresh media. Aliquots were sampled upon release (time 0) and every 10 min thereafter. The quantification of the % of cells in the G1 phase is shown in Fig 4D. (E) Growth of WT (AC403) and ATP1-111 ρ+ and ρ0 cells in YPDA liquid media. The average of three independent experiments is shown; the error bars represent SD. (F) Representative DNA histograms of WT (AC403), ATP1-111, and cox4Δ ρ+ and ρ0 cells treated with 20 μM of BAM15. Aliquots were harvested upon the addition of the drug (0 min) and every 15 min thereafter. The quantification of the % of cells in the G1 phase is shown in Fig 4F and G.
Figure 3.
Figure 3.. Uncoupler treatment exacerbates the cell cycle phenotype of ρ0 cells.
(A) ΔΨm normalized to mitochondrial mass was measured in WT (AC403) ρ+ and ρ0 cells as described in the Materials and Methods section. The average of seven independent experiments is shown; error bars represent SD. The groups were compared using one-way ANOVA. ****P < 0.0001. The same data are shown in Fig 4A. (B) Percentage of G1 phase (solid lines) and S phase (dashed lines) cells in early logarithmic phase cultures of WT ρ0 cells left untreated or treated with 30 μM of BAM15. Aliquots were harvested upon the addition of the drug (0 min) and every 15 min thereafter. Values represent the average of five independent experiments, and error bars indicate SD. Representative DNA histograms are shown in Fig S2C. (C) DNA histograms of WT (AC402) ρ0 cells synchronized in G1 with 10 μg/ml α-factor and released into media with or without 30 μM BAM15. Aliquots were sampled upon release (time 0) and every 10 min thereafter. (D) Quantification of G1 phase (solid lines) and S phase (dashed lines) cells in the experiment presented in Fig 3C (untreated and BAM15-treated ρ0 cells); the ρ+ control data are from Fig 2C. Representative data from a single experiment are shown. See also Fig S2.
Figure 4.
Figure 4.. Cell cycle delay can be rescued by increasing the ΔΨm of ρ0 cells.
(A) ΔΨm normalized to mitochondrial mass was measured in WT (AC403), ATP1-111, and cox4Δ ρ+ and ρ0 cells as described in the Materials and Methods section. Histograms of TMRE and NAO fluorescence are presented in Fig S3B and C. The average of seven independent experiments is shown; error bars represent SD. The groups were compared by one-way ANOVA. ****P < 0.0001, **P < 0.01, ns P > 0.05 compared with respective ρ+; ####P < 0.0001, #P < 0.05, ns P > 0.05 compared with the indicated strain. WT ρ0 did not significantly differ from cox4Δ ρ0; WT ρ+ versus cox4Δ ρ0: ####; WT ρ0 versus ATP1-111 ρ+: ##. (B) Representative DNA histograms of WT (AC403), ATP1-111, and cox4Δ ρ+ and ρ0 cells grown to an early logarithmic phase in YPDA. (B, C) Quantification of the percentage of cells in the G1, S, or G2 phase in panel (B). Values represent the average of at least three independent experiments, and error bars indicate SD. The two-tailed t test was performed to determine statistical significance between the G1 populations of each strain’s ρ+ and ρ0 variants. **P < 0.01, ns P > 0.05. (D) Quantification of the percentage of G1 cells in WT (AC402), ATP1-111, and cox4Δ ρ+ and ρ0 cells after release from G1 synchrony. Representative histograms are shown in Fig S3D. Values represent the average of at three independent experiments, and error bars indicate SD. The percentage of cells in the G1 phase between ATP1-111 ρ0 cells and WT ρ0 cells was compared by a two-tailed t test. ****P < 0.0001, ***P < 0.001, **P < 0.01. (E) Quantification of the colony sizes of WT (AC403), ATP1-111, and cox4Δ ρ+ and ρ0 cells grown on the same YPDA plate for 48 h; the average area of WT ρ+ colonies was set to 1. The groups were compared by one-way ANOVA. ****P < 0.0001, ns P > 0.05 compared with the respective ρ+; ####P < 0.0001 compared with the indicated strain. (F, G) Percentage of WT (AC403), ATP1-111, and cox4Δ ρ+ (F) and ρ0 cells (G) in the G1 phase in untreated cultures (solid lines) or after treatment with 20 μM of BAM15 (dashed lines). The average of three independent experiments is shown; error bars represent SD. The percentage of cells in the G1 phase between WT and cox4Δ ρ+ cells at specific timepoints was compared by a two-tailed t test. ***P < 0.001, *P < 0.05, ns P > 0.05. See also Fig S3.
Figure 5.
Figure 5.. Levels of oxidative stress do not correlate with the extent of the G1-to-S delay.
(A) Representative DNA histogram of WT (AC402) ρ+ cells grown until an early logarithmic stage and treated with 400 μM H2O2 for 60 min. Additional timepoints are shown in Fig S4A. (B) Quantification of G1 phase (solid lines) and S phase (dashed lines) cells in the experiment presented in Fig 5A and three additional experiments; error bars indicate SD. (C) Quantification of % of G1 phase (solid lines) and S phase (dashed lines) cells in WT ρ+ (left panel) and WT ρ0 (right panel) strains treated with 30 mM NAC or 20 mM GSH for 2 h. Values represent the average of three experiments, and error bars indicate SD. Representative DNA histograms are shown in Fig S4B. (D) ΔΨm normalized to mitochondrial mass was measured in WT (AC402) cells left untreated and treated with either 30 mM NAC or 20 mM GSH for 10 min. The average of six independent experiments is shown; error bars represent SD. The control and the treated samples were compared by one-way ANOVA. ****P < 0.0001. Raw TMRE intensity data and related controls are shown in Fig S4C and D. (E) Quantification of lipid peroxidation in WT (AC402), ATP1-111, and cox4Δ ρ+ and ρ0 cells grown on YPDA until an early logarithmic phase. Values are expressed as MDA equivalent (nM) per ng total protein. The average of eight independent experiments is shown; error bars represent SD. There is no significant difference between sample groups after comparison by one-way ANOVA. (F) Quantification of MitoSOX Red fluorescence as an indicator of mitochondrial superoxide in WT (AC402), ATP1-111, and cox4Δ ρ+ and ρ0 cells grown until an early logarithmic stage. The average of four independent experiments is shown; error bars represent SD. There is no significant difference between sample groups after comparison by one-way ANOVA. See also Fig S4.
Figure S4.
Figure S4.. Modulating the levels of cellular oxidative stress impacts on the cell cycle. Related to Fig 5.
(A) Representative DNA histograms of WT (AC402) ρ+ cells grown until an early logarithmic stage and treated with 400 μM H2O2. Aliquots were harvested upon the addition of the drug (0 min) and every 15 min thereafter. The 60-min timepoint is also shown in Fig 5A, and the quantification of the % of cells in the G1 and S phase is shown in Fig 5B. (B) Representative DNA histograms of WT (AC402) ρ+ (left panel) and ρ0 (right panel) cells grown until an early logarithmic stage and left untreated or treated with either 30 mM NAC or 20 mM GSH. Aliquots were harvested upon the addition of the drug (0 min) and every 15 min thereafter. Quantification of the % of cells in the G1 and the S phase is shown in Fig 5C. (C) Representative histograms of TMRE fluorescence in WT (AC402) ρ+ cells treated with 30 mM NAC and 10 mM GSH for 10 min. See Fig 5D for the normalized data of ΔΨm over mitochondrial mass. (D) Quantification of the TMRE fluorescence in WT (AC402) ρ+ cells treated and untreated with 300 μM CCCP, 30 mM NAC, and/or 20 mM GSH as indicated. The average of six independent experiments is shown; error bars represent SD. One-way ANOVA was performed to determine statistical significance between untreated and treated samples. ****P < 0.0001, ns P > 0.05. There was no significant difference between CCCP treatment and CCCP+antioxidant treatments. (E) Quantification of lipid peroxidation in WT (AC402) ρ+ cells grown on YPDA for 24 h left untreated or treated with 20 mM H2O2 for 30 min. Values are expressed as MDA equivalent normalized to the total protein concentration. The average of three independent experiments is shown; error bars represent SD. The two-tailed t test was performed to determine statistical significance between the treated and untreated samples. **P < 0.01. (F) MitoSOX Red fluorescence in WT (AC402) ρ+ (left panel) and ρ0 (right panel) cells grown until an early logarithmic stage and left untreated and treated with 500 μM KCN, 30 μM BAM15, or 20 μM oligomycin for 30 min. The average of three independent experiments is shown; error bars represent SD. One-way ANOVA was performed to determine statistical significance between the control and the treated samples. *P < 0.05, **P < 0.01, ***P < 0.001, ns P > 0.05.
Figure 6.
Figure 6.. ΔΨm modulates G1/S transition through cell size.
(A) Brief schematic of Start passage control. The Cln3-Cdk1 complex partly inactivates the transcriptional repressor Whi5, relieving the repression of SBF- and MBF-dependent genes such as CLN1/2 and CLB5/6, respectively. Cln1/2-Cdk1 activity, which is further modulated by Cdk inhibitors such as Cip1 and Far1 (not shown), drives G1/S-associated changes such as budding and pheromone resistance. Cln1/2-Cdk1 also inactivates the Sic1 inhibitor of Clb5/6-Cdk1, allowing the latter to activate DNA replication. Numerous other pathways impinge on this control; reviewed in Refs. (31, 36, 37). (B) Area of cross-sections of G1 (=unbudded) cells stained with trypan blue; the size of WT ρ+ cells was set to 1. An average of 180 G1 cells were counted per group; the line indicates the mean value. The groups were compared by one-way ANOVA. ****P < 0.0001, ns P > 0.05 compared with the respective ρ+; ####P < 0.0001 compared with the indicated strain. (C) Relative gene expression analysis of the CLN3, CLN1, and CLN2 transcripts at the indicated timepoints after release of WT or ATP1-111 ρ+ and ρ0 cells from ⍺-factor synchrony. Values were normalized to ACT1 at each timepoint, and the CLN/ACT1 ratio of WT ρ+ at 0 min was set to 1. The average of three independent experiments is shown; error bars indicate the standard error of the mean. Asterisks indicate P < 0.05 in a two-tailed t test comparing WT ρ+ versus ρ0 (red asterisks) or ATP1-111 ρ+ versus ρ0 (blue asterisks). See Fig S5B for a representative cell cycle profile of released cells.
Figure S5.
Figure S5.. Expression analysis of WHI5 and the S phase cyclins. Related to Fig 6.
(A) Representative microscopy images of WT ρ+ cells grown in YPDA until an early logarithmic phase stained with trypan blue without fixation. Bright-field (BF) image easily identifies single unbudded cells (green arrows). Trypan blue stains the cell wall. Scale bar = 5 μm. (B) Percentage of WT and ATP1-111 ρ+ and ρ0 cells in the G1 phase at the indicated timepoints after release from ⍺-factor synchrony. A representative experiment from those in Fig 6C is shown. The percentage of cells in G1 at time 0 was set to 100. (C) Relative gene expression analysis of the WHI5, CLB5, and CLB6 transcripts at the indicated timepoints after release of WT or ATP1-111 ρ+ and ρ0 cells from ⍺-factor synchrony. Values were normalized to ACT1 at each timepoint, and the gene/ACT1 ratio of WT ρ+ at 0 min was set to 1. The average of three independent experiments is shown; error bars indicate the standard error of the mean. The P-values of comparisons between WT ρ+ versus ρ0 (red symbols) or ATP1-111 ρ+ versus ρ0 (blue symbols) in a two-tailed t test are indicated. *P < 0.05, ***P < 0.001.

Similar articles

Cited by

References

    1. Nunnari J, Suomalainen A (2012) Mitochondria: In sickness and in health. Cell 148: 1145–1159. 10.1016/j.cell.2012.02.035 - DOI - PMC - PubMed
    1. Raimundo N (2014) Mitochondrial pathology: Stress signals from the energy factory. Trends Mol Med 20: 282–292. 10.1016/j.molmed.2014.01.005 - DOI - PubMed
    1. Leadsham JE, Sanders G, Giannaki S, Bastow EL, Hutton R, Naeimi WR, Breitenbach M, Gourlay CW (2013) Loss of cytochrome c oxidase promotes RAS-dependent ROS production from the ER resident NADPH oxidase, Yno1p, in yeast. Cell Metab 18: 279–286. 10.1016/j.cmet.2013.07.005 - DOI - PubMed
    1. Kopinski PK, Janssen KA, Schaefer PM, Trefely S, Perry CE, Potluri P, Tintos-Hernandez JA, Singh LN, Karch KR, Campbell SL, et al. (2019) Regulation of nuclear epigenome by mitochondrial DNA heteroplasmy. Proc Natl Acad Sci U S A 116: 16028–16035. 10.1073/pnas.1906896116 - DOI - PMC - PubMed
    1. Veatch JR, McMurray MA, Nelson ZW, Gottschling DE (2009) Mitochondrial dysfunction leads to nuclear genome instability via an iron-sulfur cluster defect. Cell 137: 1247–1258. 10.1016/j.cell.2009.04.014 - DOI - PMC - PubMed

Publication types

Substances

LinkOut - more resources