. 2023 Sep 11;6(11):e202301971.
doi: 10.26508/lsa.202301971. Print 2023 Nov.

A targeted sequencing extension for transcript genotyping in single-cell transcriptomics

Affiliations

A targeted sequencing extension for transcript genotyping in single-cell transcriptomics

Lies Van Horebeek et al. Life Sci Alliance. .

Abstract

As no existing methods within the single-cell RNA sequencing repertoire combine genotyping of specific genomic loci with high throughput, we evaluated a straightforward, targeted sequencing approach as an extension to high-throughput droplet-based single-cell RNA sequencing. Overlaying standard gene expression data with transcript level genotype information provides a strategy to study the impact of genetic variants. Here, we describe this targeted sequencing extension, explain how to process the data and evaluate how technical parameters such as amount of input cDNA, number of amplification rounds, and sequencing depth influence the number of transcripts detected. Finally, we demonstrate how targeted sequencing can be used in two contexts: (1) simultaneous investigation of the presence of a somatic variant and its potential impact on the transcriptome of affected cells and (2) evaluation of allele-specific expression of a germline variant in ad hoc cell subsets. Through these and other comparable applications, our targeted sequencing extension has the potential to improve our understanding of functional effects caused by genetic variation.


Conflict of interest statement

The authors declare that they have no conflict of interest.

Figures

None
Graphical abstract
Figure 1.
Figure 1.. Targeted library preparation consists of two rounds of tailed-PCR starting from amplified cDNA.
The constructs and sequences displayed are for extension to the Chromium Single Cell Gene Expression Solution (v3 and v3.1, single index), which captures the 3′ end of transcripts. Image is conceptual and elements are not necessarily proportional. BC, 10x cellular barcode; cDNA, complementary DNA; P5/P7, priming sites used in Illumina sequencers; R1, TruSeq Read 1; R2, TruSeq Read 2; SI, sample index; TSO, template switching oligo; UMI, unique molecular identifier.
Figure S1.
Figure S1.. Targeted library preparation with constructs and sequences for extension to the Chromium Single Cell Immune Profiling Solution (5′, v1.1, single index).
Image is conceptual and elements are not necessarily proportional. BC, 10x cellular barcode; cDNA, complementary DNA; P5/P7, priming sites used in Illumina sequencers; R1, TruSeq Read 1; R2, TruSeq Read 2; SI, sample index; TSO, template switching oligo; UMI, unique molecular identifier.
Figure 2.
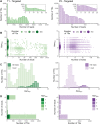
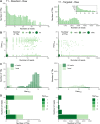
Figure 2.. Examples of read and Hamming distance distributions.
Plots on the left show the TREX1 data from the targeted method at T1. Plots on the right the IL7R data from the targeted method for P2. (A) Distribution of number of reads per tagging sequence from the targeted method (left: bin width = 100 for the base plot and bin width = 1 for the zoomed plot; right: bin width = 5 for the base plot and bin width = 1 for the zoomed plot). (B) Count plot of tagging sequences by the number of reads and minimal Hamming distance. (C) Histograms of minimal Hamming distance for tagging sequences supported by only one read (light; compared with the whole dataset) and amongst abundantly present tagging sequences (dark). (D) Bar chart of corrected tagging sequences per number of reads and colored by minimal Hamming distance (to all other tagging sequences). Hammin, minimal Hamming distance; TS, tagging sequence.
Figure S2.
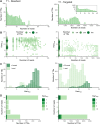
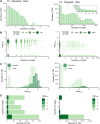
Figure S2.. Read and Hamming distance distributions for TREX1 dataset at T1.
Plots on the left show the TREX1 data from the standard method at T1. Plots on the right show the TREX1 data from the targeted method at T1. (A) Distribution of number of reads per tagging sequence (bin width = 100 for the base plots and bin width = 1 for the zoomed plot). (B) Count plot of tagging sequences by the number of reads and minimal Hamming distance. (C) Histograms of minimal Hamming distance for tagging sequences supported by only one read (light; compared with whole dataset) and among abundantly present tagging sequences (dark). (D) Bar chart of corrected tagging sequences per number of reads and colored by minimal Hamming distance (to all other tagging sequences). Hammin, minimal Hamming distance; TS, tagging sequence.
Figure S3.
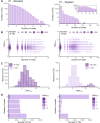
Figure S3.. Read and Hamming distance distributions for TREX1 dataset at T2.
Plots on the left show the TREX1 data from the standard method at T2. Plots on the right show the TREX1 data from the targeted method at T2. (A) Distribution of number of reads per tagging sequence (bin width = 100 for the base plots and bin width = 1 for the zoomed plot). (B) Count plot of tagging sequences by number of reads and minimal Hamming distance. (C) Histograms of minimal Hamming distance for tagging sequences supported by only one read (light; compared with whole dataset) and among abundantly present tagging sequences (dark). (D) Bar chart of corrected tagging sequences per number of reads and colored by minimal Hamming distance (to all other tagging sequences). Hammin, minimal Hamming distance; TS, tagging sequence.
Figure S4.
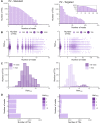
Figure S4.. Read and Hamming distance distributions for IL7R dataset from P1.
Plots on the left show the IL7R data from P1 obtained with the standard method. Plots on the right the IL7R data from P1 obtained with the targeted method. (A) Distribution of number of reads per tagging sequence (bin width = 1 for the left base plot and the zoomed plot, and bin width = 10 for the right base plot). (B) Count plot of tagging sequences by number of reads and minimal Hamming distance. (C) Histograms of minimal Hamming distance for tagging sequences supported by only one read (light; compared with whole dataset) and amongst abundantly present tagging sequences (dark). (D) Bar chart of tagging sequences per number of reads and colored by minimal Hamming distance (to all other tagging sequences). Hammin, minimal Hamming distance; TS, tagging sequence.
Figure S5.
Figure S5.. Read and Hamming distance distributions for IL7R dataset from P2.
Plots on the left show the IL7R data from P2 obtained with the standard method. Plots on the right show the IL7R data from P2 obtained with the targeted method. (A) Distribution of number of reads per tagging sequence (bin width = 1 for the left base plot and for the zoomed plot, and bin width = 5 for right base plot). (B) Count plot of tagging sequences by number of reads and minimal Hamming distance. (C) Histograms of minimal Hamming distance for tagging sequences supported by only one read (light; compared with the whole dataset) and among abundantly present tagging sequences (dark). (D) Bar chart of tagging sequences per number of reads and colored by minimal Hamming distance (to all other tagging sequences). Hammin, minimal Hamming distance; TS, tagging sequence.
Figure S6.
Figure S6.. Read and Hamming distance distributions for TREX1 dataset at T1 before correction by Cell Ranger.
Plots on the left show the TREX1 data from the standard method at T1 before Cell Ranger corrections. Plots on the right show the TREX1 data from the targeted method at T1 before Cell Ranger corrections. (A) Distribution of number of reads per tagging sequence (bin width = 100 for the base plots and bin width = 1 for the zoomed plot). (B) Count plot of tagging sequences by number of reads and minimal Hamming distance. (C) Histograms of minimal Hamming distance for tagging sequences supported by only one read (light; compared with the whole dataset) and among abundantly present tagging sequences (dark). (D) Bar chart of corrected tagging sequences per number of reads and colored by minimal Hamming distance (to all other tagging sequences). Hammin, minimal Hamming distance; TS, tagging sequence.
Figure S7.
Figure S7.. Read and Hamming distance distributions for TREX1 dataset at T2 before correction by Cell Ranger.
Plots on the left show the TREX1 data from the standard method at T2 before Cell Ranger corrections. Plots on the right show the TREX1 data from the targeted method at T2 before Cell Ranger corrections. (A) Distribution of number of reads per tagging sequence (bin width = 100 for the base plots and bin width = 1 for the zoomed plot). (B) Count plot of tagging sequences by number of reads and minimal Hamming distance. (C) Histograms of minimal Hamming distance for tagging sequences supported by only one read (light; compared with the whole dataset) and among abundantly present tagging sequences (dark). (D) Bar chart of corrected tagging sequences per number of reads and colored by minimal Hamming distance (to all other tagging sequences). Hammin, minimal Hamming distance; TS, tagging sequence.
Figure S8.
Figure S8.. Read and Hamming distance distributions for IL7R dataset from P1 before correction by Cell Ranger.
Plots on the left show the IL7R data from P1 obtained with the standard method before Cell Ranger corrections. Plots on the right show the IL7R data from P1 obtained with the targeted method before Cell Ranger corrections. (A) Distribution of number of reads per tagging sequence (bin width = 1 for the left base plot and the zoomed plot, and bin width = 10 for the right base plot). (B) Count plot of tagging sequences by number of reads and minimal Hamming distance. (C) Histograms of minimal Hamming distance for tagging sequences supported by only one read (light; compared with whole dataset) and among abundantly present tagging sequences (dark). (D) Bar chart of tagging sequences per number of reads and colored by minimal Hamming distance (to all other tagging sequences). Hammin, minimal Hamming distance; TS, tagging sequence.
Figure S9.
Figure S9.. Read and Hamming distance distributions for IL7R dataset from P2 before correction by Cell Ranger.
Plots on the left show the IL7R data from P2 obtained with the standard method before Cell Ranger corrections. Plots on the right show the IL7R data from P2 obtained with the targeted method before Cell Ranger corrections. (A) Distribution of number of reads per tagging sequence (bin width = 1 for the left base plot and the zoomed plot, and win width = 5 for the right base plot). (B) Count plot of tagging sequences by number of reads and minimal Hamming distance. (C) Histograms of minimal Hamming distance for tagging sequences supported by only one read (light; compared with the whole dataset) and among abundantly present tagging sequences (dark). (D) Bar chart of tagging sequences per number of reads and colored by minimal Hamming distance (to all other tagging sequences). Hammin, minimal Hamming distance; TS, tagging sequence.
Figure 3.
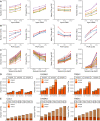
Figure 3.. Systematic analysis reveals the influence of the technical parameters and shows the potential value of additional libraries and sequencing.
(A, B, C) The effect of amount of input cDNA (A), the number of PCR cycles (B), and sequencing depth (C) on the number of independent tagging sequences (iTSs), proportion of iTSs compared with all observed TSs, mean number of iTSs per barcode (BC), and number of BCs. Shape indicates transcript (circle: CCL5, triangle: S100A11, square: TREX1), color indicates cDNA sample, and line type (only in (C)) indicates sequencing library. (D) Overlap in transcripts between libraries generated from the same cDNA sample. iTSs unique to a library are indicated in dark orange, and iTSs shared with at least one other library obtained from the same sample in light orange. (E) Overlap in transcripts between replicates at different sequencing depths (ranging from 600,000 reads to 4,200,000 reads). iTSs unique to a replicate are indicated in dark orange, and iTSs shared with at least one other replicate with the same number of reads in light orange.
Figure S10.
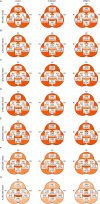
Figure S10.. Overlap between molecules captured in libraries starting from the same cDNA sample.
(A, B, C) Venn diagrams depicting the overlap in CCL5 transcripts (left), S100A11 transcripts (middle), and TREX1 transcripts (right) between libraries from sample 4 (A), sample 5 (B), and sample 6 (C).
Figure S11.
Figure S11.. Overlap between replicates with identical sequencing depth.
(A, B, C, D, E, F, G) Venn diagrams depicting the overlap in CCL5 transcripts (left), S100A11 transcripts (middle), and TREX1 transcripts (right) between down-sampled replicates with a depth of 600,000 reads (A), 1,200,000 reads (B), 1,800,000 reads (C), 2,400,000 reads (D), 3,000,000 reads (E) 3,600,000 reads (F), and 4,200,000 reads (G).
Figure S12.
Figure S12.. Supporting data for TREX1 application.
(A) Venn diagrams of overlap in TREX1 transcripts and in cells with TREX1 transcripts between the standard and targeted method at T1 and T2. (B) Correlation between number of UMIs per cell in standard and targeted methods. (C) TREX1 gene expression level across the different cell clusters. For each cluster, data from T1 (left, light) and T2 (right, dark) are indicated separately.
Figure S13.
Figure S13.. Supporting data for IL7R application.
(A) Venn diagrams of overlap in IL7R transcripts and in cells with IL7R transcripts between the standard and targeted methods for P1 and P2. (B) Correlation between number of UMIs per cell in the standard and targeted methods.
Figure 4.
Figure 4.. Targeted sequencing substantially increases the number of transcripts and cells with genotype information.
(A) Clustering and annotation based on gene expression data from the standard method of live, single cells. (B, C) Genotype information obtained through the standard method (B) and the targeted method (C). Alt: cells in which only alternate transcripts were detected, het: cells in which reference transcripts and alternate transcripts were detected, ref: cells in which only reference transcripts were detected, TEMRA: terminally differentiated effector memory rexpressing CD45RA.
Figure 5.
Figure 5.. Targeted sequencing substantially increases the number of cells with genotype information and improves risk allele fraction estimates.
(A) Clustering and annotation based on gene expression data from the standard method of live, single cells from a larger cohort of MS patients (n = 9) and down-sampled to the relevant subsets (P1 and P2). (B, C) Risk allele fraction estimates obtained from the standard method (B) and the targeted method (C). CM, central memory; EM, effector memory; MAIT, mucosa-associated invariant T cells; NKT, natural killer T cells; RAF, risk allele fraction; TE, terminal effector; Th, T helper cells.

Similar articles

Cited by

References

    1. Ban M, Liao W, Baker A, Compston A, Thorpe J, Molyneux P, Fraser M, Khadake J, Jones J, Coles A, et al. (2020) Transcript specific regulation of expression influences susceptibility to multiple sclerosis. Eur J Hum Genet 28: 826–834. 10.1038/s41431-019-0569-0 - DOI - PMC - PubMed
    1. Battle A, Mostafavi S, Zhu X, Potash JB, Weissman MM, McCormick C, Haudenschild CD, Beckman KB, Shi J, Mei R, et al. (2014) Characterizing the genetic basis of transcriptome diversity through RNA-sequencing of 922 individuals. Genome Res 24: 14–24. 10.1101/gr.155192.113 - DOI - PMC - PubMed
    1. Cardamone G, Paraboschi EM, Soldà G, Cantoni C, Supino D, Piccio L, Duga S, Asselta R (2019) Not only cancer: The long non-coding RNA MALAT1 affects the repertoire of alternatively spliced transcripts and circular RNAs in multiple sclerosis. Hum Mol Genet 28: 1414–1428. 10.1093/hmg/ddy438 - DOI - PubMed
    1. Garrido-Martín D, Borsari B, Calvo M, Reverter F, Guigó R (2021) Identification and analysis of splicing quantitative trait loci across multiple tissues in the human genome. Nat Commun 12: 727. 10.1038/s41467-020-20578-2 - DOI - PMC - PubMed
    1. Gregory SG, Schmidt S, Seth P, Oksenberg JR, Hart J, Prokop A, Caillier SJ, Ban M, Goris A, Barcellos LF, et al. (2007) Interleukin 7 receptor alpha chain (IL7R) shows allelic and functional association with multiple sclerosis. Nat Genet 39: 1083–1091. 10.1038/ng2103 - DOI - PubMed

Publication types