. 2023 Sep 11;14(1):5579.
doi: 10.1038/s41467-023-41364-w.

CD8+ tissue-resident memory T-cell development depends on infection-matching regulatory T-cell types

Affiliations

CD8+ tissue-resident memory T-cell development depends on infection-matching regulatory T-cell types

Leandro Barros et al. Nat Commun. .

Abstract

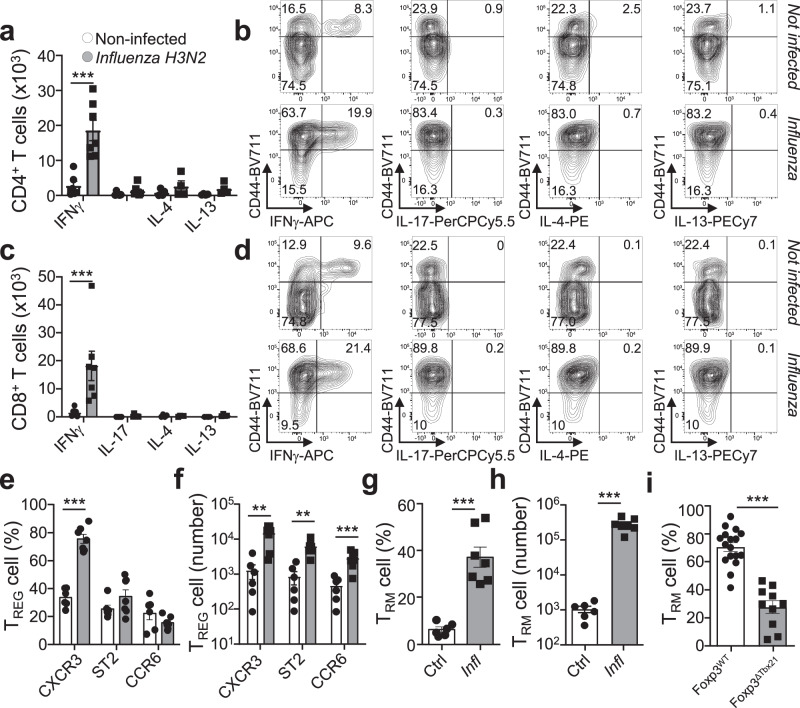
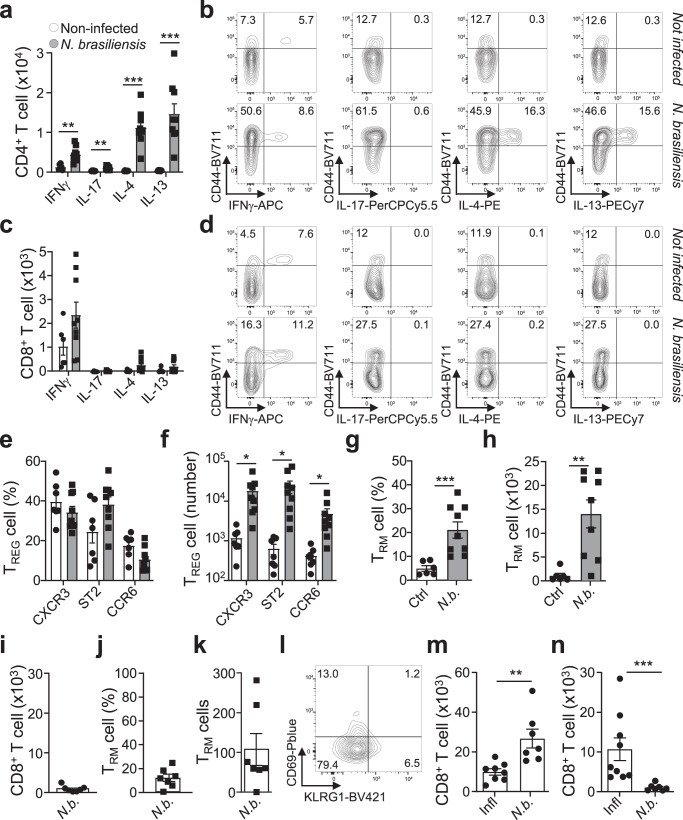
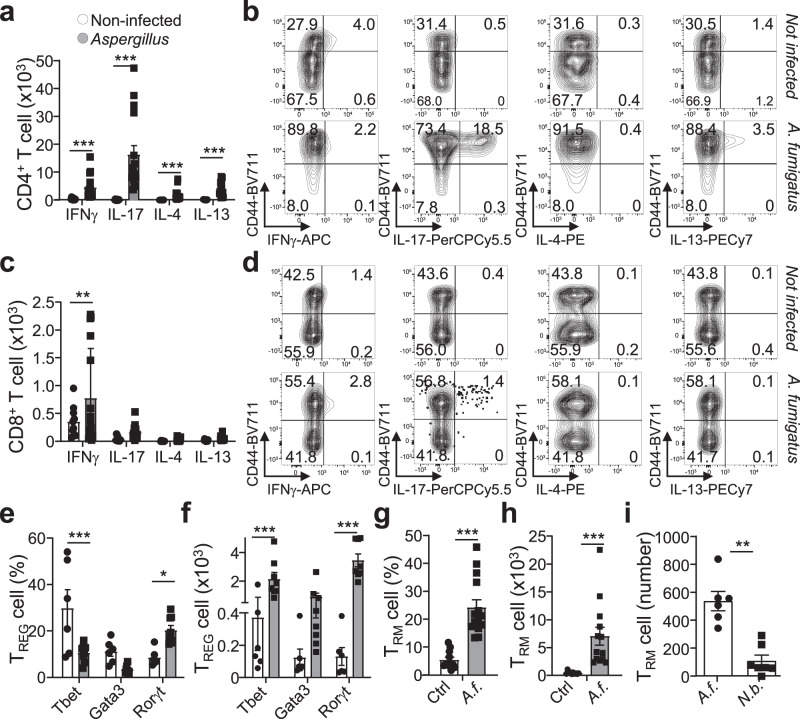
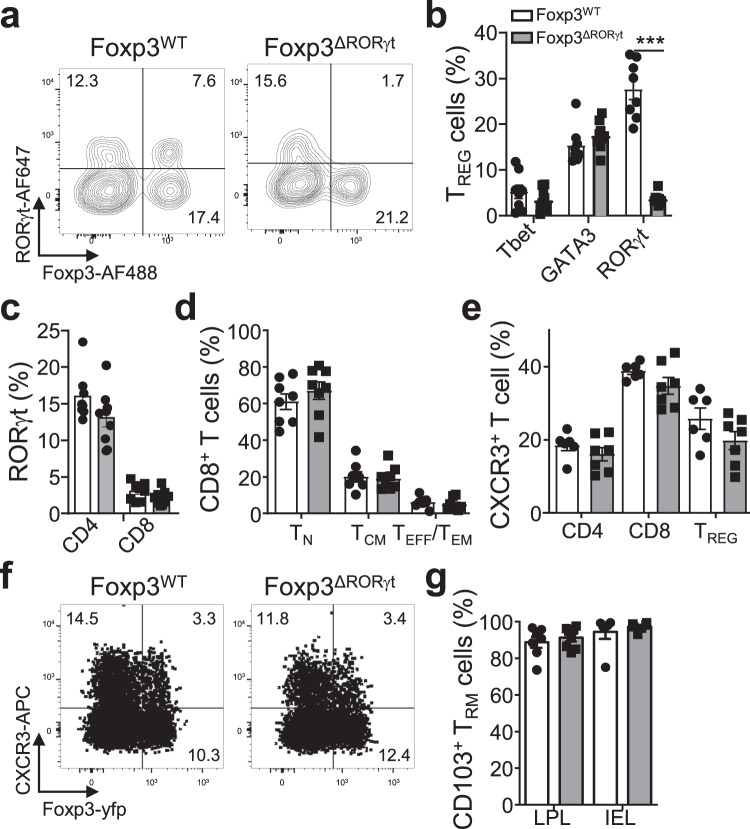
Immunological memory is critical for immune protection, particularly at epithelial sites, which are under constant risk of pathogen invasions. To counter invading pathogens, CD8+ memory T cells develop at the location of infection: tissue-resident memory T cells (TRM). CD8+ T-cell responses are associated with type-1 infections and type-1 regulatory T cells (TREG) are important for CD8+ T-cell development, however, if CD8+ TRM cells develop under other infection types and require immune type-specific TREG cells is unknown. We used three distinct lung infection models, to show that type-2 helminth infection does not establish CD8+ TRM cells. Intracellular (type-1) and extracellular (type-3) infections do and rely on the recruitment of response type-matching TREG population contributing transforming growth factor-β. Nevertheless, type-1 TREG cells remain the most important population for TRM cell development. Once established, TRM cells maintain their immune type profile. These results may have implications in the development of vaccines inducing CD8+ TRM cells.


Conflict of interest statement

The authors declare no competing interests.

Figures

Fig. 1
Fig. 1. Type-1 TREG cells are required for TRM cell generation in the lungs upon Influenza infection.
Mice were infected or not intranasally with 1000 plaque-forming units (PFU) of Influenza A X-31 strain (H3N2). 10 days post-infection lungs were collected, and cells were isolated and analysed via flow cytometry for cytokine production. a Numbers of activated (CD44+) CD4+ T cells producing indicated cytokines (p(Non-infected vs. Influenza H3N2) < 0.000001) and (b) representative flow cytometry plots (n = 6, non-infected, n = 7 infected, N = 3). c Numbers of activated CD8+ T cells producing indicated cytokines (p(Non-infected vs. Influenza H3N2) = 0.000013) and d representative flow cytometry plots (n = 6, non-infected, n = 7 infected, N = 3). e, f Foxp3WT mice (n = 6, non-infected, n = 7 infected, N = 3) were assessed for e percentage (p(Non-infected vs. Influenza H3N2) <0.000001), and f numbers of chemokine receptors CXCR3, ST2 (IL-33R) and CCR6 expression (p(Non-infected vs Influenza H3N2): CXCR3, p = 001415; ST2, p = 0.000502; CCR6, p = 0.001132), on TREG cells (n = 6, non-infected, n = 8 infected, N = 3). g, h Mice analysed via flow cytometry for g percentages of total CD8+ T cells and h numbers of TRM cells, defined as CD69+KLRG1 CD8+ T cells, p(Non-infected vs Influenza H3N2) < 0.0001 (n = 6, N = 3). i Foxp3WT and Foxp3ΔTbx21 mice received CD8CD45.1 T cells intravenously, one day prior to infection. 14 days post infection, lung cells were assessed by flow cytometry for the percentage of TRM cells (CD69+KLRG1-CD103+) in the transferred population (Foxp3WT n = 17, Foxp3ΔTbx21 n = 10, N = 4), p(Foxp3WT vs Foxp3ΔTbx21) <0.0001. Two-sided Mann–Whitney analysis was applied to compare groups. Data are presented as bars of mean ± SEM with single data points.
Fig. 2
Fig. 2. Type-2 Nippostrongylus brasiliensis infection does not yield CD8 TRM cell formation.
Mice were subcutaneously infected or not with 300 stage L3 larvae of Nippostrongylus brasiliensis. 7 days post-infection lungs were collected, and cells were isolated and analysed via flow cytometry for cytokine production, and TRM cells. a Numbers of activated (CD44+) CD4+ T cells producing indicated cytokines, p(Non-infected vs Nippostrongylus brasiliensis): IFN-γ, p = 0.001749; IL-17, p = 0.002537; IL-4, p = 0.000048; IL-13, p = 0.000729, and b representative flow cytometry plots (non-infected n = 6, infected n = 9, N = 3). c Numbers of activated CD8+ T cells producing indicated cytokines and d Representative flow cytometry plots of cytokine production in CD8+ T cells (non-infected n = 6, infected n = 9, N = 3). e, f Foxp3WT mice were assessed for e percentage and f numbers of chemokine receptors CXCR3, ST2 (IL-33R) and CCR6 expression on TREG cells, p(Non-infected vs Nippostrongylus brasiliensis): CXCR3, p = 0.014118; ST2, p = 0.023778; CCR6, p = 0.028885, (non-infected n = 6, infected n = 9, N = 3). g, h CD69+KLRG1 CD8+ TRM cell g percentage of total CD8+ T cells, p(Non-infected vs Nippostrongylus brasiliensis) = 0.0004, and h number, p(Non-infected vs Nippostrongylus brasiliensis)= = 0.0016, in non-infected (control) and infected mice (non-infected n = 6, infected n = 9, N = 3). il Foxp3WT mice received CD8CD45.1 T cells intravenously, one day prior to infection. 14 days post-infection, lung cells were analysed via flow cytometry for i total number of CD8CD45.1 T cells, CD69+KLRG1 CD8+ TRM cell j percentage and k numbers, and l representative flow plot, within the CD8CD45.1 T-cell population (n = 7, N = 3). m, n Comparison of transferred CD8CD45.1 T-cell number in the (m) spleen, p(Influenza vs Nippostrongylus brasiliensis) = 0.0012, or (n) lungs, p(Influenza vs Nippostrongylus brasiliensis) = 0.0002, of mice infected with Influenza and N. brasiliensis (Influenza n = 9, N. brasiliensis n = 7, N = 3). 2-sided Mann–Whitney analysis was applied to compare the differences between groups. Data is presented as bars of mean ± SEM with single data points.
Fig. 3
Fig. 3. Type-3 Aspergillus fumigatus infection yields CD8 T-cell recruitment and TRM cell formation.
Mice were intranasally challenged four times every 3 days with 106 spores of Aspergillus fumigatus. 10 days post-infection lungs were collected, and cells were isolated and analysed via flow cytometry for cytokine production, and TRM cells. a Numbers of activated (CD44+) CD4+ T cells producing indicated cytokines, p(Non-infected vs Aspergillus): IFN-γ, p = 0.005452; IL-17, p = 0.000733; IL-4, p = 0.007702; IL-13, p = 0.000005, and b representative flow cytometry plots of cytokine production in CD4+ T cells (non-infected n = 10, infected n = 12, N = 4). c Numbers of activated CD8+ T cells producing indicated cytokines, p(Non-infected vs Aspergillus): IFN-γ, p = 0.000951, and d representative flow cytometry plots of cytokine production in CD8+ T cells (non-infected n = 10, infected n = 14, N = 4). e, f TREG cells from Foxp3WT mice were assessed for expression in e percentage, p(Non-infected vs Aspergillus): Tbet, p = 0.018008; RORγt, p = 0.001023, and f numbers, p(Non-infected vs Aspergillus): Tbet, p = 0.022810; RORγt, p = 0.000093, of the transcription factors Tbet, GATA-3 and RORγt in (non-infected n = 6, infected n = 7, N = 3). g, h Analysis of CD69+KLRG1- CD8+ TRM cell (g) percentage, p(Non-infected vs Aspergillus) = 0.000017, within the total CD8+ T-cell population, and h number, p(Non-infected vs Aspergillus) = 0.002175 in the lungs of non-infected (control) and infected mice (n = 10, non-infected, n = 14 infected, N = 3). i Comparison of transferred CD8CD45.1 CD69+KLRG1 CD8+ TRM cell numbers in the lungs upon Nippostrongylus brasiliensis (N.b.) or Aspergillus fumigatus (A.f.) infection, p(Aspergillus vs Nippostrongylus brasiliensis)=0.0012, (n = 7, N = 3 for N.b.; n = 6 and N = 3 for A.f). Two-sided Mann-Whitney analysis was applied to compare the differences between groups. Data is presented as bars of mean ± SEM with single data points.
Fig. 4
Fig. 4. Type-3 TREG cells are ablated in Foxp3-CreeYFP RORγtfl/fl mice.
Foxp3WT and Foxp3ΔRORγt mice were analysed at steady-state for TREG, CD4+, and CD8+ T cells in lung, spleen, small intestine lamina propria lymphocytes (LPL), and small intestine intraepithelial lymphocytes (IEL). a Representative flow plot of RORγt expression in LPL TREG cells in both mouse lines. b Percentage of LPL TREG cells expressing Tbet, GATA-3 or RORγt, p(Foxp3WT vs Foxp3ΔRORγt) < 0.000001, (Foxp3WT n = 8, Foxp3ΔRORγt n = 9, N = 3). c Percentage of RORγt expression in CD4+ and CD8+ LPL (Foxp3WT n = 8, Foxp3ΔRORγt n = 9, N = 3). df CD8+ T-cell proportions in the spleen were assessed for d naive (TN CD44CD62L+), central memory (TCM, CD44+CD62L+) and effector memory/effector (TEM/TEFF, CD44+CD62L) and e for CXCR3 expression on CD4+, CD8 and TREG cells, with f representative flow plot (n = 8, N = 3). g Percentage of CD69+KLRG1-CD103+ CD8+ TRM cell in small intestine LPL and IEL in both mouse lines (LPL Foxp3WT n = 7, Foxp3ΔRORγt n = 8, N = 3; IELs n = 6, N = 2). Two-sided Mann–Whitney analysis was applied to compare the differences between groups. Data is presented as bars of mean ± SEM with single data points.
Fig. 5
Fig. 5. Depletion of Type-3 TREG cells reduces TRM cell development in type-3 infections.
a, b In Foxp3WT and Foxp3ΔRORγt mice, CD45.1+ CD8+ T cells were transferred one day prior to infection with 100 mg of segmented filamentous bacteria (SFB)-containing feces, organs were assessed for their TRM cell phenotype (CD69+Eomes-CD103+) 14 days later. Small intestine LPL were collected and assessed for the T-cell phenotype of CD45.1+ CD8+ TRM cells. a Representative flow cytometry plots and b percentages of TRM cells, p(Foxp3WT vs Foxp3ΔRORγt) = 0.0357, (Foxp3WT n = 3, Foxp3ΔRORγt n = 5, N = 3). c, d Intranasal challenge with 1000 PFU of Influenza X-31 strain (H3N2). Lungs were collected and transferred T cells were analysed. c Representative flow cytometry plots of TRM cells within transferred T cells and d percentages of TRM cells in indicated mouse lines (Foxp3WT n = 17, Foxp3ΔRORγt n = 6, N = 4). eg Mice were infected by four intranasal challenges with 106 spores of Aspergillus fumigatus. Lungs were collected and e total CD4+ T cells (Foxp3WT n = 7, Foxp3ΔRORγt n = 6, N = 3), f total TREG cells, p(Foxp3WT vs Foxp3ΔRORγt)=0.0043, and g subsets of TREG cells based on their transcription factor expression, p(Foxp3WT vs Foxp3ΔRORγt) = 0.000001, were analysed (Foxp3WT n = 6 Foxp3ΔRORγt n = 5, N = 3). h, i Mice were transferred with indicated condition receiving control or TGFβ1–deficient TREG cells prior to the first of four intranasal challenges with 106 spores of Aspergillus fumigatus. Lungs were collected and transferred CD45.1 CD8 T cells were analysed. h Representative flow cytometry plots of TRM cells within transferred CD45.1 CD8 T cells and i percentages of TRM cells in all conditions, p(Foxp3WT vs Foxp3ΔRORγt) = 0.0087, p(Foxp3ΔRORγt vs Foxp3ΔRORγt+WT Tregs) = 0.0173, p(Foxp3ΔRORγt vs Foxp3ΔRORγt+TregΔTGFβ1) = 0.0043 (Foxp3WT; Foxp3ΔRORγt n = 6, N = 4; Foxp3ΔRORγt + TREGWT n = 5, N = 2; Foxp3ΔRORγt + TREGΔTGFβ1 n = 5, N = 2). Multiple unpaired t test was used for g, other panels two-sided Mann-Whitney analysis was applied to compare groups. Data is presented as bars of mean ± SEM with single data points.
Fig. 6
Fig. 6. Type-1 and type-3 TREG cells enhance TRM cell development, the identity of which are maintained.
Mice were transferred with CD45.1+ CD8+ T cells one day prior to oral gavage infection. 14 days after transplant, tissues were collected and assessed for their TRM phenotype. a, b Infection with 5000 oocysts of Eimeria vermiformis, a representative flow cytometry plots TRM cells (CD69+Eomes-CD103+) and b percentages of TRM cells in both mouse lines, p(Foxp3WT vs Foxp3ΔRORγt) = 0.0020, (Foxp3WT n = 4, Foxp3ΔRORγt n = 10, N = 3). c, d Mice were challenged four times intranasally with 106 spores of Aspergillus fumigatus. Lungs were collected and transferred T cells were analysed, c representative flow cytometry plots of TRM cells and d percentages of TRM cells in both mouse lines, p(Foxp3WT vs Foxp3ΔTbet) = 0.0238 (Foxp3WT n = 6, N = 4, Foxp3ΔTbx21 n = 3, N = 3). e, f Mice were transferred with CD45.1 CD8 T cells prior to the first of four intranasal challenges with 106 spores of Aspergillus fumigatus. Lungs were collected and transferred CD45.1 CD8+ TRM cells were analysed for e IFNγ or f IL-17 production (Foxp3WT n = 4, Foxp3ΔRORγt n = 7, Foxp3ΔTbx21 n = 4, N = 3). Two-sided Mann–Whitney analysis was applied to compare groups. Data is presented as bars of mean ± SEM with single data points.

References

    1. Konjar S, Ferreira C, Blankenhaus B, Veldhoen M. Intestinal barrier interactions with specialized CD8 T cells. Front. Immunol. 2017;8:1281. - PMC - PubMed
    1. Masopust D, Vezys V, Marzo AL, Lefrancois L. Preferential localization of effector memory cells in nonlymphoid tissue. Science. 2001;291:2413–2417. - PubMed
    1. Reinhardt RL, Khoruts A, Merica R, Zell T, Jenkins MK. Visualizing the generation of memory CD4 T cells in the whole body. Nature. 2001;410:101–105. - PubMed
    1. Konjar S, Ficht X, Iannacone M, Veldhoen M. Heterogeneity of tissue resident memory T cells. Immunol. Lett. 2022;245:1–7. - PubMed
    1. Shiow LR, et al. CD69 acts downstream of interferon-alpha/beta to inhibit S1P1 and lymphocyte egress from lymphoid organs. Nature. 2006;440:540–544. - PubMed

Publication types