. 2023 Sep 11;14(1):5590.
doi: 10.1038/s41467-023-41318-2.

Single-cell transcriptome analysis indicates fatty acid metabolism-mediated metastasis and immunosuppression in male breast cancer

Affiliations

Single-cell transcriptome analysis indicates fatty acid metabolism-mediated metastasis and immunosuppression in male breast cancer

Handong Sun et al. Nat Commun. .

Abstract

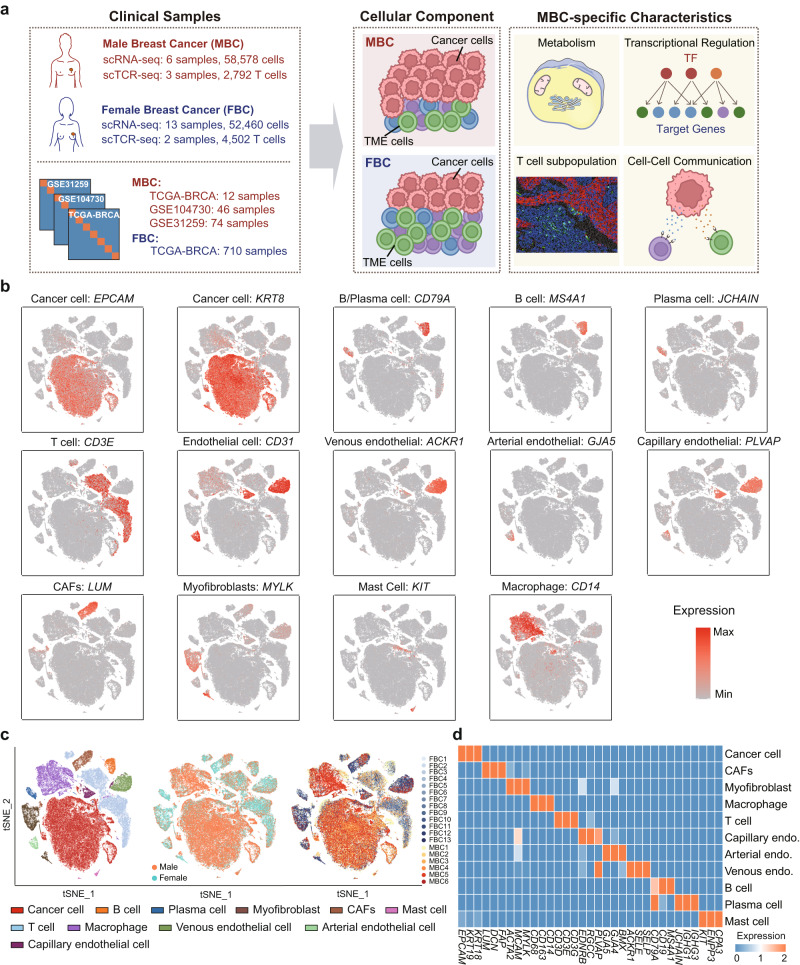
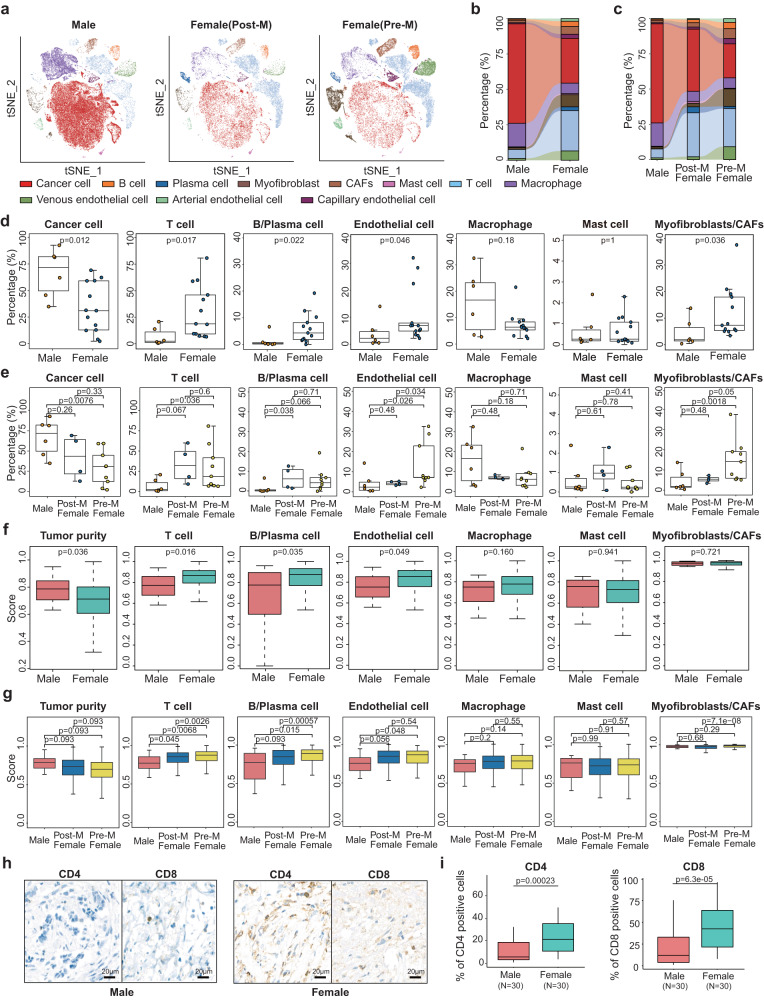
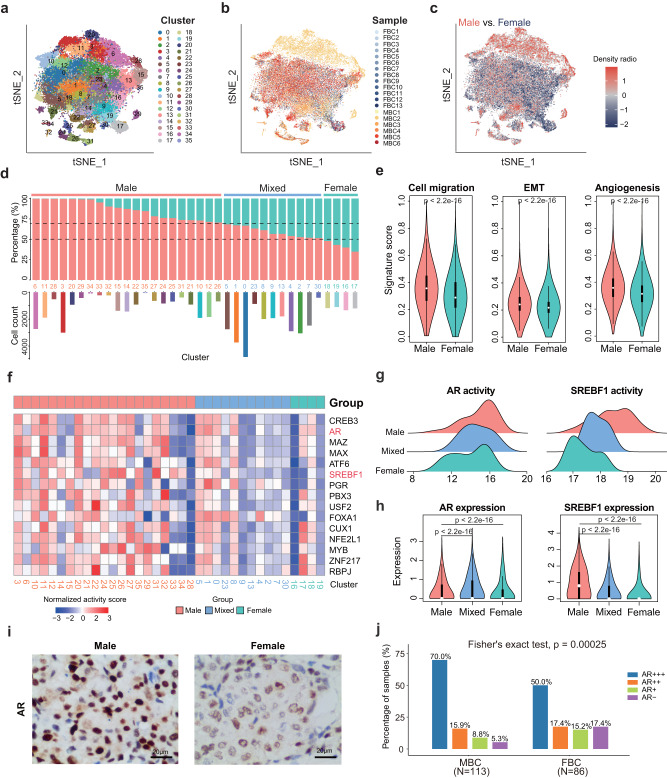
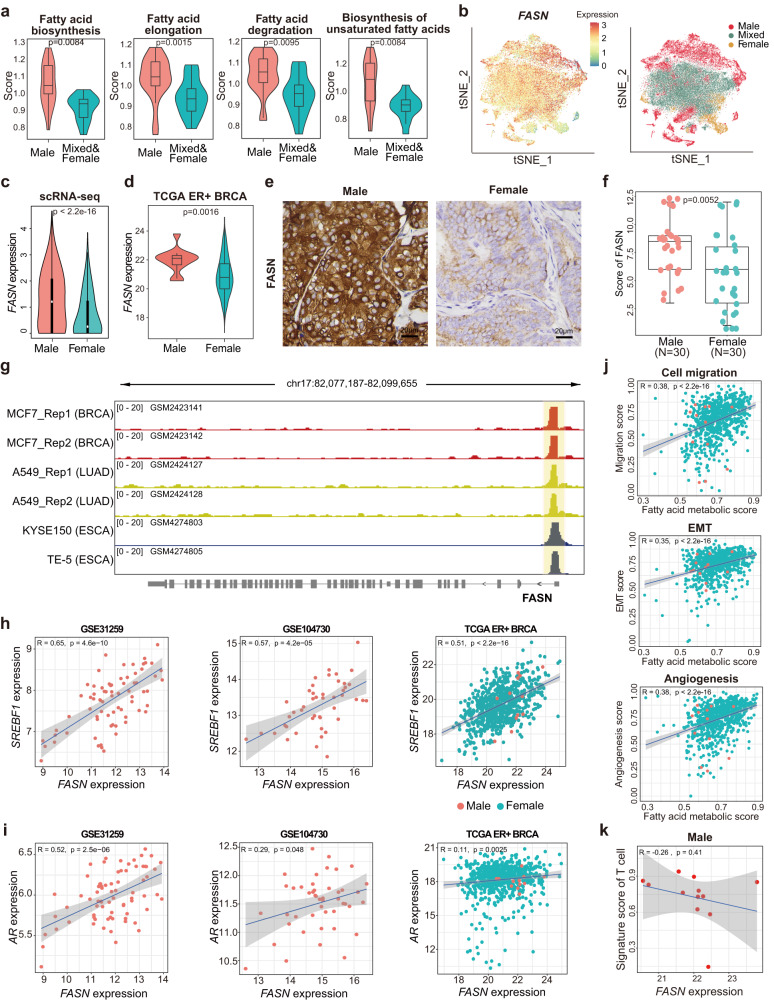
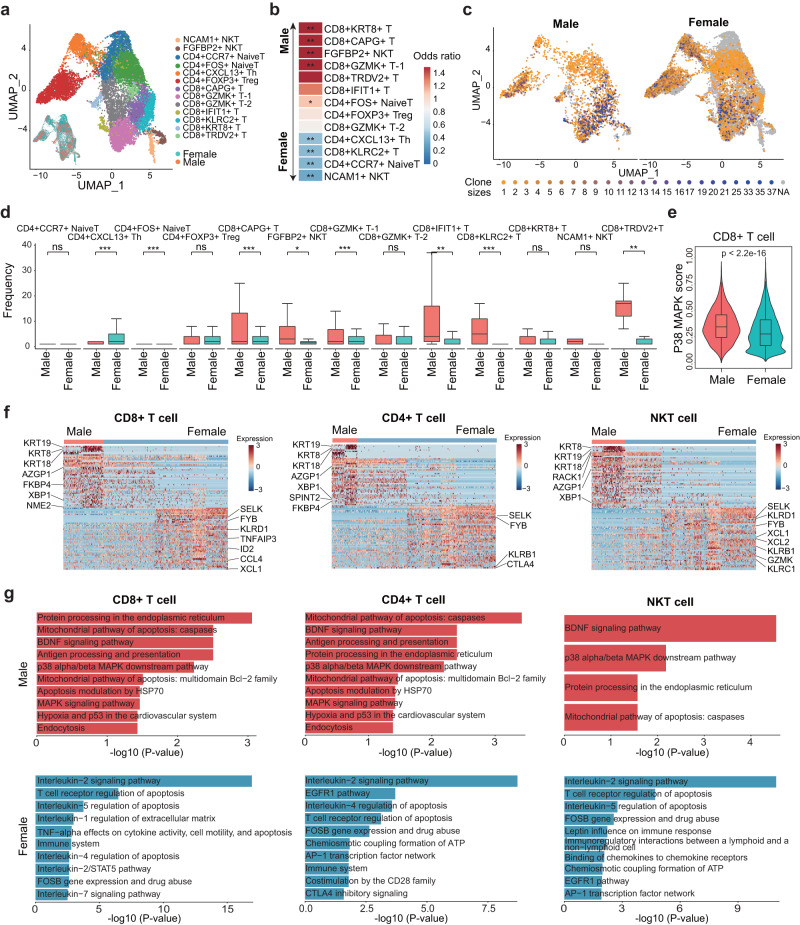
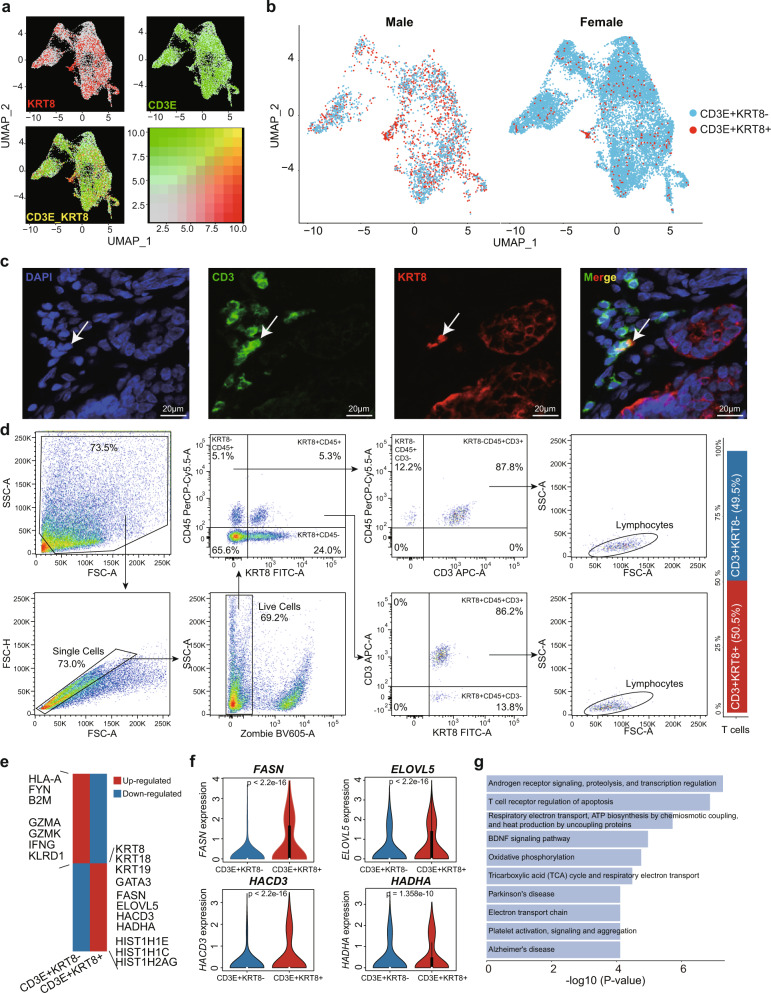
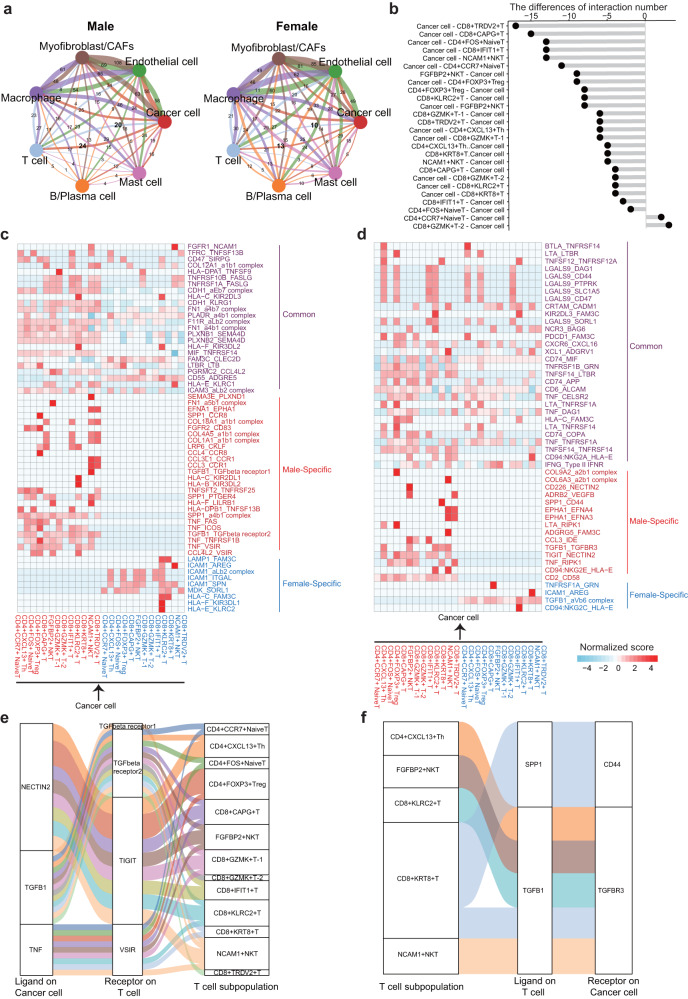
Male breast cancer (MBC) is a rare but aggressive malignancy with cellular and immunological characteristics that remain unclear. Here, we perform transcriptomic analysis for 111,038 single cells from tumor tissues of six MBC and thirteen female breast cancer (FBC) patients. We find that that MBC has significantly lower infiltration of T cells relative to FBC. Metastasis-related programs are more active in cancer cells from MBC. The activated fatty acid metabolism involved with FASN is related to cancer cell metastasis and low immune infiltration of MBC. T cells in MBC show activation of p38 MAPK and lipid oxidation pathways, indicating a dysfunctional state. In contrast, T cells in FBC exhibit higher expression of cytotoxic markers and immune activation pathways mediated by immune-modulatory cytokines. Moreover, we identify the inhibitory interactions between cancer cells and T cells in MBC. Our study provides important information for understanding the tumor immunology and metabolism of MBC.


Conflict of interest statement

The authors declare no competing interests.

Figures

Fig. 1
Fig. 1. Single cell transcriptome landscape of breast cancer patients.
a Schematic workflow for data collection and single-cell analysis process in this study. b Log normalized expression (gray to red) of marker genes of each cell type. c The t-distributed stochastic neighbor embedding (t-SNE) plots of cells types and resources profiled in this study. Colored by cell types, sex and samples respectively. d Heatmap showing genes (columns) that were differentially expressed across various cell types (rows). Scale bar depicting low expression in blue and high expression in orange. Source data are provided as a Source data file.
Fig. 2
Fig. 2. Comparison of cellular components between MBC and FBC samples.
a The t-SNE plot of MBC, postmenopausal and premenopausal FBC samples. Colors represent cell types. b Sankey diagram showing the fraction of each cell type between male and female samples. c Sankey diagram showing the fraction of each cell type between MBC, postmenopausal and premenopausal FBC samples. d Boxplot showing the percentage of cancer cells, T cells, B/Plasma cells, endothelial cells, macrophages, mast cells and myofibroblasts/CAFs in MBC (n = 6) and FBC (n = 13) samples. P value was calculated by two-sided Wilcoxon rank-sum test. e Boxplot showing the percentage of cancer cells, T cells, B/Plasma cells, endothelial cells, macrophages, mast cells and myofibroblasts/CAFs in MBC (n = 6), postmenopausal (n = 4) and premenopausal (n = 9) FBC samples. P value was calculated by two-sided Wilcoxon rank-sum test. f Boxplot showing the tumor purity and signature scores of various cell types between MBC (n = 12) and FBC (n = 710) in TCGA ER+ BRCA cohort. P value was calculated by two-sided Wilcoxon rank-sum test. g Boxplot showing the tumor purity and signature scores of various cell types between MBC (n = 12), postmenopausal (n = 337) and premenopausal (n = 372) FBC samples in TCGA ER+ BRCA cohort. P value was calculated by two-sided Wilcoxon rank-sum test. h Representative images of IHC staining detecting T cell markers CD4 and CD8 expression in MBC (n = 30) and FBC (n = 30) samples, Scale bar, 20 μm. i Boxplot indicating the IHC scores of CD4 and CD8 in 30 ER+ male (lightcoral) and 30 ER+ female (turquoise) patients (identified by the percentage of positive cells). P value was calculated by two-sided Wilcoxon rank-sum test. In dg and i, box plots show median (center line), the upper and lower quantiles (box), and the range of the data (whiskers). Source data are provided as a Source data file.
Fig. 3
Fig. 3. The transcriptional differences of cancer cells between MBC and FBC samples.
a Unsupervised clustering of 53, 343 cancer cells. b T-SNE plot of cancer cells colored by samples. c The density ratio of the t-SNE projections of cancer cells from male and female samples. The t-SNE visualization is split into 200 × 200 bins. Red represents higher percentage of male cancer cell; Blue represents higher percentage of female cancer cells. d Upper: barplot showing the fraction of cancer cells from male and female samples in each cluster. Bottom: barplot showing the number of cells in each cluster. The clusters were ordered by the proportion of cancer cells from male samples. Lightcoral represents male clusters, turquoise represents female clusters and lightblue represents mixed clusters (see “Methods”). e Violin plots showing the ssGSEA scores of cell migration, EMT, and angiogenesis of cancer cells from male (n = 37270 cells) and female (n = 16073 cells) samples. P value was calculated by two-sided Wilcoxon rank-sum test. f Heatmap showing the activity scores of transcription factors (TFs) in cancer cells from male (lightcoral), female (turquoise), and mixed (lightblue) clusters. g Ridgeline plot showing the activity levels of MBC-specific TFs in cancer cells from male, female, and mixed clusters. h Violin plots showing the expression levels of MBC-specific TFs in cancer cells from male (n = 21794 cells), female (n = 4827 cells), and mixed (n = 26722 cells) clusters. P value was calculated by two-sided Wilcoxon rank-sum test. i Representative images of IHC staining detecting AR expression in MBC (n = 113) and FBC (n = 86) samples Scale bar, 20 μm. j Barplot showing the percentage of AR-negative, AR+, AR++, and AR+++ samples from MBC (n = 113) and FBC (n = 86) ER+ patients. P value was calculated by Fisher’s exact test. In e and h, box plots show median (center line), the upper and lower quantiles (box), and the range of the data (whiskers). Source data are provided as a Source data file.
Fig. 4
Fig. 4. Identification of the specifically activated metabolic pathways in cancer cells of MBC sample.
a Violin boxplots showing the signature scores of fatty acid metabolic pathways in cancer cells of male (lightcoral) and mixed/female (turquoise) clusters. P value was calculated by two-sided Wilcoxon rank-sum test and adjusted for multiple testing using the Benjamini–Hochberg method. b Left: t-SNE plot showing the FASN expression in cancer cells, color coding for the expression level of FASN (blue to red). Right: t-SNE plot of cancer cells colored by Male, Mixed, and Female clusters. c Violin plot of FASN expression in cancer cells from male (n = 37270 cells) and female (n = 16073 cells) samples. P value was calculated by two-sided Wilcoxon rank-sum test. d Violin-boxplots showing the FASN expression among male (n = 12) and female (n = 710) samples in TCGA ER+ BRCA cohort. P value was calculated by two-sided Wilcoxon rank-sum test. e Representative images of IHC staining detecting FASN expression in MBC (n = 30) and FBC (n = 30) samples. Scale bar, 20 μm. f Boxplot indicating the IHC score of FASN in MBC (n = 30) and FBC (n = 30) samples. P value was calculated by two-sided Wilcoxon rank-sum test. g IGV plots showing the genomic binding site of SREBF1 on gene FASN in various cancer cell lines. The region covered by yellow box represents promoter. h The Pearson correlation analysis between the expression of FASN and SREBF1 in independent breast cancer datasets. The color of point represents male (lightcoral) and female (turquoise). i The Pearson correlation analysis between the expression of FASN and AR in independent breast cancer datasets. The color of point represents male (lightcoral) and female (turquoise).  j The Pearson correlation analysis between the scores of metastasis-related signatures and fatty acid metabolic pathway in TCGA ER+ BRCA cohort. The color of point represents male (lightcoral) and female (turquoise). k The Pearson correlation analysis between FASN expression and the signature score of T cells for MBC samples in TCGA ER+ BRCA cohort. In a, c, d, f, box plots show median (center line), the upper and lower quantiles (box), and the range of the data (whiskers). In hk, 95% confidence interval (CI) is indicated with gray color. Source data are provided as a Source data file.
Fig. 5
Fig. 5. Characterization of subpopulations and clone sizes of T cells in MBC and FBC samples based on scRNA-seq and scTCR-seq.
a UMAP plot showing the subpopulations of T cells. b Heatmap showing the odds ratio of each T cell subpopulation calculated by Fisher’s exact test. *P < 0.05; **P < 0.01. Red color represents subpopulations enriched in MBC samples, and blue color represents subpopulations enriched in FBC samples. c UMAP plot showing the clone sizes of T cells in MBC (left) and FBC (right) samples. d Boxplot showing the TCR clone sizes of T cell subpopulations in MBC (n = 3031 cells) and FBC (n = 12,659 cells) samples. Lightcoral represents male and turquoise represents female. P value was calculated by two-sided Wilcoxon rank-sum test. *P < 0.05; **P < 0.01; ***P < 0.001; ns: P > 0.05. e Violin plot of p38 MAPK activity in CD8 + T cells from MBC (n = 1664 cells) and FBC (n = 5248 cells) samples. Lightcoral represents male and turquoise represents female. P value was calculated by two-sided Wilcoxon rank-sum test. f Heatmap showing the differentially expressed genes between MBC and FBC T cells, including CD4 + , CD8 + , and NKT cells. g The significant pathways enriched by the differentially expressed genes. Biological pathways in BioPlanet database were used in the enrichment analysis. Red color represents pathways enriched in MBC samples, and blue color represents pathways enriched in FBC samples. In d, e, box plots show median (center line), the upper and lower quantiles (box), and the range of the data (whiskers). Source data are provided as a Source data file.
Fig. 6
Fig. 6. Characteristics of the CD3E + KRT8 + T cells.
a UMAP plot of KRT8 (gray to red) and CD3E (gray to green) expression in T cells. b UMAP plot showing the distribution of CD3E + KRT8- (blue) and CD3E + KRT8+ (red) T cells in MBC (left) and FBC (right) samples. c The immunofluorescence staining of KRT8 and CD3 in an MBC sample. White arrow indicates the CD3 + KRT8 + T cell. Scale bar, 20 μm. Experiments were conducted in triplicate. d Full gating strategy of flow cytometry analysis for the identification of KRT8+ and KRT8- T cells in an MBC sample. e Heatmap showing the differentially expressed genes between CD3E + KRT8- and CD3E + KRT8 + T cells. Red represents up-regulated genes and blue represents down-regulated genes. f The violin plot of FASN, ELOVL5, HACD3 and HADHA expression in CD3E + KRT8− (n = 14085 cells) and CD3E + KRT8 + (n = 1605 cells) T cells. P value was calculated by two-sided Wilcoxon rank-sum test. g Gene set enrichment analysis of up-regulated genes in CD3E + KRT8 + T cells by BioPlanet database. In f, box plots show median (center line), the upper and lower quantiles (box), and the range of the data (whiskers). Source data are provided as a Source data file.
Fig. 7
Fig. 7. Analysis of cell-cell communications in MBC and FBC samples.
a The number of intercellular communications among different cell types in MBC and FBC samples. The line color represents cell types, and the line thickness represents interaction numbers. b The differences of interaction numbers of cancer cells and T cell subtypes between MBC and FBC samples. c, d Heatmap showing the common (purple), male-specific (red) and female-specific (blue) ligand-receptor pairs in MBC and FBC samples. e, f Sankey plot showing the representative examples of male-specific ligand-receptor pairs. Source data are provided as a Source data file.

References

    1. Brinton LA, et al. Prediagnostic sex steroid hormones in relation to male breast cancer risk. J. Clin. Oncol. 2015;33:2041–2050. doi: 10.1200/JCO.2014.59.1602. - DOI - PMC - PubMed
    1. Korde LA, et al. Multidisciplinary meeting on male breast cancer: summary and research recommendations. J. Clin. Oncol. 2010;28:2114–2122. doi: 10.1200/JCO.2009.25.5729. - DOI - PMC - PubMed
    1. Wang F, et al. Overall mortality after diagnosis of breast cancer in men vs women. JAMA Oncol. 2019;5:1589–1596. doi: 10.1001/jamaoncol.2019.2803. - DOI - PMC - PubMed
    1. Ottini L, et al. HER2-positive male breast cancer: an update. Breast Cancer. 2010;2:45–58. - PMC - PubMed
    1. Piera R, Valentina S, Mario F, Matteo G, Laura O. Breast cancer: not only a “woman’s” disease. Curr. Womens Health Rev. 2012;8:55–64. doi: 10.2174/157340412799079066. - DOI

Publication types