. 2023 Sep 11;14(1):5595.
doi: 10.1038/s41467-023-41351-1.

Deficiency of endothelial sirtuin1 in mice stimulates skeletal muscle insulin sensitivity by modifying the secretome

Affiliations

Deficiency of endothelial sirtuin1 in mice stimulates skeletal muscle insulin sensitivity by modifying the secretome

Qiuxia Li et al. Nat Commun. .

Abstract

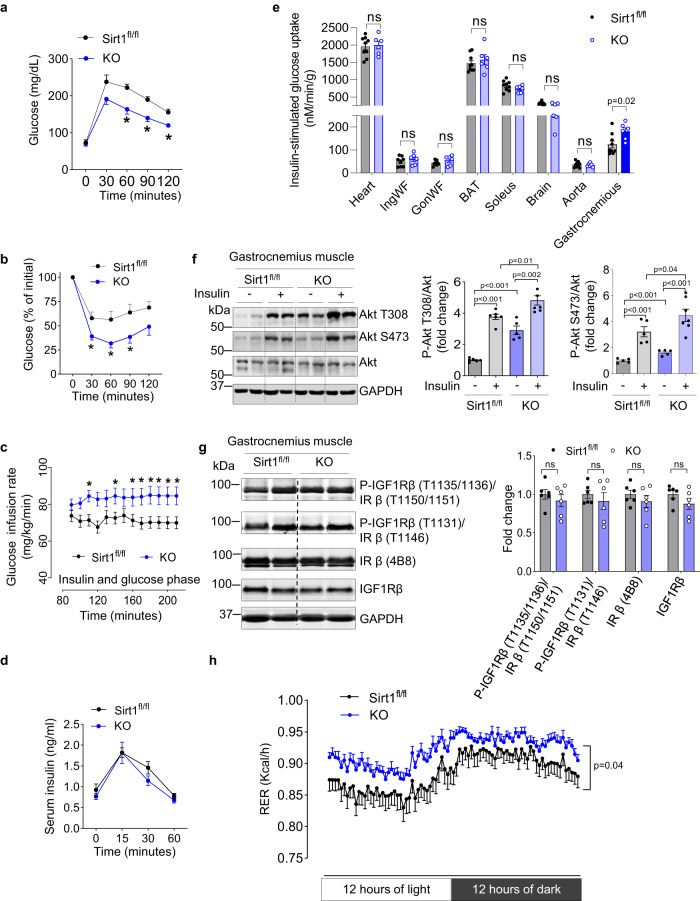
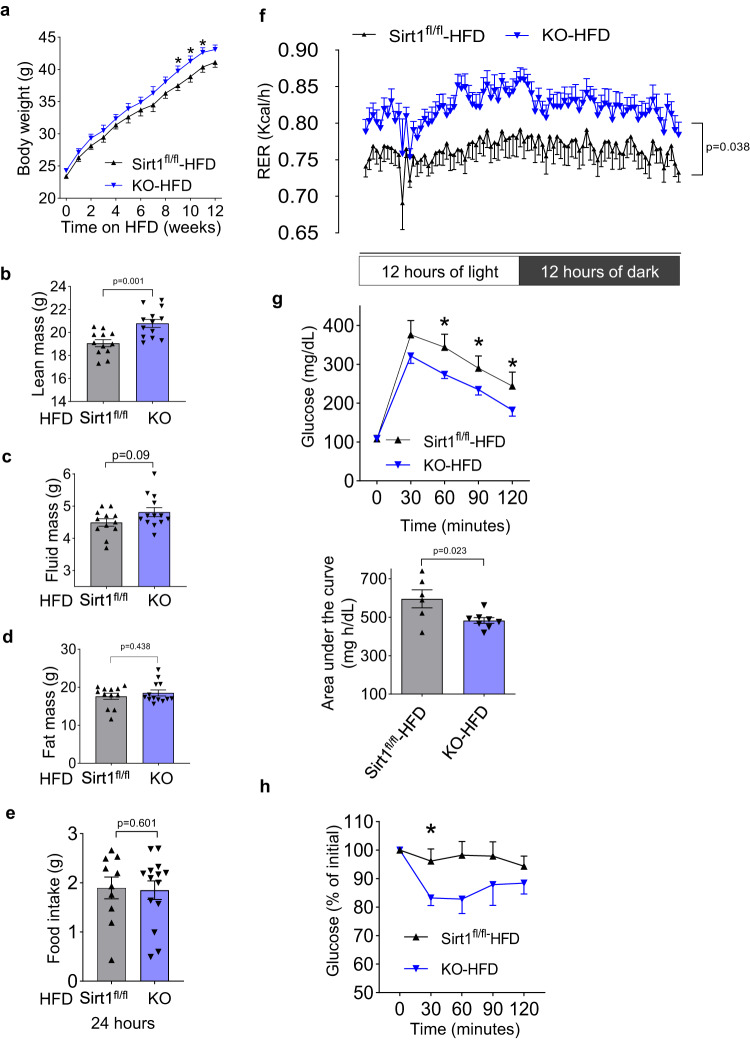
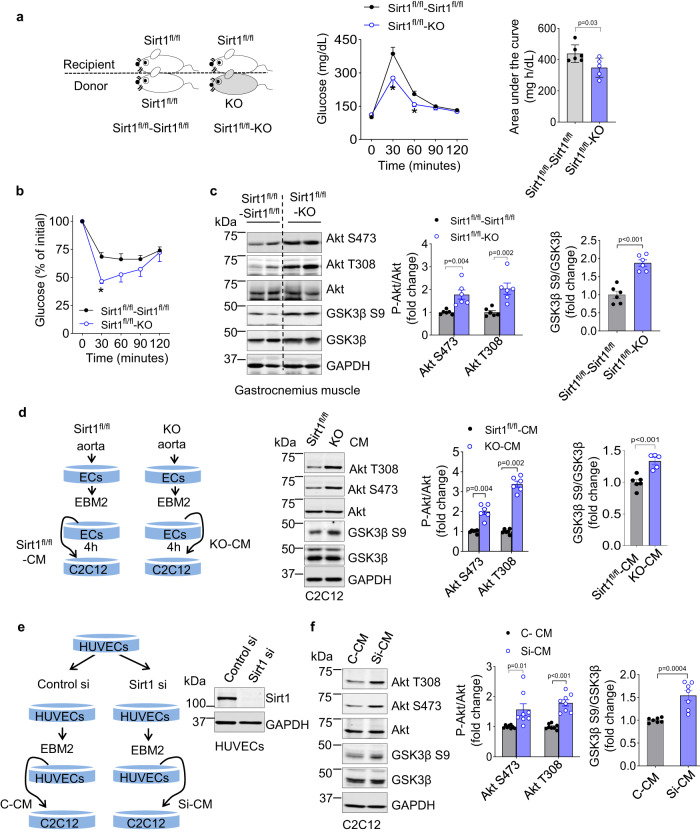
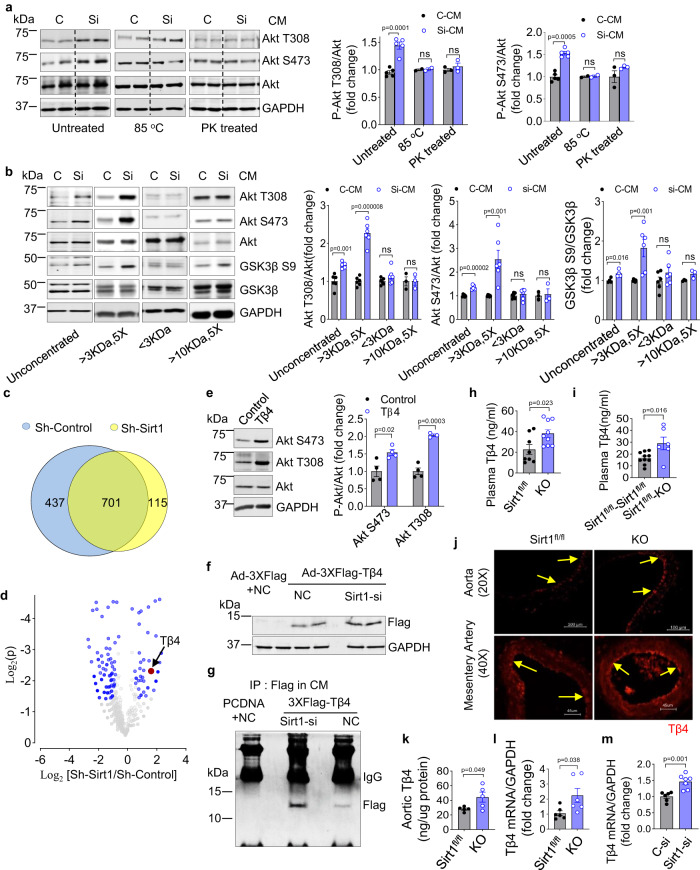
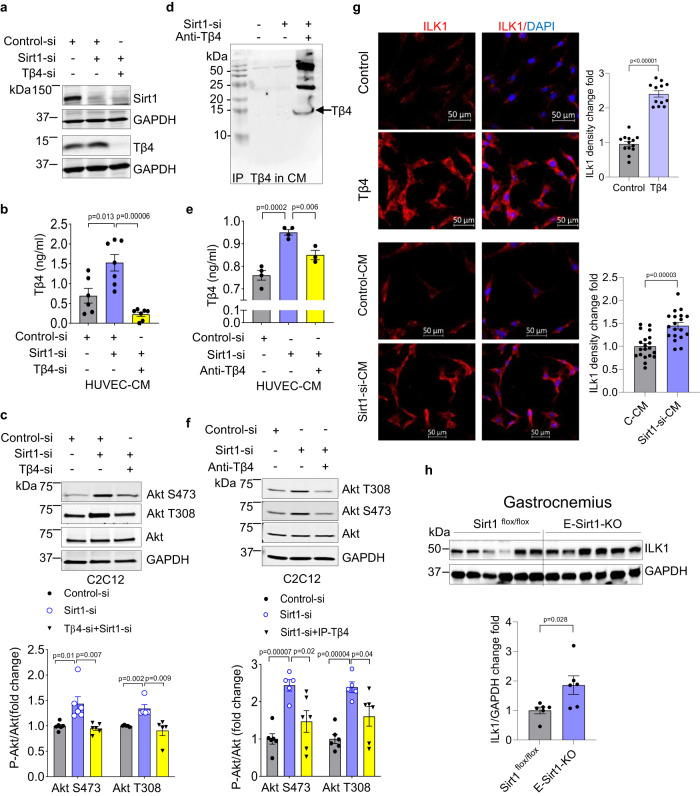
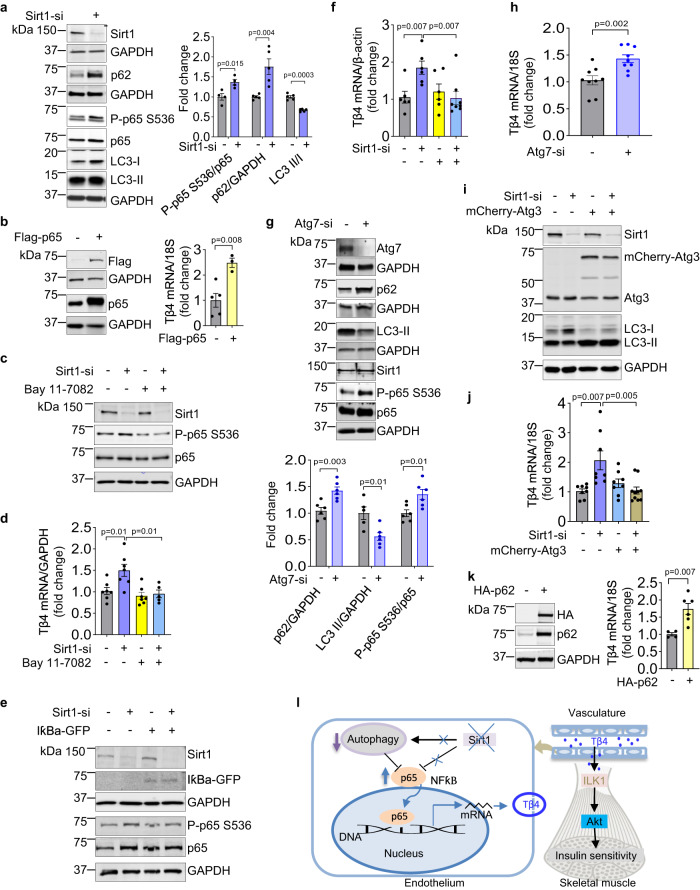
Downregulation of endothelial Sirtuin1 (Sirt1) in insulin resistant states contributes to vascular dysfunction. Furthermore, Sirt1 deficiency in skeletal myocytes promotes insulin resistance. Here, we show that deletion of endothelial Sirt1, while impairing endothelial function, paradoxically improves skeletal muscle insulin sensitivity. Compared to wild-type mice, male mice lacking endothelial Sirt1 (E-Sirt1-KO) preferentially utilize glucose over fat, and have higher insulin sensitivity, glucose uptake, and Akt signaling in fast-twitch skeletal muscle. Enhanced insulin sensitivity of E-Sirt1-KO mice is transferrable to wild-type mice via the systemic circulation. Endothelial Sirt1 deficiency, by inhibiting autophagy and activating nuclear factor-kappa B signaling, augments expression and secretion of thymosin beta-4 (Tβ4) that promotes insulin signaling in skeletal myotubes. Thus, unlike in skeletal myocytes, Sirt1 deficiency in the endothelium promotes glucose homeostasis by stimulating skeletal muscle insulin sensitivity through a blood-borne mechanism, and augmented secretion of Tβ4 by Sirt1-deficient endothelial cells boosts insulin signaling in skeletal muscle cells.


Conflict of interest statement

The authors declare no competing interests.

Figures

Fig. 1
Fig. 1. Absence of endothelial Sirt1 in male mice stimulates insulin sensitivity.
a Glucose tolerance test in Sirt1fl/fl mice (n = 7) vs. KO mice (n = 9), *p < 0.05. b Insulin tolerance test in Sirt1fl/fl mice (n = 10) vs. KO mice (n = 8), *p <  0.05. c Glucose infusion rates during hyperinsulinemic-euglycemic clamps in Sirt1fl/fl mice (n = 14) vs. KO mice (n = 11), *p  <  0.05). d Serum insulin levels during glucose tolerance test in Sirt1fl/fl mice (n = 8) vs. KO mice (n = 10), (p  >  0.05). e Insulin-stimulated glucose uptake in tissues of Sirt1fl/fl mice (n = 9) vs. KO mice (n = 6), ns p > 0.05, *p = 0.022. f Basal and insulin-stimulated Akt phosphorylation in gastrocnemius muscle of Sirt1fl/fl mice (n = 6), Sirt1fl/fl-insulin mice (n = 6), KO mice (n = 5), and KO-insulin mice (n = 7). g IR/IGF1R phosphorylation in gastrocnemius of Sirt1fl/fl mice (n = 6) vs. KO mice (n = 6). ns p > 0.05. h Respiratory exchange ratio (RER) in Sirt1fl/fl (n = 10) and KO mice (n = 13). p = 0.044. Data are shown as mean ± SEM. Two-tailed unpaired Student’s t test was used. In (a, b, c, d, and h), black line represents Sirt1fl/fl mice, and blue line represents KO mice. In (e, f, and g), gray bar represents Sirt1fl/fl mice, and blue bar represents KO mice. Each dot represents one mouse. Sirt1fl/fl Sirt1flox/flox mice, and KO E-Sirt1-KO mice. Source data are provided as a Source Data file.
Fig. 2
Fig. 2. Absence of endothelial Sirt1 in male mice partially protects from diet-induced obesity and insulin resistance.
Mice were fed high-fat diet (HFD) for 12 weeks. a Bodyweight of Sirt1fl/fl mice (n = 18) vs. KO mice (n = 20), *p <  0.05. b Lean mass of Sirt1fl/fl mice (n = 12) vs. KO mice (n = 13), p = 0.001. c Fluid mass of Sirt1fl/fl mice (n = 12) vs. KO mice (n = 13), p = 0.09. d Fat mass of Sirt1fl/fl mice (n = 12) vs. KO mice (n = 13), p = 0.438. e Food intake of Sirt1fl/fl mice (n = 10) vs. KO mice (n = 14), p = 0.601. f 24 h respiratory exchange ratio (RER) of Sirt1fl/fl mice (n = 8) vs. KO mice (n = 8), p = 0.038. g Glucose tolerance test in Sirt1fl/fl (n = 6) vs. KO (n = 8) mice, *p  < 0.05 (upper) with area under the curve, p = 0.023 (lower); and (h) Insulin tolerance test in Sirt1fl/fl (n = 6) and KO (n = 5) mice, *p = 0.038. Data are shown as mean ± SEM. Two-tailed unpaired Student’s t test was used. In (a, f, g, and h), black line represents Sirt1fl/fl -HFD mice, and blue line represents KO-HFD mice. In (b, c, d, e, and g), gray bar represents Sirt1fl/fl-HFD mice, and blue bar represents KO-HFD mice. Each dark triangle represents one mouse. Sirt1fl/fl Sirt1flox/flox mice, KO E-Sirt1-KO mice. Source data are provided as a Source Data file.
Fig. 3
Fig. 3. Enhanced insulin sensitivity and Akt signaling in male mice and cells deficient for endothelial Sirt1 is transferable via the systemic circulation and conditioned medium.
a, b Parabiosis to E-Sirt1-KO stimulates whole-body insulin sensitivity and Akt signaling in gastrocnemius of Sirt1fl/fl mice when parabiosed with Sirt1fl/fl (n = 6 pairs of mice) or with KO mice (n = 5 pairs of mice). a Parabiosis model and glucose tolerance test (*p < 0.05) with area under the curve (*p  = 0.04); b Insulin tolerance test (*p = 0.001), and c Akt and GSK3β phosphorylation in gastrocnemius muscle in Sirt1fl/fl mice parabiosed with Sirt1fl/fl (n = 6 pairs of mice) vs. KO mice (n = 6 pairs of mice); d Akt and GSK3β phosphorylation in C2C12 skeletal myotubes incubated with conditioned medium from aortic endothelial cells of Sirt1fl/fl (n = 6 independent experiments) vs. KO (n = 6 independent experiments); e Expression of Sirt1 in HUVECs transfected with Sirt1 siRNA or control siRNA; f Akt and GSK3β phosphorylation in C2C12 myotubes incubated with CM from HUVECs transfected with control siRNA (n = 8 independent experiments) vs. Sirt1 siRNA (n = 8 independent experiments). Representative blots are shown. Data are shown as mean ± SEM. Two-tailed unpaired Student’s t test was used. In (a, b), black line or gray bar represents Sirt1fl/fl-Sirt1fl/fl pair, and blue line or bar represents Sirt1fl/fl-KO pair. In d, f, the gray bars represent control-CM treated groups, and blue bars represent KO-CM or si-CM treated group. Each dark dot or blue circle represents one sample. EBM2 Endothelial Basic Medium 2. Sirt1fl/fl Sirt1flox/flox. KO E-Sirt1-KO mice. Control-si control siRNA, Sirt1-si Sirt1 siRNA. C-CM control siRNA conditioned medium, Si-CM Sirt1 siRNA conditioned medium. Source data are provided as a Source Data file.
Fig. 4
Fig. 4. Deficiency of Sirt1 augments Tβ4 in the endothelial secretome, and male mice lacking endothelial Sirt1 have higher vascular and plasma Tβ4.
a, b The secretome of endothelial cells in which Sirt1 is silenced boosts Akt signaling in skeletal myoblasts via a small protein. a Akt phosphorylation in C2C12 myotubes incubated with conditioned medium of Sirt1-silenced and control HUVECs that is untreated (n = 5 independent experiments), denatured by heating (n = 2 independent experiments) or treated with proteinase K (n = 3 independent experiments, ns p > 0.05); and (b) Akt and GSK3β phosphorylation in C2C12 myotubes incubated with conditioned medium subjected to size-exclusion filtration. The conditioned medium was collected from Sirt1-silenced and control HUVECs and subjected to size-exclusion filtration. The groups include unconcentrated group (C-CM, n = 6 independent experiments) vs. si-CM (n = 5 independent experiments), >3kDa 5X group (C-CM, n = 6 independent experiments) vs. si-CM (n = 6 independent experiments), <3kDa group (C-CM, n = 6 independent experiments) vs. si-CM (n = 6 independent experiments), and >10kDa 5X group (C-CM, n = 3 independent experiments) vs. si-CM (n = 3 independent experiments). ns p > 0.05. Representative blots are shown. c, d Proteomics showing upregulation of Tβ4 in CM of Sirt1-silenced HUVECs. c Venn diagram of proteins identified in secretomes of CM of HUVECs transfected with control-siRNA (Sh-Control) and Sirt1-siRNA (Sh-Sirt1). d Volcano plot of proteins in secretomes of CM of Sh-Control and Sh-Sirt1 HUVECs. Relative up- and down-regulation of secreted proteins are expressed as Log2 [Sh-Sirt1/Sh-Control], and significance of change in expression as log2 p value. A total of 183 proteins (blue dots, p < 0.05) showed significantly different expression. e Recombinant Tβ4 (40 ng/mL for 40 min) stimulates Akt phosphorylation in C2C12 myotubes (control, n = 4 independent experiments) vs. Tβ4 (n = 4 independent experiments). Representative blots with quantification are shown. f–m Deficiency of endothelial Sirt1 boosts Tβ4 expression and secretion. f, g Sirt1 downregulation (si-Sirt1) increases exogenous Flag-tagged Tβ4 immunoprecipitated in CM of HUVECs. Representative blots are shown. h Plasma Tβ4 is upregulated in KO mice (n = 9) vs. Sirt1fl/fl (n = 8), p = 0.023. i Plasma Tβ4 is upregulated in Sirt1fl/fl mice parabiosed with KO mice (n = 6) vs. Sirt1fl/fl mice parabiosed with Sirt1fl/fl mice (n = 10), p = 0.016. j Immunofluorescent staining showing upregulation of Tβ4 (red) in aorta and mesenteric artery endothelium (yellow arrows) of E-Sirt1-KO mice; representative images are shown. k Tβ4 protein is upregulated in aortas of KO mice (n = 5) vs. Sirt1fl/fl mice (n = 5), p = 0.049. l Tβ4 mRNA is upregulated in aortas of KO mice (n = 6) vs. Sirt1fl/fl mice (n = 6), p = 0.038. m Silencing of Sirt1 (Sirt1-Si) in HUVECs stimulates Tβ4 mRNA expression (C-si, n = 6 independent experiments) vs. Sirt1-si (n = 7 independent experiments), p = 0.001. CM conditioned medium, Sirt1-si Sirt1 siRNA, Tβ4-si Tβ4 siRNA, Tβ4 Thymosin beta 4, C control siRNA, Si Sirt1 siRNA, PK proteinase K, NC control siRNA, IP immunoprecipitation, Sirt1fl/fl Sirt1flox/flox mice, KO E-Sirt1-KO mice. Data are shown as mean ± SEM. Two-tailed unpaired Student’s t test was used. In (a, b, and m), gray bars represent control-CM treated groups, and blue bars represent si-CM treated group. Each dark dot or blue circle represents one sample. In (h, i, k and l), gray bars represent Sirt1fl/fl group, and blue bars represent KO group. Each dark dot or blue circle represents one sample. Source data are provided as a Source Data file.
Fig. 5
Fig. 5. Secreted Tβ4 from Sirt1-deficient endothelial cells mediates Akt phosphorylation in skeletal myotubes.
a Expression of Sirt1 and Tβ4 in HUVECs (Representative immunoblots are shown); and (b) secreted Tβ4 in CM of HUVECs transfected with control-siRNA (n = 6 independent experiments, gray bar), Sirt1-siRNA (n = 7 independent experiments, blue bar), and Tβ4-siRNA + Sirt1-siRNA (n = 7 independent experiments, yellow bar); c Knockdown of Tβ4 in HUVECs abrogates Akt phosphorylation in C2C12 skeletal myotubes incubated with CM of Sirt1-deficient HUVECs. Representative immunoblots are shown. Gray bar is control-siRNA (n = 6 independent experiments), blue bar is Sirt1-siRNA (n = 6 independent experiments), and yellow bar is Tβ4-siRNA+Sirt1-siRNA (n = 6 independent experiments); (d–f) Immuno-depletion of secreted Tβ4 from CM of Sirt1-deficient HUVECs partially abrogates Akt phosphorylation in C2C12 skeletal myotubes. d Immunoprecipitation of secreted Tβ4 from CM of Sirt1-deficient endothelial cells; representative immunoblots are shown. e Concentration of secreted Tβ4 in CM of Sirt1-deficient endothelial cells after immunoprecipitation of Tβ4 (C-CM, n = 4 independent experiments, gray bar), Sirt1-si-CM (n = 4 independent experiments, blue bar), and Sirt1-si+IP Tβ4 (n = 3 independent experiments, yellow bar); and (f) Akt phosphorylation in C2C12 myotubes incubated with CM of Sirt1-deficient HUVECs with or without immuno-depletion of Tβ4; representative immunoblots are shown. Gray bar is Control-si-CM (n = 6 independent experiments), blue bar is Sirt1-si-CM (n = 5 independent experiments), and yellow bar is Sirt1-si+IP Tβ4 (n = 6 independent experiments). g Immunofluorescence showing upregulation of ILK1 (red) in C2C12 myotubes treated with Tβ4 (n = 12 fields examined over 2 samples), or Sirt1-si-CM (n = 19 fields examined over 2 samples) when compared with corresponding control groups (control, n = 13 fields examined over 2 samples, gray bar) and C-CM (n = 20 fields examined over 2 samples, gray bar). h Expression of ILK1 protein in gastrocnemius of E-Sirt1-KO mice (n = 5, gray bar) and Sirt1flox/flox mice (n = 5, blue bar), p = 0.028. Each dark dot, blue circle, or dark triangle represents one sample. HUVECs human umbilical vein endothelial cells, CM conditioned medium, Sirt1-si Sirt1 siRNA, Tβ4-si Tβ4 siRNA. Data are shown as mean ± SEM. Two-tailed unpaired Student’s t test was used. Source data are provided as a Source Data file.
Fig. 6
Fig. 6. Deficiency of endothelial Sirt1 upregulates Tβ4 expression via NF-κB signaling and impairment of autophagy.
a Knockdown of Sirt1 activates NF-κB and inhibits autophagy in endothelial cells. Immunoblotting and quantification of p-p65/p65, p62, and LC3 II/LC3 I in HUVECs transfected with control siRNA (n = 5 independent experiments, gray bar) vs. Sirt1 siRNA (n = 5 independent experiments, blue bar); representative immunoblots are shown. b Overexpression of p65 upregulates endothelial Tβ4 mRNA. Immunoblotting of Flag-tagged p65 and qPCR of Tβ4 mRNA in HUVECs (scramble control, n = 5 independent experiments, gray bar) vs. Flag-p65 (n = 3 independent experiments, yellow bar). P = 0.008; representative immunoblots are shown. c–f Inhibition of NF-κB negates Tβ4 upregulation in Sirt1-deficient endothelial cells. c Immunoblotting of Sirt1, p65, and p-p65; representative immunoblots are shown, and (d) qPCR of Tβ4 mRNA in HUVECs transfected with control siRNA (n = 7 independent experiments, gray bar), Sirt1 siRNA (n = 7 independent experiments, blue bar), treated with Bay 11-7082 only (n = 7 independent experiments, yellow bar), and Sirt1 siRNA + Bay 11-7082 (n = 5 independent experiments, light blue bar); (e) Immunoblotting of Sirt1, IκBα-GFP, p65, and p-p65, and GAPDH; representative immunoblots are shown, and (f) qPCR of Tβ4 mRNA in HUVECs transfected with control siRNA (n = 6 independent experiments, gray bar), Sirt1 siRNA (n = 6 independent experiments, blue bar), IκBα-GFP only (n = 6 independent experiments, yellow bar), and Sirt1-si+ IκBα-GFP (n = 8 independent experiments, light blue bar). g–k Inhibition of autophagy upregulates endothelial Tβ4, and restoration of autophagy negates Tβ4 upregulation in Sirt1-deficient endothelial cells. g Immunoblotting and quantification of Atg7, Sirt1, p62, LC3, p65, and p-p65; representative immunoblots are shown. Gray bar is control siRNA (n = 6 independent experiments), and blue bar is Atg7-si (n = 6 independent experiments); and (h) qPCR of Tβ4 mRNA in HUVECs transfected with control siRNA (n = 9 independent experiments, gray bar) or Atg7 siRNA (n = 9 independent experiments, blue bar). i Immunoblotting of Sirt1, Atg3, LC3; and j qPCR of Tβ4 mRNA in HUVECs transfected with control siRNA (n = 8 independent experiments, gray bar) or Sirt1 siRNA (n = 8 independent experiments, blue bar), mCherry-Atg3 only (n = 8 independent experiments, light blue bar), and Sirt1-si+mCherry-Atg3 (n = 10 independent experiments, brown bar); representative immunoblots are shown. k Overexpression of p62 upregulates Tβ4. Immunoblotting of HA and p62, and qPCR of Tβ4 mRNA in HUVECs transfected with HA-tagged p62 (n = 6 independent experiments, yellow bar) and scramble control (n = 4 independent experiments, gray bar); representative immunoblots are shown. Data are shown as mean ± SEM. Two-tailed unpaired Student’s t test was used. Each dot in the bar figures represents one sample. C-si scramble siRNA, Sirt1-si Sirt1 siRNA, Atg7-si Atg7 siRNA, p-p65 phosphorylation p65, Sirt1fl/fl Sirt1flox/flox mice, KO E-Sirt1-KO mice. Source data are provided as a Source Data file. l Summary of the mechanisms underlying enhanced insulin sensitivity in mice deficient of endothelial Sirt1. Deficiency of endothelial Sirt1 impairs autophagy and stimulates NF-κB signaling to boost Tβ4 expression and secretion that enhances ILK-mediated Akt activity in skeletal muscle cells.

References

    1. Kim JA, Montagnani M, Koh KK, Quon MJ. Reciprocal relationships between insulin resistance and endothelial dysfunction: molecular and pathophysiological mechanisms. Circulation. 2006;113:1888–1904. doi: 10.1161/CIRCULATIONAHA.105.563213. - DOI - PubMed
    1. Wasserman DH, Wang TJ, Brown NJ. The vasculature in prediabetes. Circ. Res. 2018;122:1135–1150. doi: 10.1161/CIRCRESAHA.118.311912. - DOI - PMC - PubMed
    1. Czech MP. Insulin action and resistance in obesity and type 2 diabetes. Nat. Med. 2017;23:804–814. doi: 10.1038/nm.4350. - DOI - PMC - PubMed
    1. Pi X, Xie L, Patterson C. Emerging roles of vascular endothelium in metabolic homeostasis. Circ. Res. 2018;123:477–494. doi: 10.1161/CIRCRESAHA.118.313237. - DOI - PMC - PubMed
    1. Rask-Madsen C, King GL. Endothelium-dependent delivery of insulin to muscle interstitium. Cell Metab. 2011;13:236–238. doi: 10.1016/j.cmet.2011.02.008. - DOI - PMC - PubMed

Publication types