

A thioacetamide-induced liver fibrosis model for pre-clinical studies in microminipig
- PMID: 37696857
- PMCID: PMC10495379
- DOI: 10.1038/s41598-023-42144-8
A thioacetamide-induced liver fibrosis model for pre-clinical studies in microminipig
Abstract
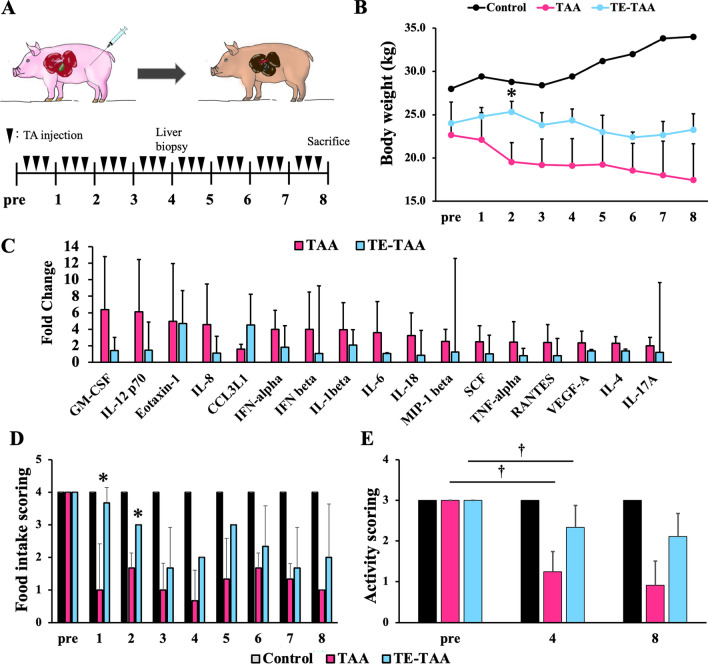
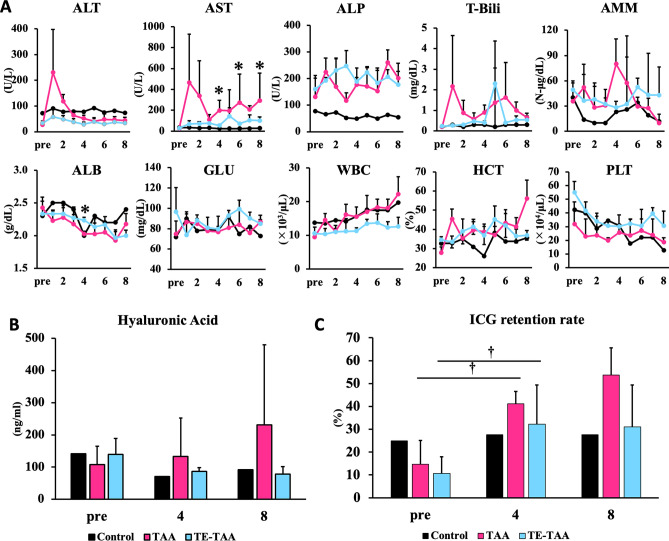
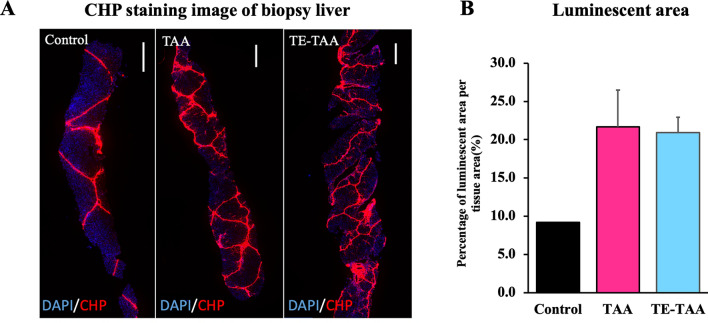
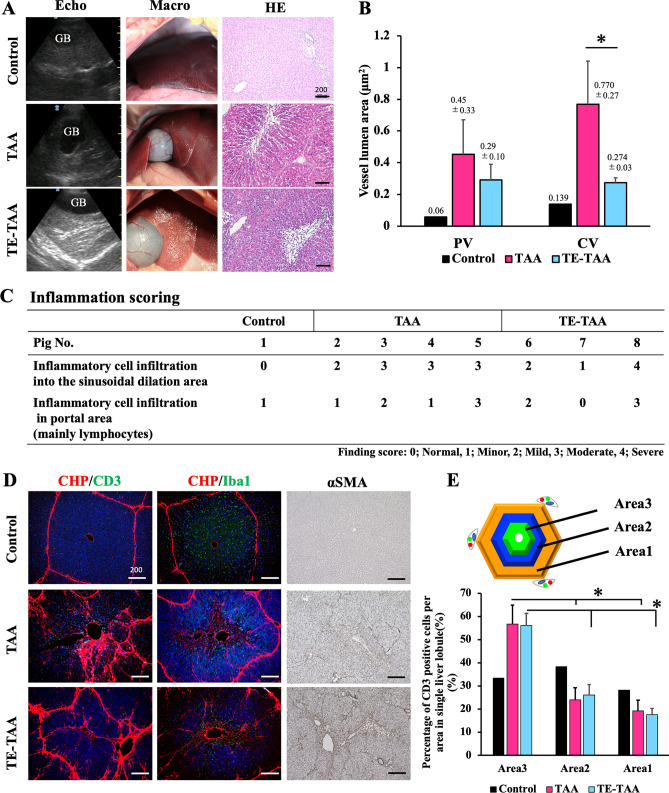
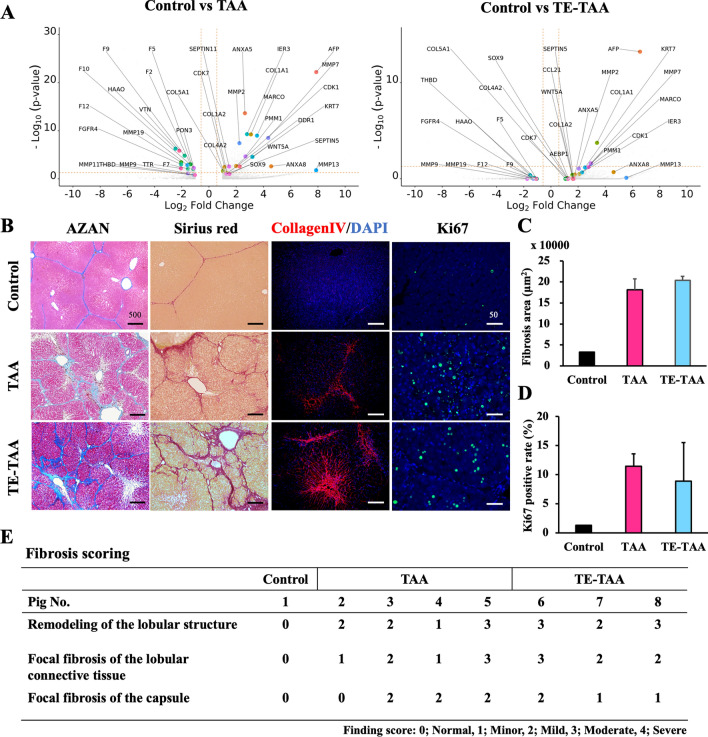
Drug-induced liver fibrosis models are used in normal and immunosuppressed small animals for transplantation and regenerative medicine to improve liver fibrosis. Although large animal models are needed for pre-clinical studies, they are yet to be established owing to drug sensitivity in animal species and difficulty in setting doses. In this study, we evaluated liver fibrosis by administering thioacetamide (TA) to normal microminipig and thymectomized microminipig; 3 times for 1 week (total duration: 8 weeks). The pigs treated with TA showed elevated blood cytokine levels and a continuous liver injury at 8 weeks. RNA-seq of the liver showed increased expression of fibrosis-related genes after TA treatment. Histopathological examination showed degenerative necrosis of hepatocytes around the central vein, and revealed fibrogenesis and hepatocyte proliferation. TA treatment caused CD3-positive T cells and macrophages scattered within the hepatic lobule to congregate near the center of the lobule and increased αSMA-positive cells. Thymectomized pigs showed liver fibrosis similar to that of normal pigs, although the clinical signs tended to be milder. This model is similar to pathogenesis of liver fibrosis reported in other animal models. Therefore, it is expected to contribute to research as a drug discovery and pre-clinical transplantation models.
© 2023. Springer Nature Limited.
Conflict of interest statement
The authors declare no competing interests.
Figures
Similar articles
-
Activation of hepatic stellate cells is associated with cytokine expression in thioacetamide-induced hepatic fibrosis in mice.Lab Invest. 2008 Nov;88(11):1192-203. doi: 10.1038/labinvest.2008.91. Epub 2008 Sep 15. Lab Invest. 2008. PMID: 18794850
-
Emergence of different macrophage populations in hepatic fibrosis following thioacetamide-induced acute hepatocyte injury in rats.J Comp Pathol. 2003 Jan;128(1):41-51. doi: 10.1053/jcpa.2002.0603. J Comp Pathol. 2003. PMID: 12531686
-
Regenerative Effect of Bone Marrow-derived Mesenchymal Stem Cells in Thioacetamide-induced Liver Fibrosis of Rats.Arch Razi Inst. 2019 Sep;74(3):279-286. doi: 10.22092/ari.2018.110029.1120. Epub 2019 Oct 1. Arch Razi Inst. 2019. PMID: 31592593
-
Failure of liver cirrhosis induction by thioacetamide in Nagase analbuminaemic rats.Lab Anim. 2002 Apr;36(2):158-64. doi: 10.1258/0023677021912442. Lab Anim. 2002. PMID: 11943080
-
Molecular mechanisms in thioacetamide-induced acute and chronic liver injury models.Environ Toxicol Pharmacol. 2023 Apr;99:104093. doi: 10.1016/j.etap.2023.104093. Epub 2023 Mar 2. Environ Toxicol Pharmacol. 2023. PMID: 36870405 Review.
Cited by
-
Hepatoprotective Effect of Moringa Oil on Rats under Fungicide Toxicity.Dokl Biochem Biophys. 2023 Dec;513(Suppl 1):S53-S59. doi: 10.1134/S1607672923600367. Epub 2024 Feb 20. Dokl Biochem Biophys. 2023. PMID: 38379081
-
Modulation of liver cholesterol homeostasis by choline supplementation during fibrosis resolution.Heliyon. 2024 Aug 31;10(17):e36727. doi: 10.1016/j.heliyon.2024.e36727. eCollection 2024 Sep 15. Heliyon. 2024. PMID: 39296030 Free PMC article.
-
Novel approach for reconstruction of the three-dimensional biliary system in decellularized liver scaffold using hepatocyte progenitors.PLoS One. 2024 Feb 15;19(2):e0297285. doi: 10.1371/journal.pone.0297285. eCollection 2024. PLoS One. 2024. PMID: 38359035 Free PMC article.
-
Steatotic liver disease induced by TCPOBOP-activated hepatic constitutive androstane receptor: primary and secondary gene responses with links to disease progression.Toxicol Sci. 2024 Aug 1;200(2):324-345. doi: 10.1093/toxsci/kfae057. Toxicol Sci. 2024. PMID: 38710495 Free PMC article.
-
Myeloperoxidase, extracellular DNA and neutrophil extracellular trap formation in the animal models of metabolic dysfunction-associated steatotic liver disease.World J Gastroenterol. 2025 Jul 21;31(27):106166. doi: 10.3748/wjg.v31.i27.106166. World J Gastroenterol. 2025. PMID: 40741100 Free PMC article.
References
-
- Salguero Palacios R, et al. Activation of hepatic stellate cells is associated with cytokine expression in thioacetamide-induced hepatic fibrosis in mice. Lab. Invest. 2008;88:1192–203. - PubMed
-
- Wallace MC, et al. Standard operating procedures in experimental liver research: Thioacetamide model in mice and rats. Lab. Anim. 2015;49:21–29. - PubMed
-
- Li X, Benjamin IS, Alexander B. Reproducible production of thioacetamide-induced macronodular cirrhosis in the rat with no mortality. J. Hepatol. 2002;36:488–493. - PubMed
Publication types
MeSH terms
Substances
LinkOut - more resources
Full Text Sources
Medical
