

Comparison of miRNA transcriptome of exosomes in three categories of somatic cells with derived iPSCs
- PMID: 37696871
- PMCID: PMC10495316
- DOI: 10.1038/s41597-023-02493-5
Comparison of miRNA transcriptome of exosomes in three categories of somatic cells with derived iPSCs
Abstract
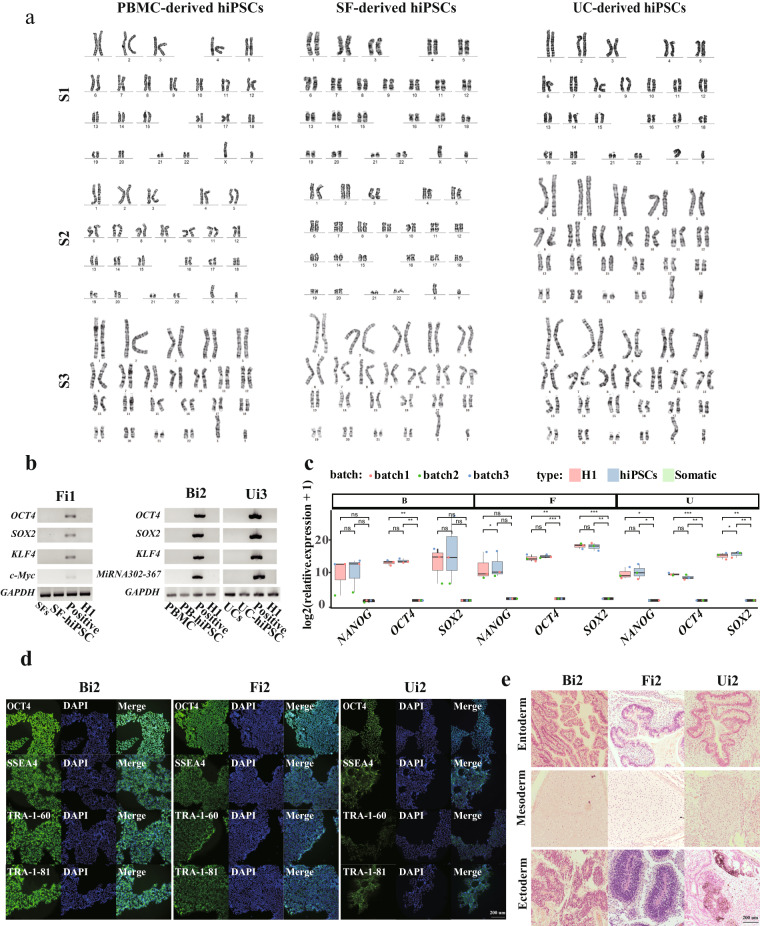
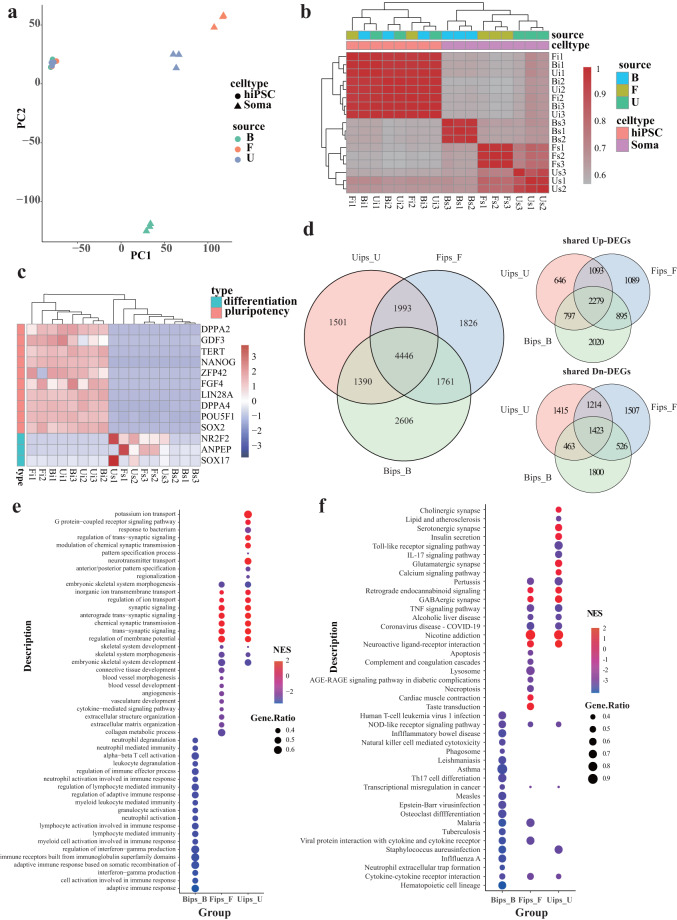
Somatic cells can be reprogrammed into induced pluripotent stem cells (iPSCs) through epigenetic manipulation. While the essential role of miRNA in reprogramming and maintaining pluripotency is well studied, little is known about the functions of miRNA from exosomes in this context. To fill this research gap,we comprehensively obtained the 17 sets of cellular mRNA transcriptomic data with 3.93 × 10¹⁰ bp raw reads and 18 sets of exosomal miRNA transcriptomic data with 2.83 × 10⁷ bp raw reads from three categories of human somatic cells: peripheral blood mononuclear cells (PBMCs), skin fibroblasts(SFs) and urine cells (UCs), along with their derived iPSCs. Additionally, differentially expressed molecules of each category were identified and used to perform gene set enrichment analysis. Our study provides sets of comparative transcriptomic data of cellular mRNA and exosomal miRNA from three categories of human tissue with three individual biological controls in studies of iPSCs generation, which will contribute to a better understanding of donor cell variation in functional epigenetic regulation and differentiation bias in iPSCs.
© 2023. Springer Nature Limited.
Conflict of interest statement
The authors declare no competing interests.
Figures


Similar articles
-
MicroRNAs contribute to induced pluripotent stem cell somatic donor memory.J Biol Chem. 2014 Jan 24;289(4):2084-98. doi: 10.1074/jbc.M113.538702. Epub 2013 Dec 5. J Biol Chem. 2014. PMID: 24311783 Free PMC article.
-
Combined Noncoding RNA-mRNA Regulomics Signature in Reprogramming and Pluripotency in iPSCs.Cells. 2022 Nov 29;11(23):3833. doi: 10.3390/cells11233833. Cells. 2022. PMID: 36497092 Free PMC article.
-
Reprogramming of COPD lung fibroblasts through formation of induced pluripotent stem cells.Am J Physiol Lung Cell Mol Physiol. 2014 Mar 15;306(6):L552-65. doi: 10.1152/ajplung.00255.2013. Epub 2014 Jan 31. Am J Physiol Lung Cell Mol Physiol. 2014. PMID: 24487392 Free PMC article.
-
An Overview on Promising Somatic Cell Sources Utilized for the Efficient Generation of Induced Pluripotent Stem Cells.Stem Cell Rev Rep. 2021 Dec;17(6):1954-1974. doi: 10.1007/s12015-021-10200-3. Epub 2021 Jun 7. Stem Cell Rev Rep. 2021. PMID: 34100193 Review.
-
The miR-302-Mediated Induction of Pluripotent Stem Cells (iPSC): Multiple Synergistic Reprogramming Mechanisms.Methods Mol Biol. 2018;1733:283-304. doi: 10.1007/978-1-4939-7601-0_23. Methods Mol Biol. 2018. PMID: 29435941 Review.
Cited by
-
Exosomal microRNAs (miRNAs) in blood and urine under physiological conditions: a comparative study.Ewha Med J. 2024 Jan;47(1):e6. doi: 10.12771/emj.2024.e6. Epub 2024 Jan 31. Ewha Med J. 2024. PMID: 40703395 Free PMC article.
-
Advances in different adult stem cell-derived exosomal non-coding RNAs for the treatment of neurological disorders: a narrative review.Front Cell Dev Biol. 2024 Oct 9;12:1459246. doi: 10.3389/fcell.2024.1459246. eCollection 2024. Front Cell Dev Biol. 2024. PMID: 39450275 Free PMC article. Review.
-
Global microRNA profiling of bone marrow-MSC derived extracellular vesicles identifies miRNAs associated with hematopoietic dysfunction in aplastic anemia.Sci Rep. 2024 Aug 23;14(1):19654. doi: 10.1038/s41598-024-70369-8. Sci Rep. 2024. PMID: 39179703 Free PMC article.
-
Extracellular Vesicles as Epigenetic Regulators of Redox Homeostasis: A Systematic Review and Meta-Analysis.Antioxidants (Basel). 2025 Apr 29;14(5):532. doi: 10.3390/antiox14050532. Antioxidants (Basel). 2025. PMID: 40427414 Free PMC article. Review.
-
Selecting Monoclonal Cell Lineages from Somatic Reprogramming Using Robotic-Based Spatial-Restricting Structured Flow.Research (Wash D C). 2024 Mar 7;7:0338. doi: 10.34133/research.0338. eCollection 2024. Research (Wash D C). 2024. PMID: 38464498 Free PMC article.
References
Publication types
MeSH terms
Substances
Grants and funding
LinkOut - more resources
Full Text Sources
Miscellaneous
