Clinical Trial
. 2023 Oct;29(10):2547-2558.
doi: 10.1038/s41591-023-02547-6. Epub 2023 Sep 11.

Impact of a TLR9 agonist and broadly neutralizing antibodies on HIV-1 persistence: the randomized phase 2a TITAN trial

Affiliations
Clinical Trial

Impact of a TLR9 agonist and broadly neutralizing antibodies on HIV-1 persistence: the randomized phase 2a TITAN trial

Jesper D Gunst et al. Nat Med. 2023 Oct.

Abstract

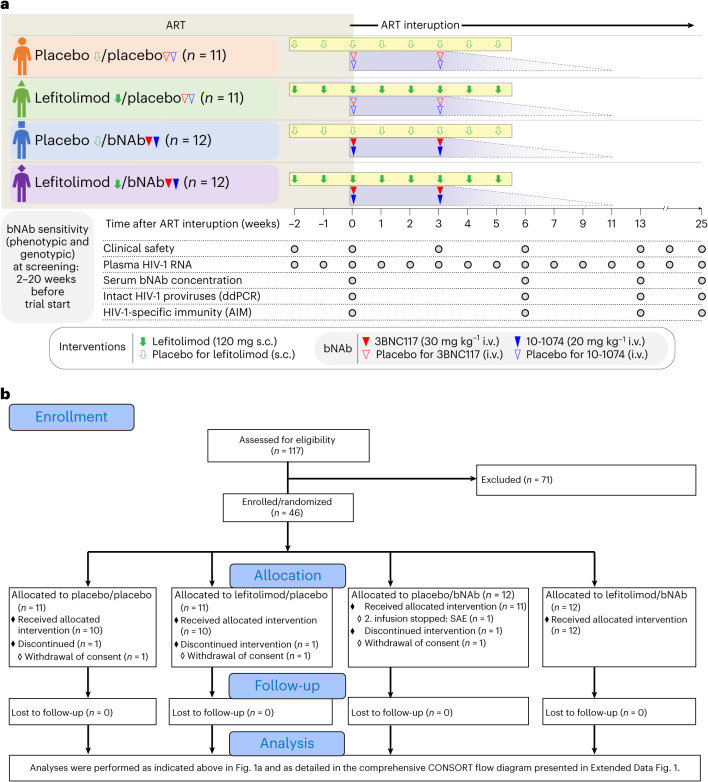
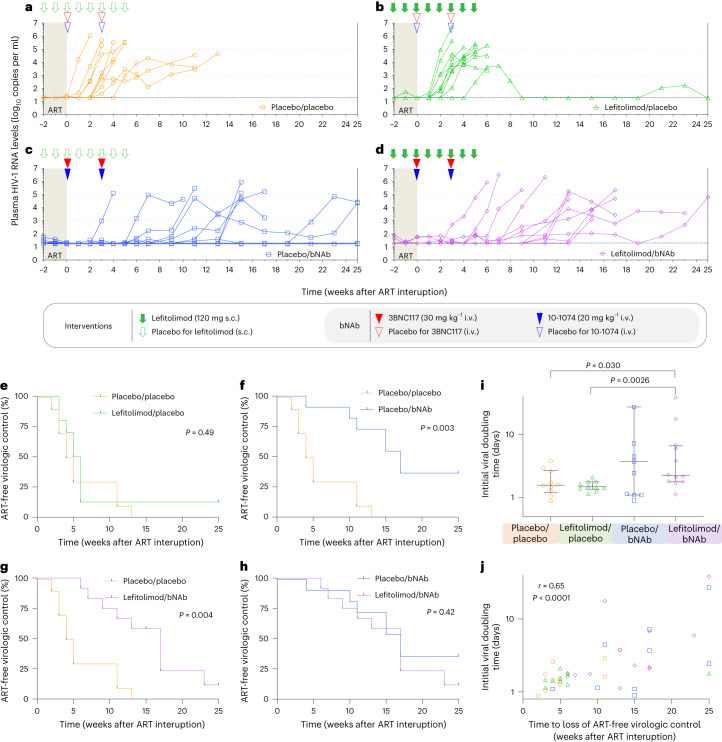
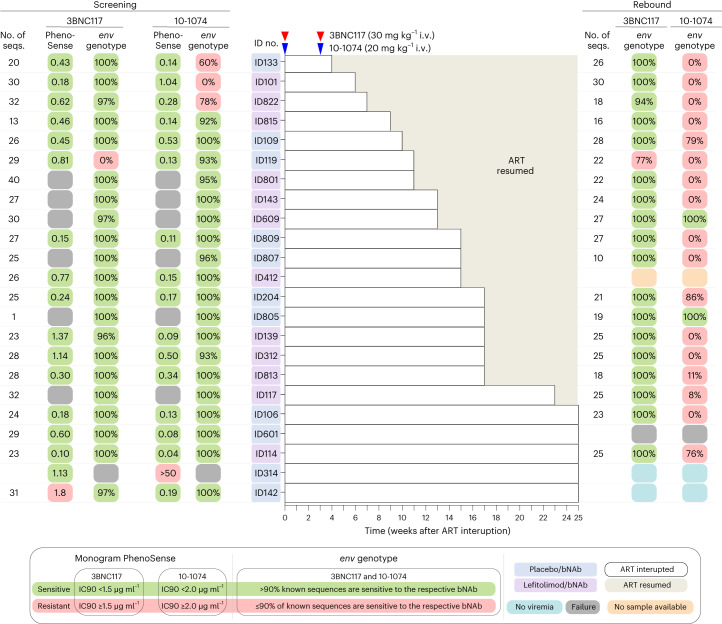
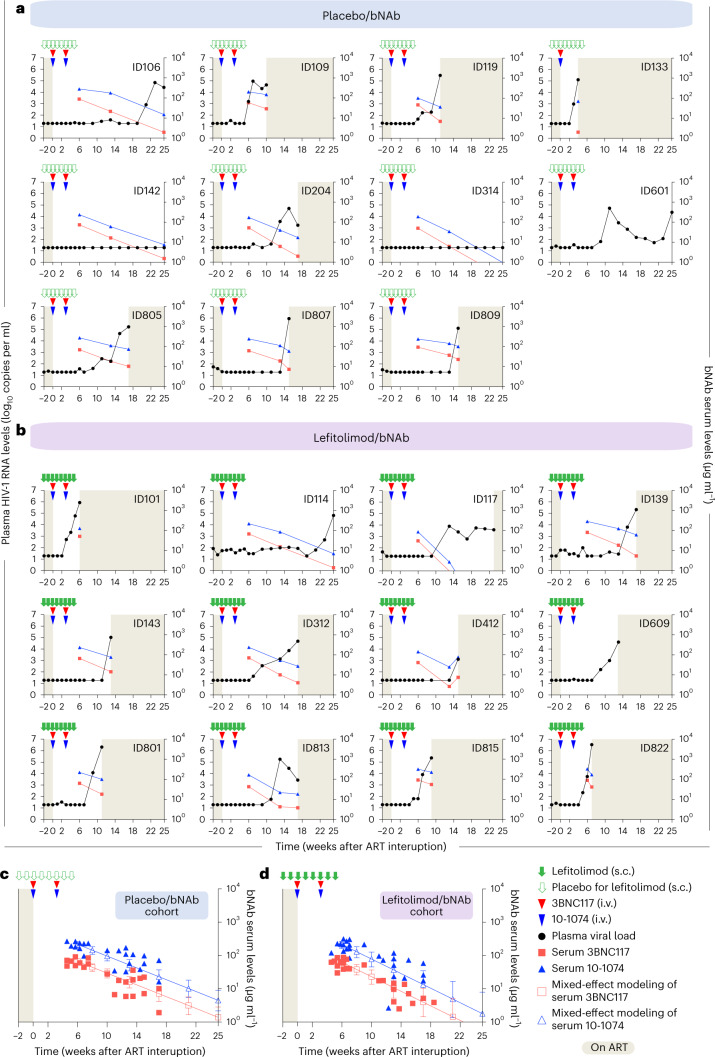
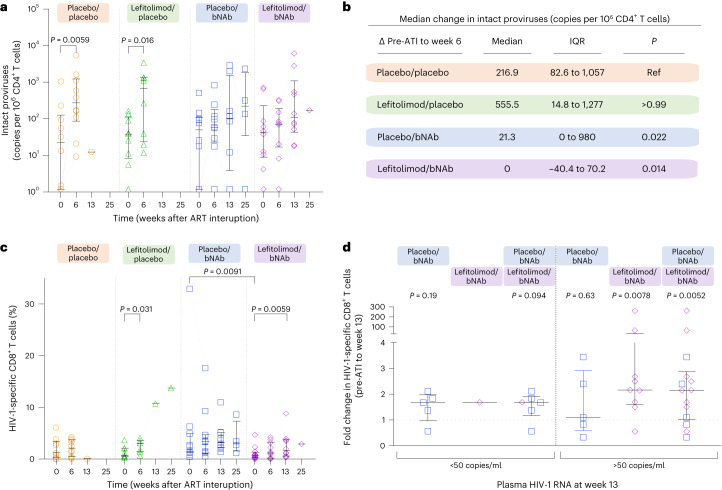
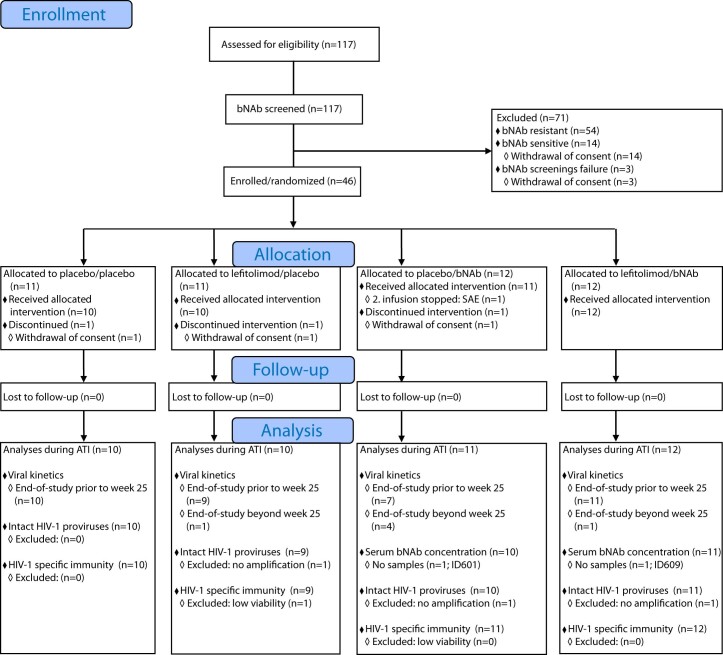
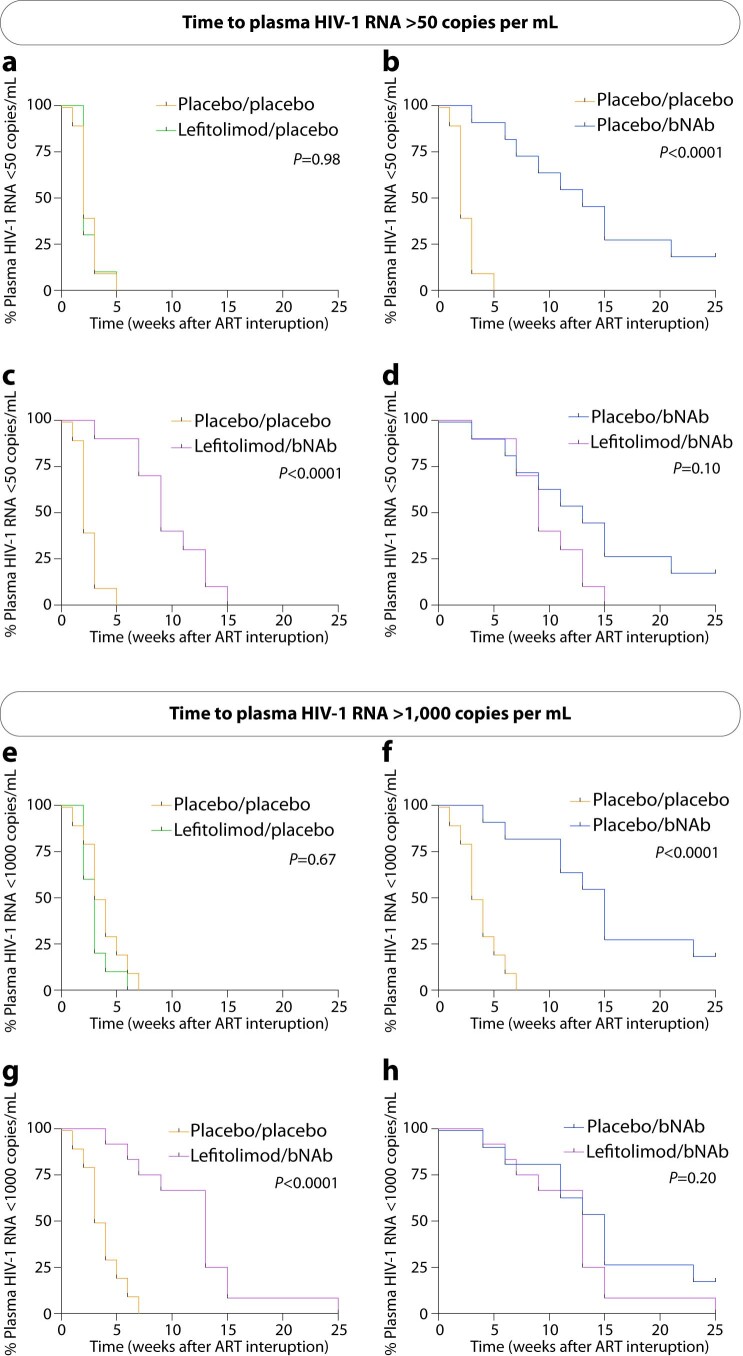
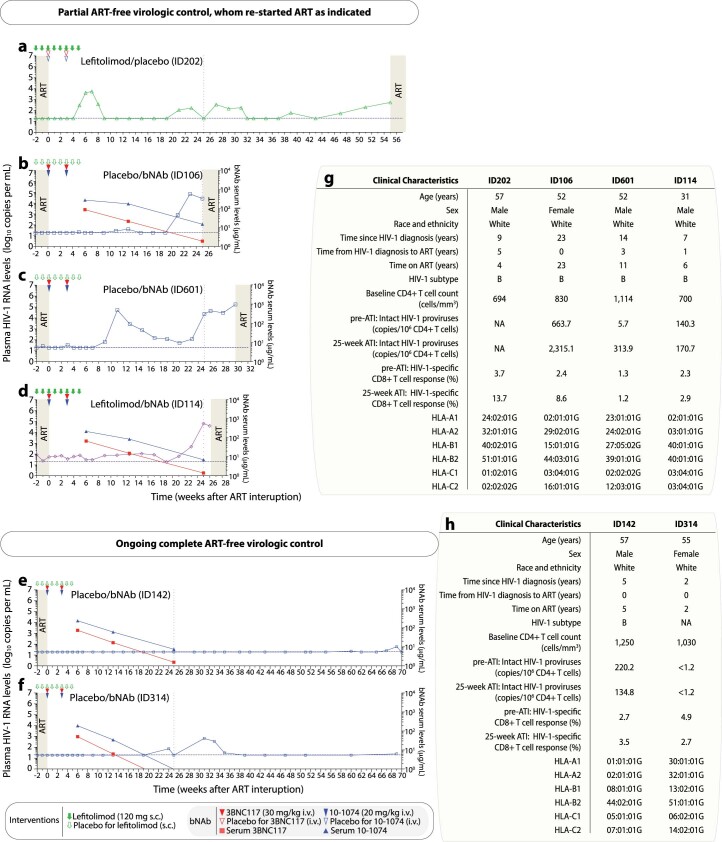
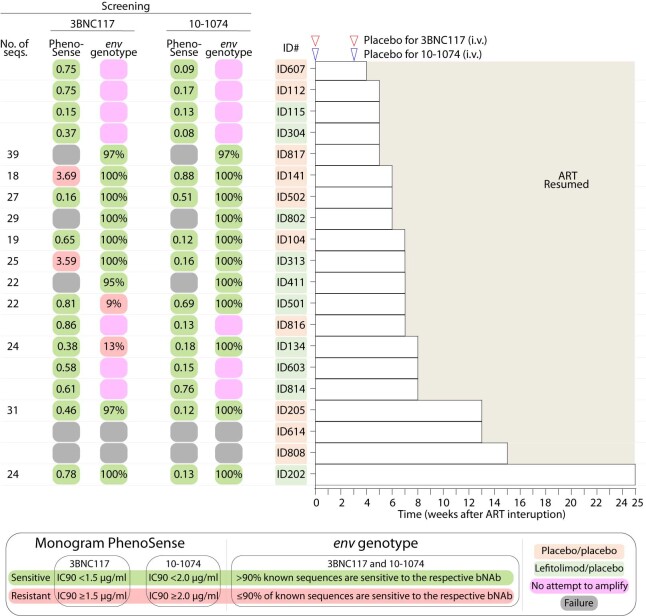
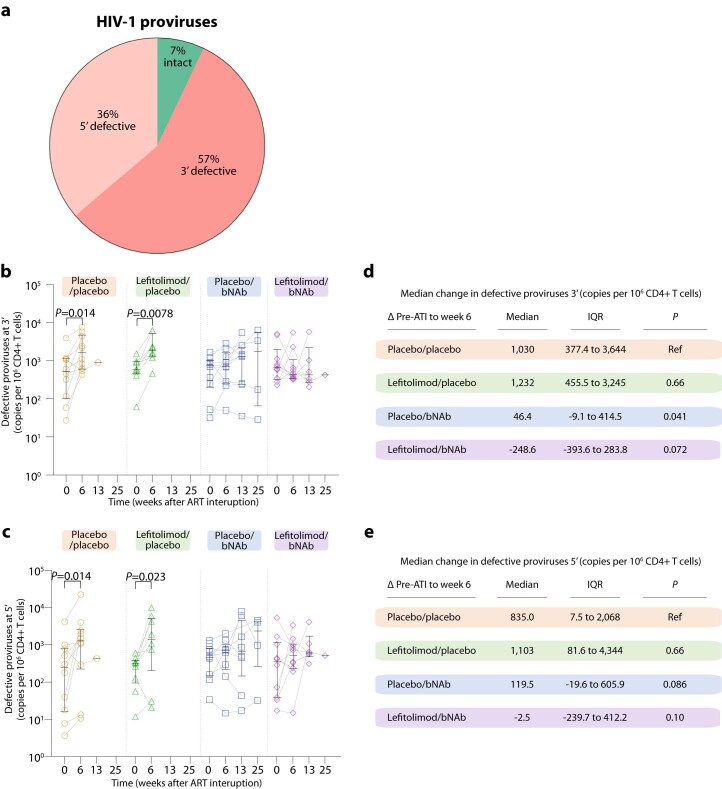
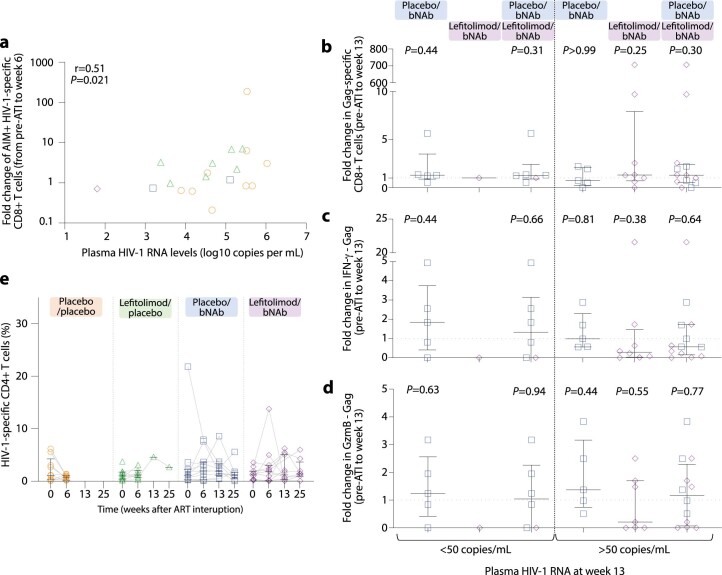
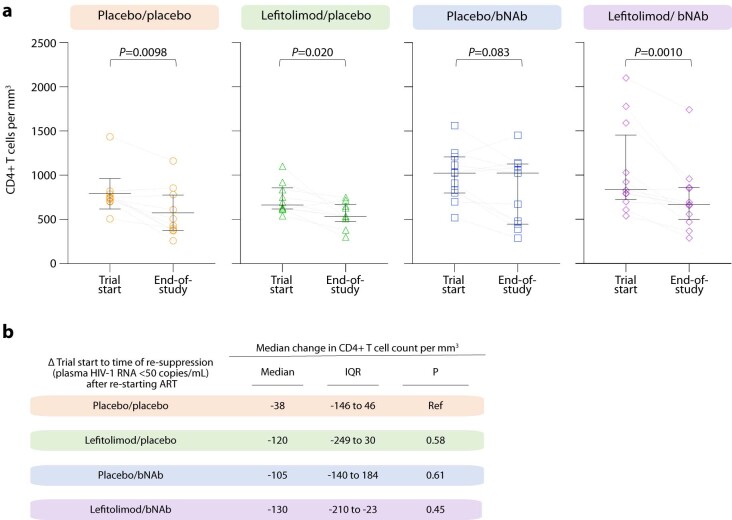
Inducing antiretroviral therapy (ART)-free virological control is a critical step toward a human immunodeficiency virus type 1 (HIV-1) cure. In this phase 2a, placebo-controlled, double-blinded trial, 43 people (85% males) with HIV-1 on ART were randomized to (1) placebo/placebo, (2) lefitolimod (TLR9 agonist)/placebo, (3) placebo/broadly neutralizing anti-HIV-1 antibodies (bNAbs) or (4) lefitolimod/bNAb. ART interruption (ATI) started at week 3. Lefitolimod was administered once weekly for the first 8 weeks, and bNAbs were administered twice, 1 d before and 3 weeks after ATI. The primary endpoint was time to loss of virologic control after ATI. The median delay in time to loss of virologic control compared to the placebo/placebo group was 0.5 weeks (P = 0.49), 12.5 weeks (P = 0.003) and 9.5 weeks (P = 0.004) in the lefitolimod/placebo, placebo/bNAb and lefitolimod/bNAb groups, respectively. Among secondary endpoints, viral doubling time was slower for bNAb groups compared to non-bNAb groups, and the interventions were overall safe. We observed no added benefit of lefitolimod. Despite subtherapeutic plasma bNAb levels, 36% (4/11) in the placebo/bNAb group compared to 0% (0/10) in the placebo/placebo group maintained virologic control after the 25-week ATI. Although immunotherapy with lefitolimod did not lead to ART-free HIV-1 control, bNAbs may be important components in future HIV-1 curative strategies. ClinicalTrials.gov identifier: NCT03837756 .


Conflict of interest statement

M.C.N. is listed as an inventor on patents for the antibodies 3BNC117 and 10-1074. All other authors declare no competing interests.

Figures

Fig. 1
Fig. 1. TITAN trial design (a) and abbreviated CONSORT flow diagram (b).
Solid green arrows indicate lefitolimod injections. Solid red and blue triangles indicate 3BNC117 and 10-1074 infusions, respectively. Empty green arrows as well as red and blue triangles indicate placebo injections or infusions, respectively. Gray shaded areas indicate time on ART, and white shaded areas indicate still interrupting ART during the 25 weeks of ATI. The analysis section is presented in full in Extended Data Fig. 1. SAE, severe adverse event.
Fig. 2
Fig. 2. Viral kinetics and time to loss of virologic control during 25 weeks of ATI.
ad, Individual plasma HIV-1 RNA levels are shown in the four randomization groups during 25 weeks of ATI: a, placebo/placebo group (n = 10); b, lefitolimod/placebo (n = 10); c, placebo/bNAb (n = 11); and d, lefitolimod/bNAb (n = 12). Solid green arrows indicate lefitolimod injections. Solid red and blue triangles indicate 3BNC117 and 10-1074 infusions, respectively. Empty green arrows as well as red and blue triangles indicate placebo injections or infusions, respectively. Light gray shaded areas indicate time on ART, and white shaded areas indicate still interrupting ART during the 25 weeks of ATI. The three horizontal dotted lines indicates plasma HIV-1 RNA limit of quantification and 1,000 and 100,000 copies per milliliter, respectively. Viral rebound was defined as 4 weeks with plasma HIV-RNA >1,000 copies per milliliter or two consecutive measurements >100,000 copies per milliliter. eh, Kaplan–Meier curves showing the percentage of individuals still interrupting ART during the 25 weeks of ATI. Time to loss of virologic control for the three active interventional groups compared to the placebo/placebo group: lefitolimod/placebo (e), placebo/bNAb (f) and lefitolimod/bNAb (g). h, Time to loss of virologic control for the placebo/bNAb group compared to the letifolimod/bNAb group. P values were calculated using the log-rank test. i, Dot plot of the initial viral doubling time in plasma HIV-1 RNA during ATI among the four randomization groups. The number of individuals per group is as stated for ad, but the two individuals with completed virologic control in the placebo/bNAb group were given a high doubling time of 100 d beyond the axis to be included and to avoid skewing the data (lines at median and IQRs). P values comparing between groups were calculated using the two-tailed Mann–Whitney test. j, Correlation between time to loss of ART-free virologic control during the 25 weeks of ATI and initial viral doubling time among the four randomization groups. The number of individuals per group is as stated in i. P value was calculated using two-tailed Spearman’s correlation coefficient.
Fig. 3
Fig. 3. bNAb sensitivity at screening and viral rebound.
bNAb sensitivity was primarily analyzed using the PhenoSense Monoclonal Antibody Assay with predefined IC90 thresholds for 3BNC117 (<1.5 µg ml−1) and 10-1074 (<2.0 µg ml−1) and MPI ≥98%. In six participants, the PhenoSense Assay failed, and we secondarily used proviral HIV-1 env sequences on a genotypic prediction algorithm with predefined thresholds of >90% known sequences are sensitive. One participant (ID142) was enrolled based upon the genotypically analysis, but post hoc phenotypic data showed an IC90 of 1.8 µg ml−1 for 3BNC117. In another participant (ID314), both the PhenoSense Assay and env sequencing initially failed, and we tertiary (Methods) included this individual based on the assumption that both assays failed due to a very small reservoir size, but post hoc phenotypic data showed archived 10-1074-resistant proviruses. For individuals enrolled based upon the phenotypic data, genotypical data were subsequently obtained except for one participant (ID314). If the participants had reached criteria for viral rebound before or were viremic at the end of the 25 weeks of ATI, bNAb sensitivity using plasma HIV-1 env sequences was analyzed using the same genotypic prediction algorithm. ID412 did not have samples available at viral rebound, and env sequencing failed for ID601. ID314 and ID142 had complete virologic control at the end of the 25 weeks of ATI. Solid red and blue triangles indicate 3BNC117 and 10-1074 infusions, respectively. Light gray shaded areas indicate time on ART, and white shaded boxes indicate still interrupting ART during the 25 weeks of ATI. Dark gray boxes are assay failures; orange boxes are no samples available; and dark blue boxes are no viremia at the end of 25-week ATI.
Fig. 4
Fig. 4. Plasma HIV-1 RNA and bNAb serum levels for the two bNAb groups.
a,b, Plasma HIV-1 RNA (solid black dot with line; left y axis) and bNAb serum concentrations (3BNC117, solid red square with line; 10-1074, solid blue triangle with line; right y axis) for the placebo/bNAb group (a) and lefitolimod/bNAb group (b) during 25 weeks of ATI. Solid green arrows indicate lefitolimod injections. Solid red and blue triangles indicate 3BNC117 and 10-1074 infusions, respectively. Empty green arrows as well as red and blue triangles indicate placebo injections or infusions, respectively. Gray shaded areas indicate time on ART, and white shaded areas indicate still interrupting ART during the 25 weeks of ATI. The lower limit of quantification of plasma HIV-1 RNA was 20 copies per milliliter. In the placebo/bNAb group, serum concentration is shown for 10 individuals; ID601 did not have serum samples taken; and ID133 received only the first bNAb infusions due to a severe adverse event. In the lefitolimod/bNAb groups, serum concentration is shown for all individuals (n = 11) except ID609, who did not have serum samples taken. c,d, Group levels of bNAb serum concentrations for the placebo/bNAb group (n = 10) (c) and lefitolimod/bNAb group (n = 11) (d) during 25 weeks of ATI. Mixed-effect modeling with open squares and triangles with lines for mean (s.d.) 3BNC117 and 10-1074 serum concentrations, respectively, during 25 weeks of ATI.
Fig. 5
Fig. 5. Size of the intact HIV-1 reservoir and HIV-1-specific CD8+ T cell immunity.
a, Dot plot of the size of the intact HIV-1 reservoir at ATI start (day 0) and after 6, 13 and 25 weeks of ATI among individuals in the four randomization groups (lines at median and IQRs): placebo/placebo (n = 10); lefitolimod/placebo (n = 9); placebo/bNAb (n = 10); and lefitolimod/bNAb (n = 11). All weeks are shown, including weeks with no data available. P values comparing within groups were calculated using the paired two-tailed Wilcoxon test. Only P values below 0.05 are shown. b, Median change in the intact HIV-1 reservoir between week 6 of the ATI and pre-ATI for the four randomization groups are shown. Data are median and IQRs with the placebo/placebo group as the reference. Placebo/placebo group (n = 10); lefitolimod/placebo (n = 8); placebo/bNAb (n = 9); and lefitolimod/bNAb (n = 9). P values comparing between groups were calculated using the two-tailed Mann–Whitney test. c, Dot plot of the frequency of HIV-1-specific CD8+ T cells at ATI start (day 0) and after 6, 13 and 25 weeks of ATI among individuals in the four randomization groups (lines at median and IQRs): placebo/placebo (n = 10); lefitolimod/placebo (n = 9); placebo/bNAb (n = 11); and lefitolimod/bNAb (n = 12). All weeks are shown, including weeks with no data available. P values comparing within groups and between groups were calculated using the paired two-tailed Wilcoxon test and two-tailed Mann–Whitney test, respectively. Only P values below 0.05 are shown. d, Dot plot of median fold change in HIV-1-specific CD8+ T cells after 13 weeks of ATI among individuals with either plasma HIV-1 RNA below (left) or above (right) 50 copies per milliliter in the two randomization groups receiving bNAb combination (lines at median and IQRs). Plasma HIV-1 RNA below 50 copies per milliliter: placebo/bNAb (n = 5) and lefitolimod/bNAb (n = 1); plasma HIV-1 RNA above 50 copies per milliliter: placebo/bNAb (n = 5) and lefitolimod/bNAb (n = 9). P values comparing within groups were calculated using the paired two-tailed Wilcoxon test.
Extended Data Fig. 1
Extended Data Fig. 1. A comprehensive CONSORT Flow Diagram.
ART, antiretroviral therapy; ATI, ART interruption; bNAb, broadly neutralizing antibody, SAE, severe adverse event.
Extended Data Fig. 2
Extended Data Fig. 2. Time to plasma HIV-1 RNA above 50 and 1,000 copies/mL during 25 weeks of ATI.
(a-h) Kaplan–Meier curves showing the percentage of individuals still interrupting ART with plasma HIV-1 RNA < 50 and <1,000 copies/mL during the 25 weeks of ATI for the three active interventional groups compared to the placebo/placebo group: Lefitolimod/placebo (a, e), placebo/bNAb (b, f) and lefitolimod/bNAb (c, g). Kaplan–Meier curves showing the percentage of individuals still interrupting ART with plasma HIV-1 RNA < 50 and <1,000 copies/mL during the 25 weeks of ATI for the placebo/bNAb group compared to the lefitolimod/bNAb group (d, h). P values were calculated using the log-rank test. ART, antiretroviral therapy; ATI, ART interruption; bNAb, broadly neutralizing antibody.
Extended Data Fig. 3
Extended Data Fig. 3. Plasma HIV-1 RNA kinetics for participants with partial and ongoing complete ART-free virologic control during the 25 weeks of ATI.
(a-d) Individual plasma HIV-1 RNA levels are shown in the four participants (ID202, ID106, ID601 and ID114) with partial ART-free virologic control during 25 weeks of ATI, whom re-started ART as indicated. (e, f) Individual plasma HIV-1 RNA levels are shown in the two participants (ID142 and ID314) with ongoing complete ART-free virologic control during 25 weeks of ATI. Solid green arrows indicate lefitolimod injections. Solid red and blue triangles indicate 3BNC117 and 10-1074 infusions, respectively. Empty green arrows as well as red and blue triangles indicate placebo injections or infusions, respectively. Plasma HIV-1 RNA (group-colored symbols with line; left y-axis) and bNAb serum concentrations (3BNC117, solid red square with line; 10-1074, solid blue triangle with line; right y-axis) during ATI, ID601 did not have serum samples taken. Light grey shaded areas indicate time on ART, while white shaded areas indicate still interrupting ART. The vertical dotted line at week 25 indicates end-of-study time point. (g-h) Overview of the clinical characteristics for participants with partial and ongoing complete ART-free virologic control during the 25 weeks of ATI. ART, antiretroviral therapy; ATI, ART interruption; bNAb, broadly neutralizing antibody; HLA, human leukocyte antigen; NA, not available; i.v., intravenous; s.c., subcutaneous.
Extended Data Fig. 4
Extended Data Fig. 4. bNAb sensitivity at screening for the placebo/placebo and lefitolimod/placebo groups.
bNAb sensitivity was primarily analyzed using the PhenoSense Monoclonal Antibody Assay with predefined IC90 thresholds for 3BNC117 ( < 1.5 µg/mL) and 10-1074 ( < 2.0 µg/mL) and maximum percentage inhibition (MPI) ≥ 98%. In seven participants, the PhenoSense Assay failed, and we secondarily used proviral HIV-1 envelope (env) sequences on a genotypic prediction algorithm with predefined thresholds of ≥90% known sequences are sensitive. Two participants (ID141 and ID313) were enrolled based upon the genotypically analysis, but post-hoc phenotypic data showed IC90 values of 3.69 and 3,59 µg/mL for 3BNC117, respectively. In another two participants (ID614 and ID808), both the PhenoSense Assay and env sequencing initially failed, and we tertiary-included (see Methods) these individuals based on the assumption that both assays failed due to a very small reservoir size. Empty red and blue triangles indicate placebo for 3BNC117 and 10-1074 infusions, respectively. Light grey shaded areas indicate time on ART, while white shaded boxes indicate still interrupting ART during the 25 weeks of ATI. Dark grey boxes are assay failures and pink boxes are no attempt to amplify. ART, antiretroviral therapy; ATI, ART interruption; env; HIV-1 envelope; IC90, concentration of bNAb required for 90% inhibition; i.v., intravenous.
Extended Data Fig. 5
Extended Data Fig. 5. Fraction and size of the defective HIV-1 proviruses.
Mean fraction of intact, 3′ and 5′ defective HIV-1 proviruses per 106 CD4 + T cells from 39 individuals at ATI start (day 0) (a). The size of the 3’ (b) and 5’ (c) defective HIV-1 reservoir at ATI start (day 0) and after 6, 13 and 25 weeks of ATI among individuals in the four randomization groups (lines at median and IQRs). Placebo/placebo group (n = 10); lefitolimod/placebo (n = 9); placebo/bNAb (n = 10); and lefitolimod/bNAb (n = 11). All weeks are shown, including weeks with no data available. Median change in the 3’ (d) and 5’ (e) defective HIV-1 reservoir between week 6 of the ATI and pre-ATI for the four randomization groups are shown. Data are median and IQRs with the placebo/placebo group as the reference. Placebo/placebo group (n = 10); lefitolimod/placebo (n = 8); placebo/bNAb (n = 9); and lefitolimod/bNAb (n = 9). P values comparing within groups (only P values below 0.05 are shown) and between groups were calculated using the paired two-tailed Wilcoxon test and two-tailed Mann–Whitney test, respectively. ART, antiretroviral therapy; ATI, ART interruption; IQR, interquartile ranges; bNAb, broadly neutralizing antibody.
Extended Data Fig. 6
Extended Data Fig. 6. HIV-1-specific CD8+ and CD4+ immune responses during ATI.
(a) Correlation between fold change of HIV-1-specific CD8 + T cell response from pre-ATI to week 6 of ATI and measurable plasma HIV-1 RNA at week 6 with for participants with plasma HIV-1 RNA > 50 copies/mL. Placebo/placebo group (n = 9); lefitolimod/placebo (n = 7); placebo/bNAb (n = 2); and lefitolimod/bNAb (n = 1). P value calculated using two-tailed Spearman’s correlation coefficient. (b-d) Dot plot of median fold change in Gag-specific CD8 + T cells and Gag-induced INF-γ or GzmB responses after 13 weeks of ATI among individuals with either plasma HIV-1 RNA below (left panel) or above (right panel) 50 copies per mL in the two randomization groups receiving bNAb combination (lines at median and IQRs). Plasma HIV-1 RNA below 50 copies/mL: Placebo/bNAb (n = 5); and lefitolimod/bNAb (n = 1), or above 50 copies/mL: Placebo/bNAb (n = 5); and lefitolimod/bNAb (n = 7 to 9). P values comparing within groups were calculated using the paired two-tailed Wilcoxon test. (e) Dot plot of the frequency of HIV-1-specific CD4 + T cells at ATI start (day 0) and after 6, 13 and 25 weeks of ATI among individuals in the four randomization groups (lines at median and IQRs). All weeks are shown, including weeks with no data available. Placebo/placebo group (n = 10); lefitolimod/placebo (n = 9); placebo/bNAb (n = 11); and lefitolimod/bNAb (n = 12). P values comparing within groups were calculated using the paired two-tailed Wilcoxon test. Only P values below 0.05 are shown. ART, antiretroviral therapy; ATI, ART interruption; bNAb, broadly neutralizing antibody; IQR, interquartile ranges.
Extended Data Fig. 7
Extended Data Fig. 7. CD4 + T cell count at trial start and end-of-study.
(a) Dot plots of the CD4 + T cell count in the four groups at trial start (week -2) and end-of-study (lines at median and IQRs). Placebo/placebo group (n = 10); lefitolimod/placebo (n = 10); placebo/bNAb (n = 11); and lefitolimod/bNAb (n = 12). P values comparing within groups were calculated using the paired two-tailed Wilcoxon test. (b) Median change in CD4 + T cell count in the four groups between time point of viral suppression (plasma HIV-1 RNA < 50 copies/mL) and trial start are shown. Data are median and IQRs with the placebo/placebo group as the reference. Placebo/placebo group (n = 8); lefitolimod/placebo (n = 7); placebo/bNAb (n = 6); and lefitolimod/bNAb (n = 10). P values between groups were calculated using the two-tailed Mann–Whitney test. bNAb, broadly neutralizing antibody; IQR, interquartile ranges.

References

    1. Rasmussen TA, et al. Panobinostat, a histone deacetylase inhibitor, for latent-virus reactivation in HIV-infected patients on suppressive antiretroviral therapy: a phase 1/2, single group, clinical trial. Lancet HIV. 2014;1:e13–e21. doi: 10.1016/S2352-3018(14)70014-1. - DOI - PubMed
    1. Li JZ, et al. The size of the expressed HIV reservoir predicts timing of viral rebound after treatment interruption. AIDS. 2015;30:343–353. - PMC - PubMed
    1. Kroon EDMB, et al. A randomized trial of vorinostat with treatment interruption after initiating antiretroviral therapy during acute HIV-1 infection. J. Virus Erad. 2020;6:100004. doi: 10.1016/j.jve.2020.100004. - DOI - PMC - PubMed
    1. Leth S, et al. Combined effect of Vacc-4x, recombinant human granulocyte macrophage colony-stimulating factor vaccination, and romidepsin on the HIV-1 reservoir (REDUC): a single-arm, phase 1B/2A trial. Lancet HIV. 2016;3:e463–e472. doi: 10.1016/S2352-3018(16)30055-8. - DOI - PubMed
    1. Gruell H, et al. Effect of 3BNC117 and romidepsin on the HIV-1 reservoir in people taking suppressive antiretroviral therapy (ROADMAP): a randomised, open-label, phase 2A trial. Lancet Microbe. 2022;3:e203–e214. doi: 10.1016/S2666-5247(21)00239-1. - DOI - PMC - PubMed

Publication types

Associated data