. 2023 Sep 11;6(1):930.
doi: 10.1038/s42003-023-05303-1.

Linking spontaneous and stimulated spine dynamics

Affiliations

Linking spontaneous and stimulated spine dynamics

Maximilian F Eggl et al. Commun Biol. .

Abstract

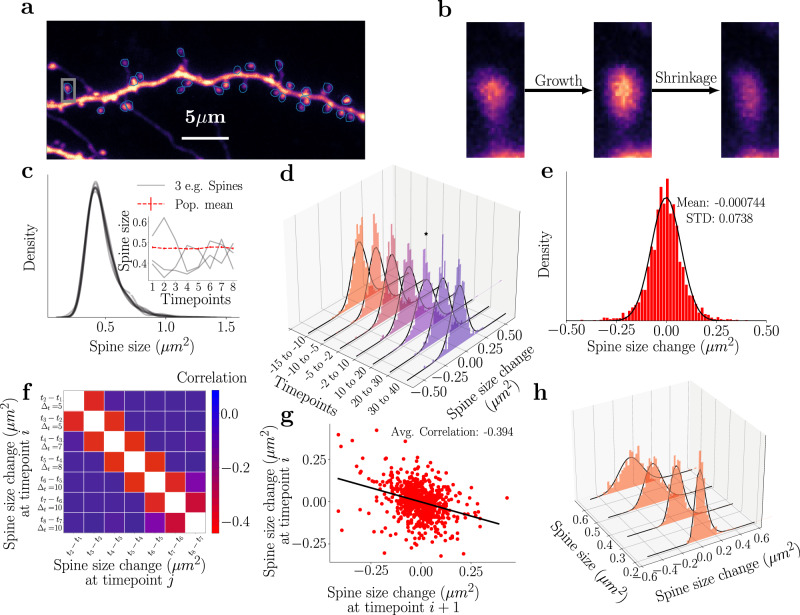
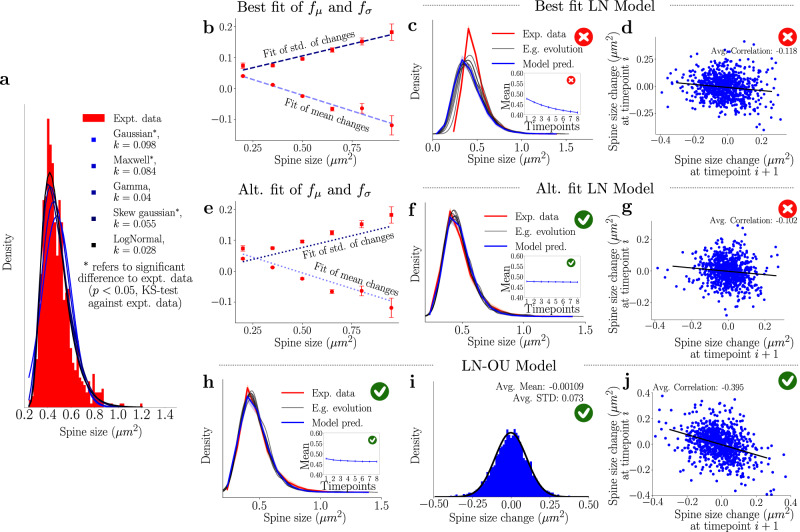
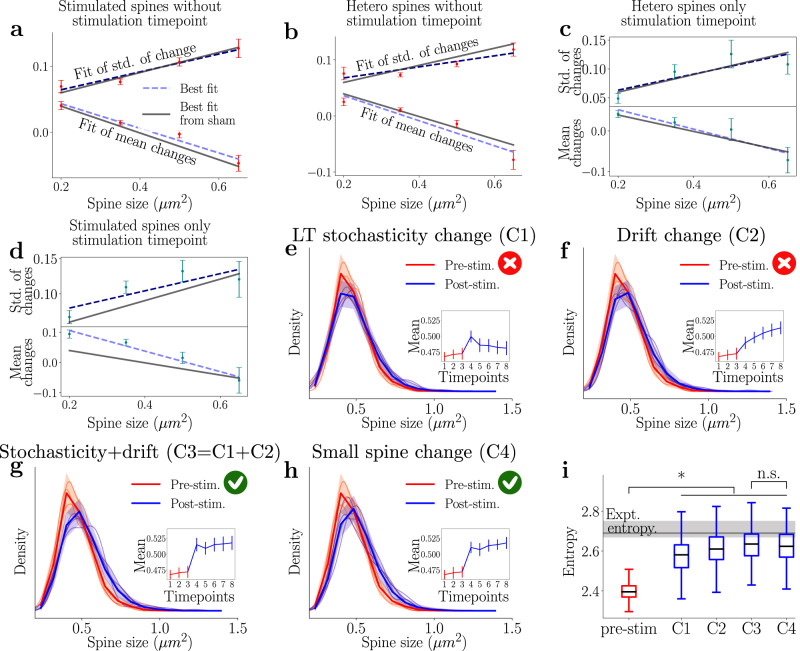
Our brains continuously acquire and store memories through synaptic plasticity. However, spontaneous synaptic changes can also occur and pose a challenge for maintaining stable memories. Despite fluctuations in synapse size, recent studies have shown that key population-level synaptic properties remain stable over time. This raises the question of how local synaptic plasticity affects the global population-level synaptic size distribution and whether individual synapses undergoing plasticity escape the stable distribution to encode specific memories. To address this question, we (i) studied spontaneously evolving spines and (ii) induced synaptic potentiation at selected sites while observing the spine distribution pre- and post-stimulation. We designed a stochastic model to describe how the current size of a synapse affects its future size under baseline and stimulation conditions and how these local effects give rise to population-level synaptic shifts. Our study offers insights into how seemingly spontaneous synaptic fluctuations and local plasticity both contribute to population-level synaptic dynamics.


Conflict of interest statement

The authors declare no competing interests.

Figures

Fig. 1
Fig. 1. Experimentally measured population dynamics of activity-independent spine turn-over.
a An example of a GFP-expressing CA1 neuron whose spine dynamics we analyze and model. b Example of spontaneous dynamics at the single spine level. The spine (marked by a gray rectangle in (a) exhibits both growth and shrinkage in the observed time frame. c The spine sizes follow a temporally stable right-skewed distribution with a long tail. Each gray line refers to a different snapshot distribution, which shows significant overlap. Inset: The mean size of the full spine population (red) is shown across time along with the dynamics of selected spines (gray) at each time point, where the time points are at −15, −10, −5, 2, 10, 20, 30 and 40 min. d Collective distributions of the spine size changes (Δs) from time point to time point follow a Gaussian distribution. The black lines denote the corresponding Gaussian fits. The * denotes the single distribution that is significantly different (p < 0.05 when tested with KS test). Another depiction of these changes, which highlights the difference in the distribution is seen in Supplementary Fig. 2. e The collection of all spine changes across all time points follows a zero mean Gaussian distribution and a standard deviation of ≈0.074. f Spine sizes display correlations across time, whereby the neighboring time points are negatively correlated (negative off-diagonal values). g Correlation of two time points. h Evaluating spine size changes as a function of the spine size across time points shows that small spines exhibit a narrow distribution of spine size changes while larger spines show larger variability, black lines represent the corresponding log-normal (with no statistical difference seen between the dataset and a log-normal distribution) fits of the data.
Fig. 2
Fig. 2. Utilizing the spine size dependencies to define the log-normal models.
Red crosses denote when the plotted model violates experimental observations, while green ticks indicate agreement with experimental data. a Fitting of different distributions to the spine size distribution, with k-values from the Kolmogorov–Smirnov test that show the best fit. The log-normal distribution best fits the spine size distribution. b Sample means and standard deviations of activity-independent plasticity for different subsets of spines can be used to obtain a linear fit between spine size and mean and standard deviation of their future size changes. Here the error bars represent the 95% confidence interval of the statistics after bootstrapping. c Simulations using the linear fits from b do not result in a stable distribution. E.g., evolution refers to one example simulation of spine sizes. The inset represents the simulated mean, which decreases significantly. d The correlation obtained from one example step of the best fits log-normal simulations. The value of the slope is ≈0.1, which is smaller than the correlations required. e Altered linear fits are used to achieve modeling goals. f Distribution obtained from the simulation when the altered linear fits of the sample mean and standard deviation are used. The stability of the distribution is achieved as well as that of the mean (inset). g The correlation obtained from one example step of the altered fits log-normal simulations. The value of the slope is ≈0.1, which is smaller than the correlations required. h The distribution obtained from using the best linear fits (b) for the LN-OU (Eq. (4)). Significant stability is observed (the inset represents the mean of the simulations). i Simulated activity-independent plasticity of the interpolated LN-OU model, showing clear Gaussian properties. j The correlation of the LN-OU process demonstrates a significantly more negative correlation in line with the desired model goals.
Fig. 3
Fig. 3. Stimulation of spines leads to a distinct shift of the spine size distribution that is mainly driven by growing small spines.
a, b Homosynaptic and heterosynaptic spine size distribution at different time points, with red and blue referring to pre-stimulation and post-stimulation, respectively. Sample mean and entropy are shown. * and n.s. refer to p < 0.05 and p > 0.05 of a two-sided t test comparing pre- and post-stimulation. c The collective change dynamics of all homosynaptic spine sizes follow a Gaussian distribution. Teal represents the spine size change directly after the stimulation. d The mean of spine change from time point to time point computed for all homosynaptic spines together. A one-way ANOVA test reveals that only the stimulation time point is significantly different. All other time points are not significantly different from activity-independent fluctuations. e Distribution dynamics of heterosynaptic spines time point to time point follows a Gaussian distribution. f Temporal change in the mean of spine changes in the heterosynaptic spines. A one-way ANOVA test reveals lack of statistical differences across time. g Splitting up the size changes in homosynaptic spines according to their initial size reveals a large difference in activity-independent plasticity distributions. The left figure represents all the time points without stimulation, and the right is the single time point immediately after stimulation. The associated black lines represent log-normal fits to the data. h A comparison between the log-normal fits for the size buckets reveal the effects that the stimulation has on the different spine sizes of the homosynaptic spines. Red refers to the non-stimulated time point, and the teal to the stimulated ones. The p value in the figure refers to a KS test performed on the data in (g) to verify whether the samples come from different distributions. i, j Same procedure as g, h but for the heterosynaptic spines.
Fig. 4
Fig. 4. The Log-normal–Ornstein–Uhlenbeck (LN-OU) model can reproduce homosynaptic spines dynamics even if only small spines are altered.
The figure shows how the model can reproduce the dynamics of homosynaptic spines by changing the behavior of small spines only. The red crosses denote when the model violates experimental observation, and the green tick denotes agreement with the data. ad Subsets of homo- and heterosynaptic spines were split according to size, and linear fits were carried out for the sample mean and standard deviation of the spine activity. Here the error bars represent the 95% confidence interval of the statistics after bootstrapping. ac Fit of the non-stimulation snapshot of the homosynaptic spine and all snapshots of the heterosynaptic spines show good agreement with the activity-independent plasticity fits (gray). d Stimulation snapshot of the homosynaptic spine shows a difference in the fit for smaller spines. e Model simulation dynamics pre- and post-stimulation. The immediate growth is observed but not sustained when only changing the stochastic portion. f Simulation results when the long-time stochasticity was kept the same as the model in Fig. 2e, and only μ~ was changed to reflect a new stable point. g Represents the simulation results when the two previous changes are implemented in tandem, mirroring the sustained LTP seen in Fig. 3a. h A simpler change in the stimulation model is introduced, where μ~ is changed as in the previous figures while the long-time stochasticity are only shifted for the spines <0.35 μm2 in size. i The Shannon entropy of the simulated distributions is calculated and compared to the experimental value. The stimulation event adds significant information in all cases, and there is no significant difference when the fast change is only applied to small spines. Center lines of the whisker-plots refer to the median simulated entropy and whiskers to the inter-quartile range. * and n.s. refer to p < 0.05 and p > 0.05 of a two-sided t test comparing each of the different datasets with each other.

Similar articles

Cited by

References

    1. Stevens CF, Sullivan J. Synaptic plasticity. Curr. Biol. 1998;8:R151–R153. - PubMed
    1. Maletic-Savatic M, Malinow R, Svoboda K. Rapid dendritic morphogenesis in ca1 hippocampal dendrites induced by synaptic activity. Science. 1999;283:1923–1927. - PubMed
    1. Engert F, Bonhoeffer T. Dendritic spine changes associated with hippocampal long-term synaptic plasticity. Nature. 1999;399:66–70. - PubMed
    1. Trachtenberg JT, et al. Long-term in vivo imaging of experience-dependent synaptic plasticity in adult cortex. Nature. 2002;420:788–794. - PubMed
    1. Yuste R, Bonhoeffer T. Morphological changes in dendritic spines associated with long-term synaptic plasticity. Annu. Rev. Neurosci. 2001;24:1071–1089. - PubMed

Publication types