. 2023 Sep;5(9):1578-1594.
doi: 10.1038/s42255-023-00880-1. Epub 2023 Sep 11.

Dynamic lipidome alterations associated with human health, disease and ageing

Affiliations

Dynamic lipidome alterations associated with human health, disease and ageing

Daniel Hornburg et al. Nat Metab. 2023 Sep.

Abstract

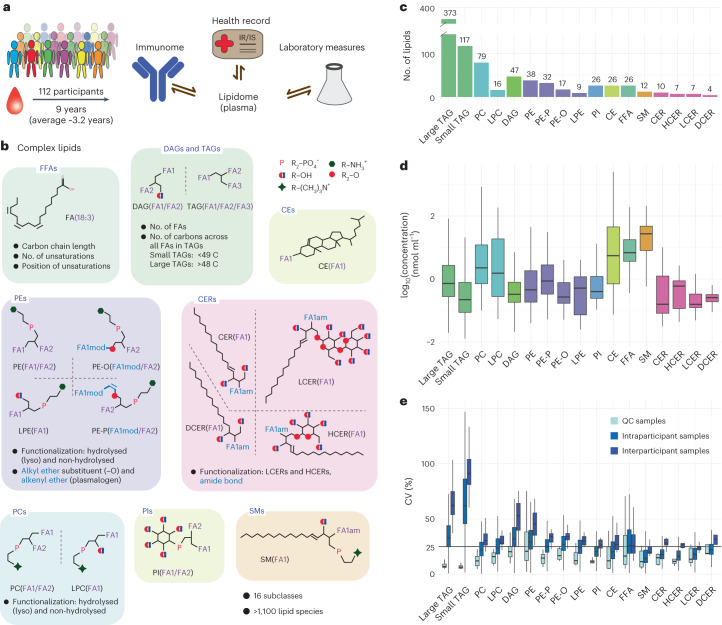
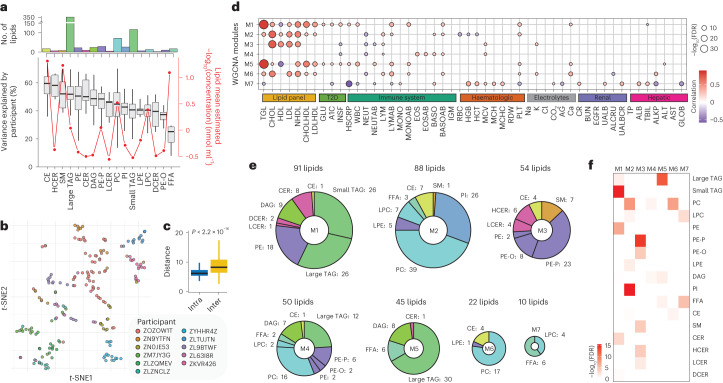
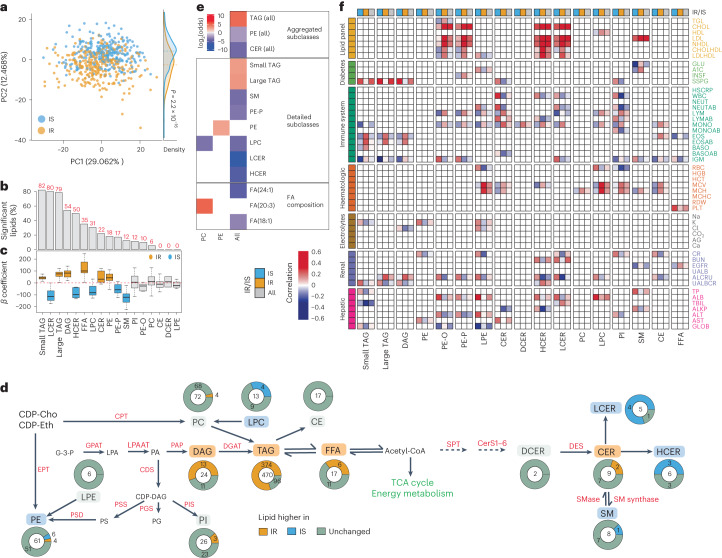
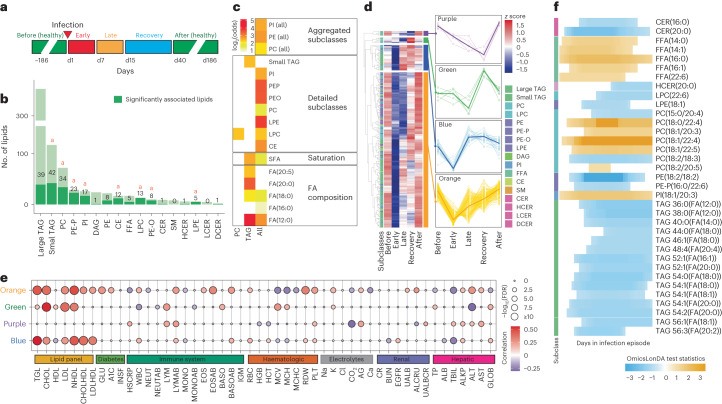
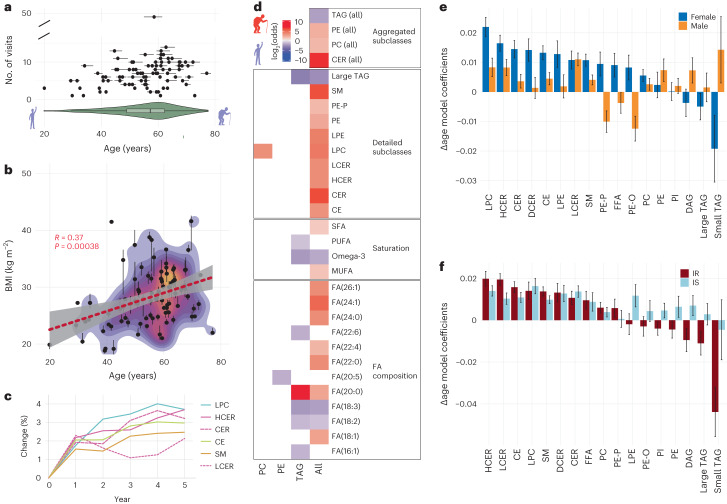
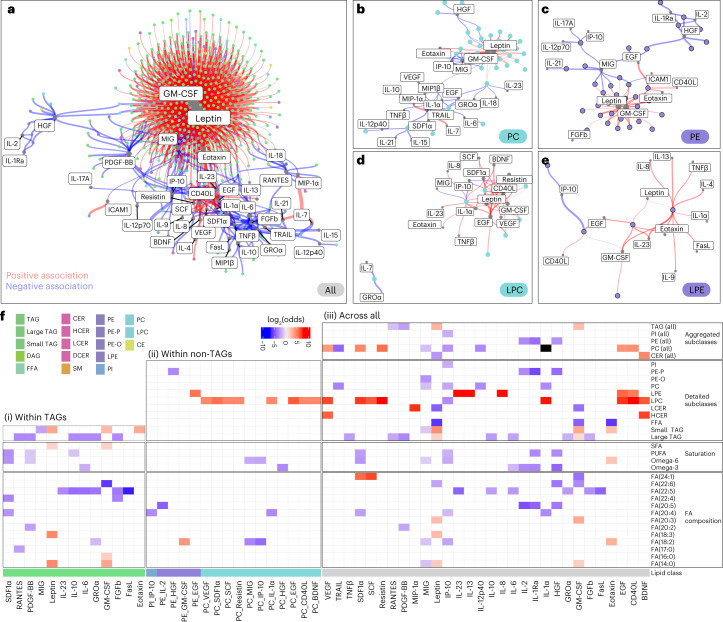
Lipids can be of endogenous or exogenous origin and affect diverse biological functions, including cell membrane maintenance, energy management and cellular signalling. Here, we report >800 lipid species, many of which are associated with health-to-disease transitions in diabetes, ageing and inflammation, as well as cytokine-lipidome networks. We performed comprehensive longitudinal lipidomic profiling and analysed >1,500 plasma samples from 112 participants followed for up to 9 years (average 3.2 years) to define the distinct physiological roles of complex lipid subclasses, including large and small triacylglycerols, ester- and ether-linked phosphatidylethanolamines, lysophosphatidylcholines, lysophosphatidylethanolamines, cholesterol esters and ceramides. Our findings reveal dynamic changes in the plasma lipidome during respiratory viral infection, insulin resistance and ageing, suggesting that lipids may have roles in immune homoeostasis and inflammation regulation. Individuals with insulin resistance exhibit disturbed immune homoeostasis, altered associations between lipids and clinical markers, and accelerated changes in specific lipid subclasses during ageing. Our dataset based on longitudinal deep lipidome profiling offers insights into personalized ageing, metabolic health and inflammation, potentially guiding future monitoring and intervention strategies.


Conflict of interest statement

M.P.S. is a co-founder and on the advisory board of Personalis, SensOmics, January AI, Filtricine, Qbio, Protos, iollo, RTHM and Mirive. M.P.S. is on the advisory board of Jupiter, Abbratech, Neuvivo and Mitrix. D.H. has financial interests in Seer and PrognomiQ. K.C. is currently an AstraZeneca employee. A.A.M. is currently an employee of Google. K.J.W. is a consultant for Verso Biosciences, Inc. The remaining authors declare no competing interests.

Figures

Fig. 1
Fig. 1. Longitudinal lipidomics profiling.
a, Profiling, using >1,500 biosamples, across 112 participants followed for up to 9 years. Dynamic changes in the lipidome were characterized in the context of health status and medication history and in comparison with the participants’ cytokine, chemokine and metabolic profiles, as well as microbiome. b, Lipid subclasses investigated in this study. Lipid species, defined by a specific combination of backbone architecture and FAs, can be grouped based on their physicochemical properties. c, We analysed 846 lipids (y axis) across multiple subclasses. d, Across all 112 participants (median estimated concentration across all participant-specific samples), lipid species (846) spanned a dynamic range of more than four orders of magnitude, with distinct estimated concentration ranges for each lipid species and subclass. e, Comparison of the CVs of QC (n = 104), intraparticipant and interparticipant samples. All boxplots report the 25% (lower hinge), 50% (centre line) and 75% (upper hinge) quantiles. Whiskers indicate observations equal to or outside the hinge ± 1.5× the interquartile range (IQR). Outliers (beyond 1.5× the IQR) are not plotted. Source data
Fig. 2
Fig. 2. Interindividual differences in healthy baseline.
a, Top, bar plot showing the number of lipid species per class ordered by the variance explained by the participant factor; bottom, boxplot showing the variance explained by participants in each lipid class (left y axis) and line graph showing the mean log10(estimated concentration) (red line, right y axis) of each lipid class. Variance decomposition analysis was conducted using n = 802 healthy samples. b, t-SNE clustering of 11 participants who contributed ≥12 healthy samples (n = 191), based on the 100 most personalized lipids. c, Intraparticipant distance, which refers to the Euclidean distance between each pair of samples belonging to the same participant, and interparticipant distance, which refers to the distance between the centroids from each pair of participants, for the t-SNE results. Boxplots report the 25% (lower hinge), 50% (centre line) and 75% (upper hinge) quantiles. Whiskers indicate observations equal to or outside the hinge ± 1.5× the IQR. Outliers (beyond 1.5× the IQR) are not plotted. The intraparticipant and interparticipant distances were compared using a two-sided t test. d, WGCNA modules and their correlation (BH-adjusted FDR cut-off of 5%) with clinical measures. Dot size depicts the BH-adjusted −log10(FDR). The colour scale indicates the degree and direction of the correlation. TGL, total triglyceride; CHOL, total cholesterol; NHDL, non-HDL; CHOLHDL, cholesterol to HDL ratio; LDLHDL, LDL to HDL ratio; GLU, glucose; INSF, fasting insulin; HSCRP, high-sensitivity CRP; WBC, white blood cell count; NEUT, neutrophil percent; NEUTAB, neutrophil absolute count; LYM, lymphocyte percent; LYMAB, lymphocyte absolute count; MONO, monocyte percent; MONOAB, monocyte absolute count; EOS, eosinophil percent; EOSAB, eosinophil absolute count; BASO, basophil percent; BASOAB, basophil absolute count; IGM, immunoglobulin M; RBC, red blood cell count; HGB, haemoglobin; HCT, haematocrit; MCV, mean corpuscular volume; MCH, mean corpuscular haemoglobin; MCHC, mean corpuscular haemoglobin concentration; RDW, red cell distribution width; PLT, platelet; AG, albumin to globulin ratio; CR, creatinine; BUN, blood urea nitrogen; EGFR, estimated glomerular filtration rate; UALB, urine albumin; ALCRU, aluminium to creatinine ratio, urine; UALBCR, urine albumin to creatinine ratio; TP, total protein; ALB, albumin; TBIL, total bilirubin; ALKP, alkaline phosphatase; ALT, alanine aminotransferase; AST, aspartate aminotransferase; GLOB, globulin. e, Module composition for the WGCNA analysis shown in c, coloured by lipid subclass. f, Enrichment analysis results based on Fisher’s exact test, depicting the BH-adjusted −log10(FDR) for enriched subclasses for each WGCNA module. Source data
Fig. 3
Fig. 3. IR- and IS-associated lipid signatures.
a, Principal component analysis comparing IR and IS. The density plot on the right indicates the distribution of eigenvectors for each data point along the second principal component (PC2). Eigenvector comparison between IR and IS was conducted using a two-sided t test. b, Regression analysis (n = 69): 424 of 736 lipids had significant correlations with SSPG (BH FDR < 5%; corrected for age, sex, ethnicity and baseline BMI). c, Boxplot depicting regression coefficients for the respective lipid classes by using 69 samples for which the SSPG level was measured at the visit. Larger coefficients indicate stronger associations with higher SSPG levels. Colour indicates distributions for which the 25th or 75th percentile is positive or negative. Boxplots report the 25% (lower hinge), 50% (centre line) and 75% (upper hinge) quantiles. Whiskers indicate observations equal to or outside the hinge ± 1.5× the IQR. Outliers (beyond 1.5× the IQR) are not plotted. d, Proportional differences between IR and IS detected in participants. Centre numbers indicate the total number of lipids in each class. Enzyme names are shown in red. CDP-Cho, cytidine diphosphocholine; CDP-Eth, cytidine diphosphoethanolamine; CPT, choline phosphotransferase; EPT, ethanolamine phosphotransferase; GPAT, glycerol-3-phosphate acyltransferase; LPAAT, lysophosphatidic acid acyltransferases; PAP, phosphatidate phosphatase; DGAT, DAG acyltransferase; G-3-P, glyceraldehyde-3-phosphate; CDS, CDP-diacylglycerol synthase; PSD, PS decarboxylase; PSS, PS synthase; PGS, PG synthase; PIS, PI synthase; SPT, serine palmitoyl transferase; CerS, ceramide synthase; SMase, sphingomyelinase; DES, dihydroceramide desaturase; Acetyl-CoA, acetyl coenzyme A; TCA, tricarboxylic acid. e, Enrichment analysis (Fisher’s exact test) performed on the coefficients from SSPG regression. Enriched annotations were calculated for positive coefficients with BH FDR < 10% (positive log2(odds)) and negative coefficients with BH FDR < 10% (negative log2(odds)). For enriched annotations, a BH FDR cut-off of 5% was applied. f, Correlations between clinical measures and lipid profiles for IR and IS. Correlations are shown when the correlations in IR and IS were significantly different and the absolute Δ correlations in IR and IS were >0.2. In addition, the overall correlations between lipids and clinical measures across IR and IS are depicted when the aforementioned two criteria were met. Source data
Fig. 4
Fig. 4. RVIs and vaccination.
a, Longitudinal sampling at five timepoints during RVIs: before infection (healthy), early event, late event, recovery and after infection (healthy). b, Lipid class breakdown for all detected lipids. Dark green depicts 210 significantly changed lipids throughout RVI. aEnriched subclass. Fisher’s exact test was used for the lipid class enrichment analysis of the significant lipids (BH FDR for each lipid subclass: CE, 3.35 × 10−4; CER, 0.95; DCER, 0.49; HCER, 0.87; LCER, 1; DAG, 1; FFA, 0.56; LPC, 6.32 × 10−8; LPE, 8.40 × 10−3; PC, 3.01 × 10−4; PE, 0.27; PE-O, 1.01 × 10−3; PE-P, 1.00 × 10−8; PI, 7.65 × 10−5; SM, 1; large TAG, 1; small TAG, 3.66 × 10−2). c, Lipid enrichment analysis for significantly changed lipids during RVI, across (left column) and within classes. d, Trajectory analysis of the 210 significantly changed lipids following RVI and their corresponding profiles in each cluster. e, Associations of lipid profiles in RVI and clinical measures. Depicted are correlations between the identified lipid clusters (d) and 50 clinical laboratory measures (BH FDR cut-off of 5%). Dot size depicts −log10(FDR); colour scale represents the correlation direction and degree. f, Differential profile of lipids that were significantly changed during RVI, comparing IR and IS. For each lipid feature, the shaded blocks demonstrate the time intervals during which the corresponding lipid was significantly different between IR and IS. The orange shaded blocks representing the lipid profiles at this time interval are dominant (with higher lipid levels) in IR, and the blue shaded blocks representing the lipid profiles at this time interval are dominant in IS. Source data
Fig. 5
Fig. 5. Age-associated changes in the lipidome.
a, Median ages, age range (horizontal lines) and number of visits (y axis) of 90 healthy participants. Violin plot shows the distribution of age within the cohort. Inner boxplot reports the 25% (left hinge), 50% (centre line) and 75% (right hinge) quantiles. Whiskers indicate observations equal to or outside the hinge ± 1.5× the IQR. Outliers (beyond 1.5× the IQR) are not plotted. b, Correlation of median BMI and median age across healthy participants. Vertical lines depict the BMI range for each participant across all collected healthy samples. Regression line (red) from a linear model is shown with the 95% confidence band (grey). c, Significantly (BH FDR < 5%) changed lipid subclasses (percentage change for the summed untransformed concentration of respective lipid species) with ageing across 5 years based on the Δage model controlling for BMI and sample storage length. d, Fisher’s exact test enrichment analysis comparing physicochemical properties associated with higher age (positive log2(odds), red, determined for all positive Δage model coefficients at the lipid species level with a BH FDR of <10%) and those associated with lower age (negative log2(odds), blue, determined for all negative Δage model coefficients at the lipid species level with a BH FDR of <10%). Enrichments were calculated independently within lipid subclasses, as well as across all lipid species (‘all’). log2(odds) values are depicted for significant associations with lower or higher age (BH FDR < 5%). Infinite log2(odds) values are imputed with 0.5× the mean value of positive/negative log2(odds) determined across all data. MUFA, monounsaturated FA. e, Δage coefficients (ageing–sex) of individual lipid subclasses for male and female participants, controlling for sample storage length and BMI. f, Δage coefficients (ageing–IR/IS) of individual lipid subclasses for IR and IS, controlling for storage length, BMI and sex. For e and f, data are presented as the mean of estimated coefficients ± s.d., determined using an ordinary least-squares regression test. Source data
Fig. 6
Fig. 6. Lipid–cytokine associations.
ae, Network of 1,245 significant (BH FDR < 5%) lipid–cytokine associations, indicating positive (red) and negative (blue) associations calculated across 1,180 samples, across all lipids (a) and for PCs (b), PEs (c), LPCs (d) and LPEs (e). Networks were pruned based on a BH FDR of 5% for coefficients determined in linear mixed-effects models. Colour indicates lipid class; edge width represents coefficients; and node size represents node connectivity (popularity). The network was assembled using the ‘graphopt’ layout algorithm. f, Fisher’s exact test enrichment analysis comparing the physicochemical properties of lipids (y axis), at the subclass, global FA and individual FA level, that are associated with a particular cytokine (x axis). The analysis was performed for TAGs only (i), for all non-TAG lipids (ii) and across all lipids (iii). Enrichments (log2(odds)) among lipids with positive β coefficients (BH FDR < 10%) are indicated in red; enrichments (log2(odds)) among lipids with negative β coefficients (BH FDR < 10%) are indicated in blue; black denotes cases for which a certain property was enriched in both populations (positive and negative associations). log2(odds) values are depicted when the respective annotation was significantly associated with a BH FDR of <5%. Infinite log2(odds) values are imputed with 0.5× the positive/negative log2(odds) values determined across all data. IL-1Ra, IL-1 receptor antagonist; ICAM1, intercellular adhesion molecule 1; SDF1⍺, stromal cell-derived factor 1⍺; RANTES, regulated on activation, normal T cell expressed and secreted; PDGF-BB, platelet-derived growth factor-BB; GRO⍺, growth-regulated ⍺ protein; FasL, Fas ligand; TRAIL, tumour necrosis factor-related apoptosis-inducing ligand. Source data
Extended Data Fig. 1
Extended Data Fig. 1. Principal component analysis for biosamples and quality controls.
Principal component analysis of imputed log10 estimated nmol/ml concentrations calculated using prcomp (scaled and centered data). Quality control (red) compared to biosamples (light blue) show distinct clustering. Source data
Extended Data Fig. 2
Extended Data Fig. 2. KNN-TN class-wise imputation.
KNN-TN imputation of missing values (blue) for different lipid classes. Y-axis denotes counts, x axis denotes log10 estimated concentrations (nmol/ml). Source data

Similar articles

Cited by

References

    1. Adewale BA. Will long-read sequencing technologies replace short-read sequencing technologies in the next 10 years? Afr. J. Lab. Med. 2020;9:1340. doi: 10.4102/ajlm.v9i1.1340. - DOI - PMC - PubMed
    1. Aebersold R, Mann M. Mass-spectrometric exploration of proteome structure and function. Nature. 2016;537:347–355. doi: 10.1038/nature19949. - DOI - PubMed
    1. Ferdosi S, et al. Engineered nanoparticles enable deep proteomics studies at scale by leveraging tunable nano–bio interactions. Proc. Natl Acad. Sci. USA. 2022;119:e2106053119. doi: 10.1073/pnas.2106053119. - DOI - PMC - PubMed
    1. Pinu FR, Goldansaz SA, Jaine J. Translational metabolomics: current challenges and future opportunities. Metabolites. 2019;9:108. doi: 10.3390/metabo9060108. - DOI - PMC - PubMed
    1. Newgard CB. Metabolomics and metabolic diseases: where do we stand? Cell Metab. 2017;25:43–56. doi: 10.1016/j.cmet.2016.09.018. - DOI - PMC - PubMed

Publication types