. 2023 Nov;5(11):2020-2035.
doi: 10.1038/s42255-023-00891-y. Epub 2023 Sep 11.

Molecular control of endurance training adaptation in male mouse skeletal muscle

Affiliations

Molecular control of endurance training adaptation in male mouse skeletal muscle

Regula Furrer et al. Nat Metab. 2023 Nov.

Abstract

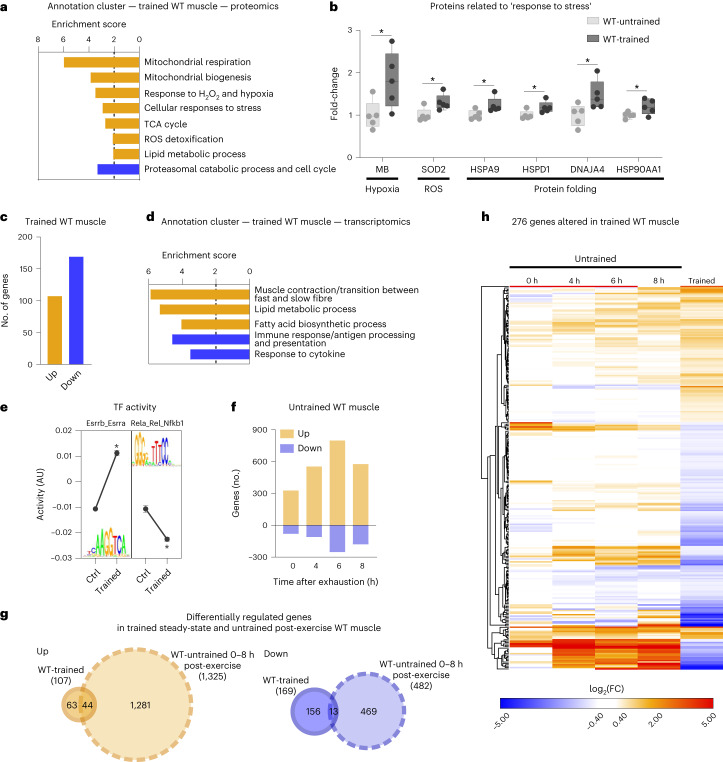
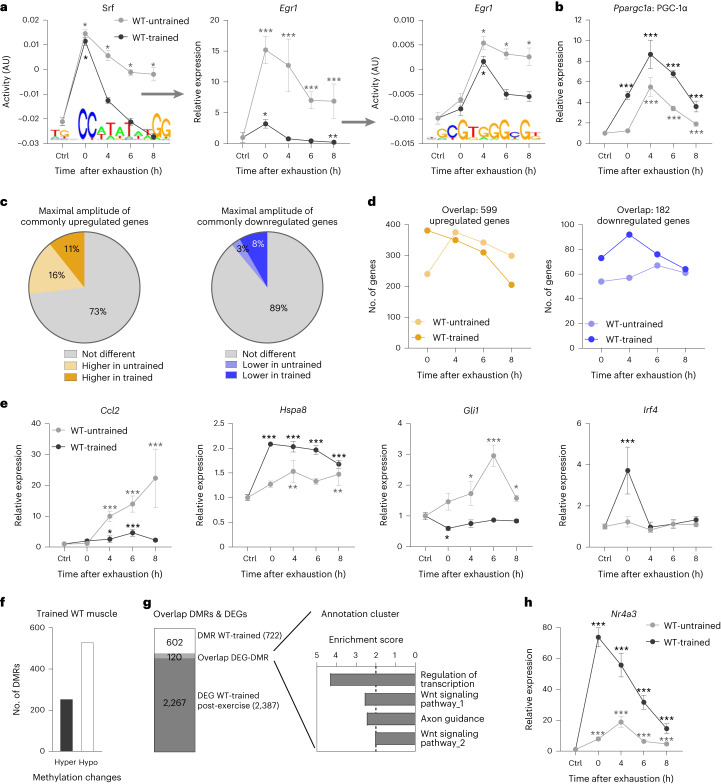
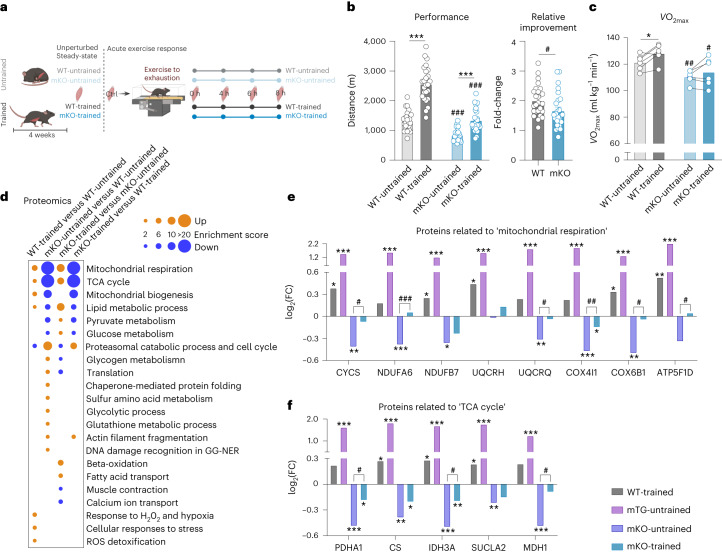
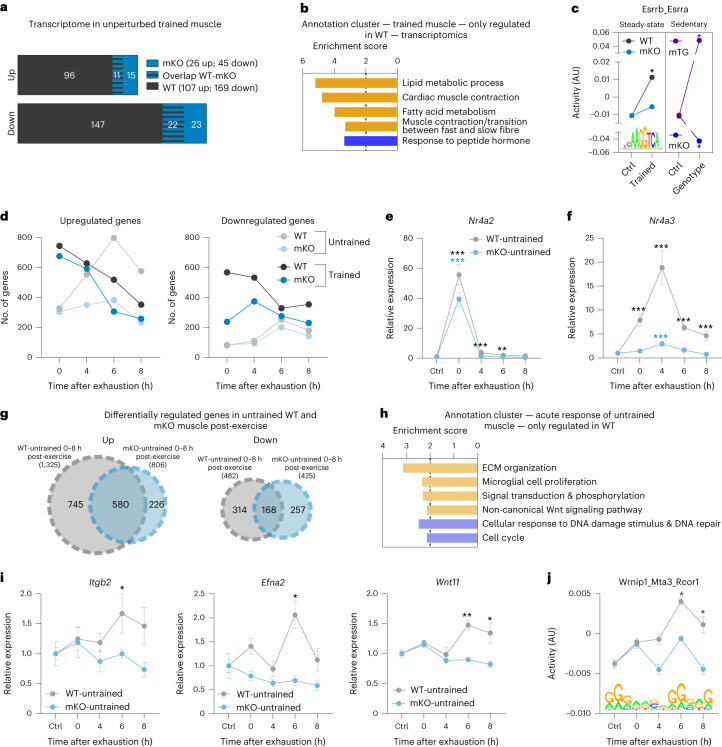
Skeletal muscle has an enormous plastic potential to adapt to various external and internal perturbations. Although morphological changes in endurance-trained muscles are well described, the molecular underpinnings of training adaptation are poorly understood. We therefore aimed to elucidate the molecular signature of muscles of trained male mice and unravel the training status-dependent responses to an acute bout of exercise. Our results reveal that, even though at baseline an unexpectedly low number of genes define the trained muscle, training status substantially affects the transcriptional response to an acute challenge, both quantitatively and qualitatively, in part associated with epigenetic modifications. Finally, transiently activated factors such as the peroxisome proliferator-activated receptor-γ coactivator 1α are indispensable for normal training adaptation. Together, these results provide a molecular framework of the temporal and training status-dependent exercise response that underpins muscle plasticity in training.


Conflict of interest statement

The authors declare no competing interests.

Figures

Fig. 1
Fig. 1. A low number of differentially expressed genes (DEGs) define a trained WT muscle.
a, All functional annotation clusters of up- (orange) and downregulated (blue) proteins in trained muscle with an enrichment score >2. ROS, reactive oxygen species. b, Examples of proteins involved in the response to stress in sedentary untrained (light grey) and unperturbed trained (dark grey) muscle (box plots display the median and the 25th to 75th percentiles and whiskers indicate the minimal and maximal values). c, Number of genes differentially expressed in unperturbed trained muscle (cut-off: FDR < 0.05; log2(FC) ± 0.6). d, All functional annotation clusters of up- (orange) and downregulated (blue) genes in trained muscle with an enrichment score >2. e, Motifs of transcription factors from ISMARA that are among those with the highest and lowest activity. AU, arbitrary units. f, Number of genes after an acute bout of exhaustion exercise that are up- (orange) and downregulated (blue). g, Venn diagram of all genes that are changed in unperturbed trained muscle (orange is upregulated and blue downregulated) and those that are regulated after an acute bout of maximal exercise (light colour, dashed line). h, Heatmap of all genes differentially expressed in unperturbed trained muscle to visualize the overlap with acutely regulated genes using Euclidean distance hierarchical clustering for rows. The data are from five biological replicates and represent mean ± s.e.m. (if not otherwise indicated). Statistics of proteomics data were performed using empirical Bayes-moderated t-statistics as implemented in the R/Bioconductor limma package and for RNA-seq data with the CLC Genomics Workbench Software. Exact P values of proteomics data and z-scores of ISMARA data are displayed in Source data. The asterisk indicates difference to control (Ctrl; pre-exercise condition) if not otherwise indicated: in b, *P < 0.05, in e, *z-score > 1.96 (Extended Data Fig. 1 and Supplementary Tables 1–4). Source data
Fig. 2
Fig. 2. Qualitative transcriptional response to exercise depends on training status.
a, Schematic representation of the experimental setup (illustration was created using BioRender.com with permission). b, Number of genes differentially expressed immediately (0 h), 4, 6 and 8 h after an acute bout of exhaustion exercise (cut-off: FDR < 0.05; log2(FC) ± 0.6) in untrained and trained muscle. c, Venn diagram of all significantly up- (orange) and downregulated (blue) genes (all timepoints merged) in untrained (light colour, dashed line) and trained (dark colour, solid line) muscle. d, Dot plot of all functional annotation clusters of up- (orange) and downregulated (blue) genes in untrained and trained muscle post-exercise, as well as unperturbed trained muscle with an enrichment score >2. e, Examples of gene trajectories in untrained (light grey) and trained (dark grey) muscle involved in axon guidance. f, Motif activities from ISMARA and expression changes of a predicted target gene that show an opposite regulation in untrained and trained muscle. The data are from five biological replicates and present mean ± s.e.m. Statistics of RNA-seq data were performed using the CLC Genomics Workbench Software. Exact FDR values of RNA-seq data and z-scores of ISMARA data are displayed in Source data. The asterisk indicates difference to Ctrl (pre-exercise condition): *P < 0.05 (for motif activity: *z-score > 1.96); **P < 0.01; ***P < 0.001 (Extended Data Figs. 2–4 and Supplementary Tables 3 and 4). Source data
Fig. 3
Fig. 3. Faster transcriptional response in trained WT muscle after one bout of exhaustion exercise.
a, Example of a possible transcriptional cascade including a top predicted transcription factor by ISMARA and one of the downstream targets (gene expression and motif activities). b, Example of a transcriptional regulator with distinct trajectories in untrained (light grey) and trained (dark grey) muscle. c, Proportion of commonly regulated genes with the same maximal amplitude (grey), higher amplitude in untrained muscle (light colour) or higher amplitude in trained muscle (dark colour). d, Visualization of the temporal trajectories of the commonly regulated genes (overlap from Fig. 2c) in untrained (light colour) and trained (dark colour) muscle (orange is upregulated and blue downregulated). e, Examples of different gene trajectories in untrained and trained muscle after an acute maximal exercise bout representing the different training status-specific transcriptional scenarios. f, Number of DMRs in an unperturbed trained muscle (hypermethylated is shown as a solid bar and hypomethylated as an open bar) compared with untrained sedentary WT muscle. g, Bar Venn diagram of DMRs of an unperturbed trained muscle (white) and DEGs after acute maximal exercise in trained muscle (dark grey) and the functional annotation clusters of the overlap (light grey, n = 120) with an enrichment score >2. h, Example of a transcription factor that is differentially methylated in trained muscle and more highly expressed after exercise in trained compared with untrained muscle. The data are from five biological replicates and represent mean ± s.e.m. Statistics of RNA-seq data were performed using the CLC Genomics Workbench Software. Exact FDR values of RNA-seq data and z-scores of ISMARA data are displayed in Source data. Differences in relative expression changes presented in d were calculated using a two-tailed Student’s t-test. The asterisk indicates difference to Ctrl (pre-exercise condition): *P < 0.05 (for motif activity: *z-score > 1.96); **P < 0.01; ***P < 0.001 (Extended Data Fig. 5 and Supplementary Tables 4, 6 and 7). Source data
Fig. 4
Fig. 4. PGC-1α is indispensable for normal physiological responses to long-term training.
a, Schematic representation of the experimental setup (illustration was created using BioRender.com with permission). b, Performance of untrained (light colour) and trained (dark colour) WT (grey) and mKO (blue) animals (WT-trained versus WT-untrained: mean difference (MD) = 1,242, 95% confidence interval (CI) = 946.1–1,539, P < 0.0001; mKO-trained versus mKO-untrained: MD = 500.9, 95% CI = 204.5–797.3, P = 0.0002; mKO-untrained versus WT-untrained: MD = −478.9, 95% CI = −775.3 to −182.5, P = 0.0003; and mKO-trained versus WT-trained: MD = −1,220, 95% CI = −1,517 to −924.1, P < 0.0001) and relative improvement of WT and mKO animals after 4 weeks of progressive treadmill training (MD = −0.3368, 95% CI = −0.6574 to −0.01625, P = 0.0399) (n = 25 biological replicates per group). c, Changes in VO2max before (light colour) and after (dark colour) training (WT post-training versus WT pre-training: MD = 6.833, 95% CI = 0.5067–13.16, P = 0.350; mKO post-training versus mKO pre-training: MD = 3.667, 95% CI = −2.66 to 9.993, P = 0.2926; mKO-untrained versus WT-untrained: MD = −11.00, 95% CI = −17.87 to −4.132, P = 0.0051; and mKO-trained versus WT-trained: MD = −14.17, 95% CI = −25.67 to −2.659, P = 0.0207) (n = 6 biological replicates per group). d, Dot plot of all functional annotation clusters of significantly altered proteins with an enrichment score >2. e,f, Examples of proteins involved in mitochondrial respiration (e) and TCA cycle (f) in WT-trained (grey; n = 5), mTG-untrained (pink; n = 5), mKO-untrained (dark blue; n = 6) and mKO-trained (blue; n = 5). Values are expressed relative to untrained WT sedentary controls (n = 5). Statistics of proteomics data were performed using empirical Bayes-moderated t-statistics as implemented in the R/Bioconductor limma package. Exact P values are displayed in Source data. To assess differences between untrained and trained animals and between genotypes, two-way ANOVA followed by Šídák’s multiple-comparison test (b and c) or two-tailed Student’s t-test was performed (relative improvement in b and c). The asterisk indicates difference to Ctrl (pre-exercise condition) if not otherwise indicated; hashtag indicates differences to the same condition in WTs: */#P < 0.05; **/##P < 0.01; ***/###P < 0.001 (Extended Data Fig. 6 and Supplementary Tables 1 and 2). Source data
Fig. 5
Fig. 5. PGC-1α is indispensable for the normal transcriptional response to acute maximal exercise.
a, Bar Venn diagram of the genes altered in unperturbed trained WT (grey) and mKO (blue) muscle. b, All functional annotation clusters of genes that are only up- (orange) and downregulated (blue) in trained muscle of WT animals (up: n = 96; down: n = 147) with an enrichment score >2. c, Motif of the transcription factors from ISMARA with the most significant activity change in trained WT animals and the comparison of the activity in trained mKO muscle (left blue), gain-of-function model (sedentary muscle-specific PGC-1α transgenics (mTG), purple) and loss-of-function model (sedentary mKO, dark blue). d, Number of genes that are up- and downregulated 0, 4, 6 and 8 h after an acute maximal exercise bout in untrained WT (light grey), trained WT (dark grey), untrained mKO (light blue) and trained mKO (dark blue) animals. e,f, Examples of gene trajectories with the peak expression immediately post-exercise (e) or at a later time (f) in untrained WT and mKO animals. g, Venn diagrams of all up- and downregulated genes after an acute bout of exercise in untrained WT (light grey) and mKO (light blue) mice. h, All functional annotation clusters of up- (orange) and downregulated (blue) genes that are regulated only in untrained WT mice (745 genes up- and 314 genes downregulated) with an enrichment score >2. i, Examples of genes involved in ECM organization, microglial cell proliferation and Wnt signalling that are regulated only in WT muscle. j, Prediction of the activity of a motif using ISMARA that is changed only in WT muscle and might be involved in the regulation of ECM-related genes. The data are from five biological replicates and represent mean ± s.e.m (if not otherwise stated). Statistics of RNA-seq data were performed using the CLC Genomics Workbench Software. Exact FDR values of RNA-seq data and z-scores of ISMARA data are displayed in Source data. The asterisk indicates difference to Ctrl (pre-exercise condition): *P < 0.05 (for motif activity: *z-score > 1.96); **P < 0.01; ***P < 0.001 (Extended Data Fig. 7 and Supplementary Tables 4 and 8). Source data
Fig. 6
Fig. 6. PGC-1α controls exercise-linked DNA methylation events.
a, Venn diagrams of all up- and downregulated genes after an acute bout of maximal exercise in trained WT (dark grey) and mKO (dark blue) mice. b, All functional annotation clusters of up- (orange) and downregulated (blue) genes that are regulated only in trained WT mice (487 genes up- and 755 genes downregulated) with an enrichment score >2. c, Dot plot of all functional annotations clusters of up- (orange) and downregulated (blue) genes after an acute bout of maximal exercise in untrained and trained WT and mKO animals. d, Examples of genes involved in ECM organization in trained WT (grey) and mKO (blue) mice. e, Prediction of the activity of motifs using ISMARA that are changed only in WT muscle and linked to inflammation. f, Number of DMRs in trained mKO compared with untrained mKO muscle (hypermethylated is shown as a solid bar and hypomethylated as an open bar). g,h, Number of hyper- (solid bars) and hypomethylated (open bars) regions 0 and 4 h after exhaustion in untrained WT (g) and untrained mKO (h) animals compared with untrained sedentary animals of the respective genotype. i, All functional annotation clusters of genes that are differentially methylated and transcriptionally regulated after an acute bout of exercise in untrained WT (grey) and mKO (blue) mice. The data are from five biological replicates. Statistics of RNA-seq data were performed using the CLC Genomics Workbench Software. Exact FDR values of RNA-seq data and z-scores of ISMARA data are displayed in Source data. The asterisk indicates difference to control animals of the respective genotype: *P < 0.05 (for motif activity: *z-score > 1.96). (Extended Data Figs. 7 and 8 and Supplementary Tables 3, 4 and 6–8). Source data
Fig. 7
Fig. 7. Schematic representation of the molecular exercise response.
An acute bout of exercise disrupts the cellular homeostasis of the muscle and initiates a cascade of events including short-term epigenetic and transcriptional changes (change from baseline up is upregulated/hypermethylated; change from baseline down is downregulated/hypomethylated). These alterations promote the restoration of homeostasis and prepare the muscle for recurrent insults. With repeated exercise bouts over time, a trained muscle is established, hallmarked by morphological and functional adaptations that improve performance. This state is characterized by substantial proteomic remodelling, however, in the context of a small number of chronically maintained gene expression modulations. Persistent modifications of epigenetic marks prime the response of the trained muscle to recurring acute exercise bouts. Hence, a trained muscle responds more rapidly to an acute maximal exercise bout and shows a prominent repression of genes. Approximately 50% of the upregulated and 85% of the downregulated transcriptome of a trained muscle are specific to this condition and not altered in an untrained muscle post-exercise. Collectively, the molecular response to an acute bout of exercise is training status dependent and substantial qualitative and quantitative changes in gene expression events were observed in trained compared with those that occur in untrained muscle.
Extended Data Fig. 1
Extended Data Fig. 1. Proteomic and phosphoproteomic changes in a trained WT muscle.
a, Changes in maximal running distance after 4 weeks of progressive treadmill training (n = 6 per group; mean difference (MD) = 802.3, 95% confidence interval (CI) = 80.62 to 1524, p = 0.0355). b-c, Examples of proteins represented in the annotations clusters of b) mitochondrial respiration and lipid metabolic process and c) proteasomal catabolic process in a sedentary untrained (light gray) and training (dark gray) muscle. d, All significant (FDR < 0.05) GO Biological Pathways of proteins with altered phosphorylation status after 4 weeks of training. e, Correlation plot of the transcriptome and proteome of trained muscle. Only depicting genes/proteins that are significantly altered in the proteomics analysis of a trained muscle (cutoff: p < 0.05; Log2FC ± 0.2). The colored (orange = up; blue = down) genes/proteins are also significantly altered on a transcriptional level in a trained muscle (FDR < 0.05; Log2FC ± 0.2). f, Representative proteins involved in mitochondrial respiration that are significantly increased in a trained muscle (solid orange line = mean ± SEM with light color) and acutely regulated on a transcriptional level post-exercise (gray line). g, The regulation of genes after one bout of maximal exercise in untrained muscle (gray line) as well as the steady-state level of the transcript in unperturbed trained muscle (solid line in orange = upregulated, blue = downregulated or gray = unchanged ± SEM in lighter color). Genes representing the different scenarios: same direction in both trained muscle as well as after an acute bout of maximal exercise; only changed in trained muscle; only regulated after an acute maximal exercise bout; or upregulated after an acute challenge and downregulated after training. Data from 5 biological replicates (if not otherwise indicated). Data represent means ± SEM (except for b-c where the box plots display the median and the 25th to 75th percentiles and whiskers indicate the minimal and maximal values). Statistics of proteomics data were performed using empirical Bayes moderated t-statistics as implemented in the R/Bioconductor limma package and for RNA-seq data with the CLC genomics workbench software. Exact p-values of proteomics data and FDR-values of RNA-seq data are displayed in the Source Data file. For the running distance (a) a paired two-tailed Student’s t-test was performed. * indicates difference to Ctrl (pre-exercise condition) if not otherwise indicated; *<0.05; **<0.01; ***<0.001. See also Fig. 1; Supplementary Tables 1, 2, 5. Source data
Extended Data Fig. 2
Extended Data Fig. 2. Distinct gene sets induced upon acute exercise in untrained and trained WT muscle.
a-b, All functional annotation clusters of up- (orange) and downregulated (blue) genes after an acute maximal exercise bout in untrained (a) and trained (b) muscle with an enrichment score >2. c, Examples of gene trajectories in untrained (light gray) and trained (dark gray) muscle involved in ECM organization. Exact FDR-values are displayed in Source Data file. d, Schematic representation of genes involved in axon guidance and the possible functional consequences. The left square below each gene name represents the untrained response and the right square the trained response. Red = upregulated; blue = downregulated (illustration was created with BioRender.com with permission). Data from 5 biological replicates. Data represent means ± SEM. Statistics of RNA-seq data were performed with the CLC genomics workbench software. * indicates difference to Ctrl (pre-exercise condition); *<0.05; ***<0.001. See also Fig. 2; Supplementary Table 3. Source data
Extended Data Fig. 3
Extended Data Fig. 3. Divergent predicted motif activities of transcription factors in untrained and trained WT muscle.
a, Number of motifs of transcription factors from ISMARA that have an increased or decreased activity (z-score >1.96) per time point in an untrained (light gray) and trained (dark gray) muscle after an acute maximal exercise bout. b, Venn diagram of all the predicted motifs that are changes in untrained (light gray) and trained (dark gray) muscle after an acute exercise bout. c-d, Trajectories of motif activity of transcription factors from ISMARA in untrained (light gray) and trained (dark gray) muscle post-exercise that are either specific to training status (c) or show an exacerbation after training (d). e, Example of a possible transcriptional cascade including a top predicted transcription factor by ISMARA and one of the downstream targets (gene expression and motif activities). Exact FDR-values of RNA-seq data and z-scores of ISMARA data are displayed in the Source Data file. Data from 5 biological replicates. Data represent means ± SEM. Statistics of RNA-seq data were performed with the CLC genomics workbench software. * indicates difference to Ctrl (pre-exercise condition); *<0.05 (for motif activity: * z-score >1.96); ***<0.001. See also Fig. 2; Supplementary Table 4. Source data
Extended Data Fig. 4
Extended Data Fig. 4. Cellular specification of the transcriptional response to exercise depends on training status.
a, UMAP plot of public available single cell and single nucleus RNA-seq datasets, to demonstrate the cellular specification of the exercise response in muscle (FAP = fibro-adipogenic progenitors; MuSC = muscle stem cells; MTJ = myotendinous junction; NMJ = neuromuscular junction). b-c, Deconvolution of genes involved in ECM remodeling (b) and axon guidance (c) that are upregulated in untrained and downregulated in trained muscle. See also Fig. 2. Source data
Extended Data Fig. 5
Extended Data Fig. 5. Quantitative differences between the exercise response of untrained and trained WT muscle.
a, Representative examples of genes with the same maximal amplitude of gene expression (up- or downregulated) that show a phase shift towards an earlier time point in trained muscle after acute maximal exercise (dark gray) compared to untrained muscle (light gray). b, Representation of the time points when peak expression is reached in either the 599 commonly upregulated genes or all upregulated genes in untrained and trained muscle post-exercise. c-e, Examples of differentially methylated genes involved in transcription (c), Wnt signaling (d) and axon guidance (e) in untrained (light gray) and trained (dark gray) muscle post-exercise. f, Pie chart of the proteome of a trained muscle with the corresponding correlation with the transcriptome of an unperturbed trained muscle or an untrained or trained muscle after an acute bout of maximal exercise. The gray area depicts the proportion of proteins that are not regulated on a transcriptional level. The colored parts (orange = upregulated and blue = downregulated) represent an overlap with the transcriptome of either unperturbed trained muscle or untrained or trained muscle post-exercise. Data from 5 biological replicates. Data represent means ± SEM. Statistics of proteomics data were performed using empirical Bayes moderated t-statistics as implemented in the R/Bioconductor limma package and for RNA-seq data with the CLC genomics workbench software. All exact FDR-values are displayed in Source Data file. * indicates difference to Ctrl (pre-exercise condition); *<0.05; **<0.01; ***<0.001. See also Fig. 3; Supplementary Table 1. Source data
Extended Data Fig. 6
Extended Data Fig. 6. PGC-1α is essential for normal training adaptation.
a, Blood lactate level pre- (bar with stripes) and post-exercise (filled bar) in untrained and trained WT (gray) and mKO (blue) animals after an acute bout of maximal exercise (WT-Untrained post vs WT-Untrained pre: MD = 1.332, 95% CI = 0.3739 to 2.289, p = 0.0027; WT-Trained post vs WT-Trained pre: MD = 1.2, 95% CI = 0.2666 to 2.133, p = 0.0063; mKO-Untrained post vs mKO-Untrained pre: MD = 5.145, 95% CI = 4.212 to 6.078, p < 0.0001; mKO-Trained post vs mKO-Trained pre: MD = 5.660, 95% CI = 4.727 to 6.593, p < 0.0001; mKO-Untrained pre vs WT-Untrained pre: MD = 0.2016, 95% CI = −0.3026 to 0.7058, p = 0.4231; mKO-Untrained post vs WT-Untrained post: MD = 4.015, 95% CI = 2.977 to 5.053, p < 0.0001; mKO-Trained pre vs WT-Trained pre: MD = 0.5450, 95% CI = 0.0586 to 1.031, p = 0.291; mKO-Trained post vs WT-Trained post: MD = 5.005, 95% CI = 4.122 to 5.888, p < 0.0001); n = 20 biological replicates per group. b, Volcano plot of the proteome of trained mKO muscle compared to trained WT muscle. c-d, Examples of proteins involved in the response to stress (c) and lipid metabolic process (d) in trained WT (gray; n = 5), untrained sedentary mTG (pink; n = 5), untrained sedentary mKO (dark blue; n = 6) and trained mKO (blue; n = 5). Values are expressed relative to the untrained sedentary WT control (n = 5). Exact p-values are displayed in Supplementary Table 1. e, All significant (FDR < 0.05) GO Biological Pathways of proteins with altered phosphorylation status after 4 weeks of training in mKO (compared to untrained sedentary mKO). f, Volcano plot of the transcriptome of untrained sedentary mKO muscle compared to that of untrained sedentary WT muscle. g, Venn diagram of all predicted motifs that are changes in unperturbed trained WT (gray) and mKO (blue) muscle. Data from 5 biological replicates (if not otherwise indicated). Statistics of proteomics data were performed using empirical Bayes moderated t-statistics as implemented in the R/Bioconductor limma package and for RNA-seq data with the CLC genomics workbench software. Exact p-values of proteomics data and FDR-values of RNA-seq data are displayed in the Source Data file. To assess differences between untrained and trained animals as well as between genotypes in panel a, two-way ANOVA followed by Šídák’s multiple comparisons test (repeated measures pre-post) or two-tailed Student t-test were performed (between genotypes of the same condition) * indicates difference to Ctrl (pre-exercise condition in a or untrained sedentary WT in c-d); # indicates difference between mKO and WT of the same condition in panel a or between mKO-Trained and mKO-Untrained in panels c-d; *<0.05; **<0.01; ***<0.001. See also Fig. 4; Supplementary Tables 1, 2, 4. Source data
Extended Data Fig. 7
Extended Data Fig. 7. Altered transcriptional response to acute exercise in muscles lacking PGC-1α.
a, All annotation clusters of genes that are significantly up- (orange) or downregulated (blue) in untrained mKO animals after a maximal exercise bout with an enrichment score >2. b, Venn diagram of all predicted motifs that are changes after an acute maximal exercise bout in untrained WT (gray) and mKO (blue) animals. All time points are merged. c, All annotation clusters of genes that are significantly up- (orange) or downregulated (blue) in trained mKO animals after a maximal exercise bout with an enrichment score >2. d, Dot plot of all significant (FDR < 0.05) GO Biological Processes of the downregulated genes at the 0 h time point in trained WT and mKO animals. The two left columns represent all downregulated genes at 0 h in trained WT compared to untrained WT and trained mKO compared to untrained mKO. The third column represents genes that are downregulated in both the trained WT and mKO compared to the respective control. The last column represents the genes that are only downregulated at the 0 h time point in the trained WT animals, but not the mKOs. e, Venn diagram of all predicted motifs that are changes after an acute exercise bout in trained WT (gray) and mKO (blue) animals. All time points are merged. Data from 5 biological replicates. Statistics of RNA-seq data were performed with the CLC genomics workbench software. See also Figs. 5–6; Supplementary Tables 4, 8. Source data
Extended Data Fig. 8
Extended Data Fig. 8. Gain- and loss-of-function of PGC-1α affects DNA methylation events.
a, Bar Venn diagram of differentially methylated regions (DMRs) of an unperturbed trained WT (dark gray) and mKO (dark blue) muscle. The common DMR are striped (gray and blue). b, Venn diagram of DMRs of an unperturbed trained mKO muscle (open circle) and differentially expressed genes (DEG) after acute maximal exercise in trained mKO muscle (blue circle). c, Bar Venn diagram of the DMRs that are associated with acute gene expression changes (overlap Fig. 3g and panel b of this figure) of WT (dark gray) and mKO (dark blue) animals. d, All functional annotation clusters of the overlap of panel b (n = 110) with an enrichment score >2. e, Trajectories of transcription factors in untrained (light blue) and trained (blue) mKO mice that are differentially methylated after training. f, Bar Venn diagram of DMRs of an untrained WT or mKO muscle after an acute bout of maximal exercise (light gray or blue, respectively; 0 h and 4 h time point merged) and those of an unperturbed trained WT or mKO muscle (dark gay or blue, respectively). The common DMRs are striped (gray and blue). g-h, Venn diagram of WT (g) and mKO muscle (h) depicting all DMRs in untrained muscle after an acute bout of maximal exercise (open circles) and DEGs upon an acute bout of maximal exercise (colored circle). i, Number of DMRs in untrained sedentary mTG muscle (hypermethylated = solid bar; hypomethylated = open bar) compared to untrained sedentary WT muscle. j, Bar Venn diagram of DMRs of an unperturbed trained WT (dark gray) and untrained mTG (pink) muscle. The common DMRs are striped (gray and pink). k, Venn diagram of DMRs (open circle) and DEG (blue circle) of an untrained sedentary mTG muscle. l, Venn diagrams of all up- and downregulated genes in untrained sedentary mTG muscle (pink) and after an acute bout of exercise in untrained (light orange or blue) and trained (darker orange and blue) muscle. m, Top 3 functional annotation clusters of the up- (orange) and downregulated (blue) proteins in sedentary mTG muscle compared to sedentary WT. Data from 5 biological replicates. Data represent means ± SEM. Statistics of proteomics data were performed using empirical Bayes moderated t-statistics as implemented in the R/Bioconductor limma package and for RNA-seq data with the CLC genomics workbench software. Exact FDR-values of RNA-seq data are displayed in the Source Data file. * indicates difference to Ctrl (pre-exercise condition); *<0.05; **<0.01; ***<0.001. See also Fig. 6; Supplementary Tables 1, 2, 6, 7. Source data
Extended Data Fig. 9
Extended Data Fig. 9. PCA scatter plot of the different RNA-seq datasets.
a, b, Principal component analysis (PCA) scatter plots of RNA-seq data of untrained (a) and trained (b) WT muscle after an acute bout of maximal exercise. c, PCA scatter plot of RNA-seq data of untrained and trained unperturbed WT and mKO muscle. d, e, PCA scatter plots of RNA-seq data of untrained (d) and trained (e) mKO muscle after an acute bout of maximal exercise.

References

    1. Chow LS, et al. Exerkines in health, resilience and disease. Nat. Rev. Endocrinol. 2022;18:273–289. - PMC - PubMed
    1. Murphy RM, Watt MJ, Febbraio MA. Metabolic communication during exercise. Nat. Metab. 2020;2:805–816. - PubMed
    1. Egan B, Sharples AP. Molecular responses to acute exercise and their relevance for adaptations in skeletal muscle to exercise training. Physiol. Rev. 2023;103:2057–2170. - PubMed
    1. Furrer R, Hawley JA, Handschin C. The molecular athlete: exercise physiology from mechanisms to medals. Physiol. Rev. 2023;103:1693–1787. - PMC - PubMed
    1. Leuchtmann AB, Adak V, Dilbaz S, Handschin C. The role of the skeletal muscle secretome in mediating endurance and resistance training adaptations. Front. Physiol. 2021;12:709807. - PMC - PubMed