. 2023 Oct;26(10):1739-1750.
doi: 10.1038/s41593-023-01426-0. Epub 2023 Sep 11.

Norepinephrine modulates calcium dynamics in cortical oligodendrocyte precursor cells promoting proliferation during arousal in mice

Affiliations

Norepinephrine modulates calcium dynamics in cortical oligodendrocyte precursor cells promoting proliferation during arousal in mice

Tsai-Yi Lu et al. Nat Neurosci. 2023 Oct.

Abstract

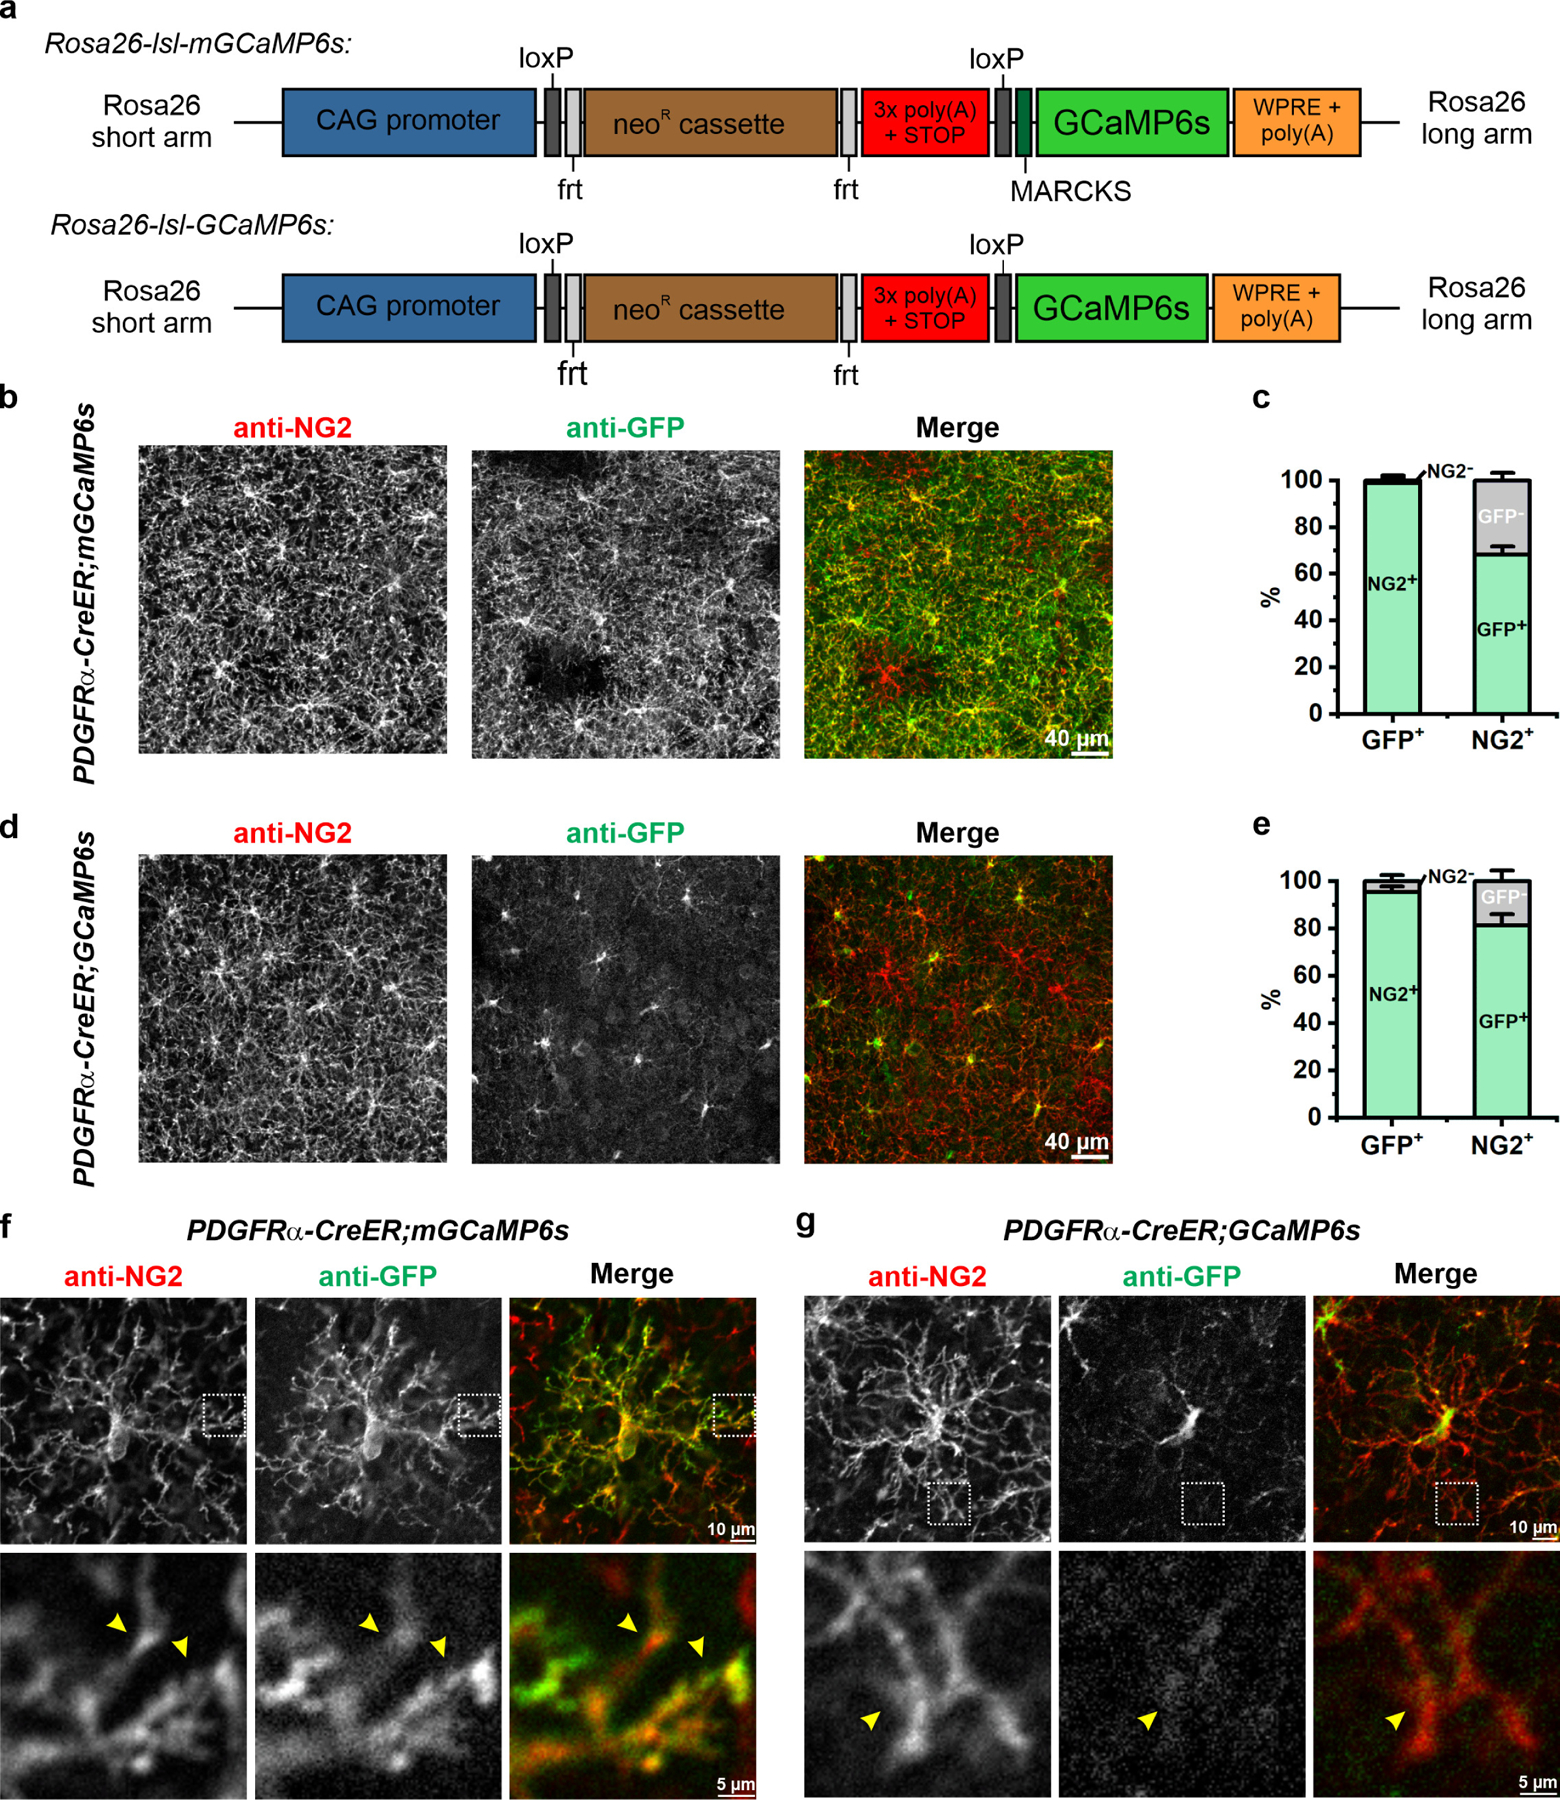
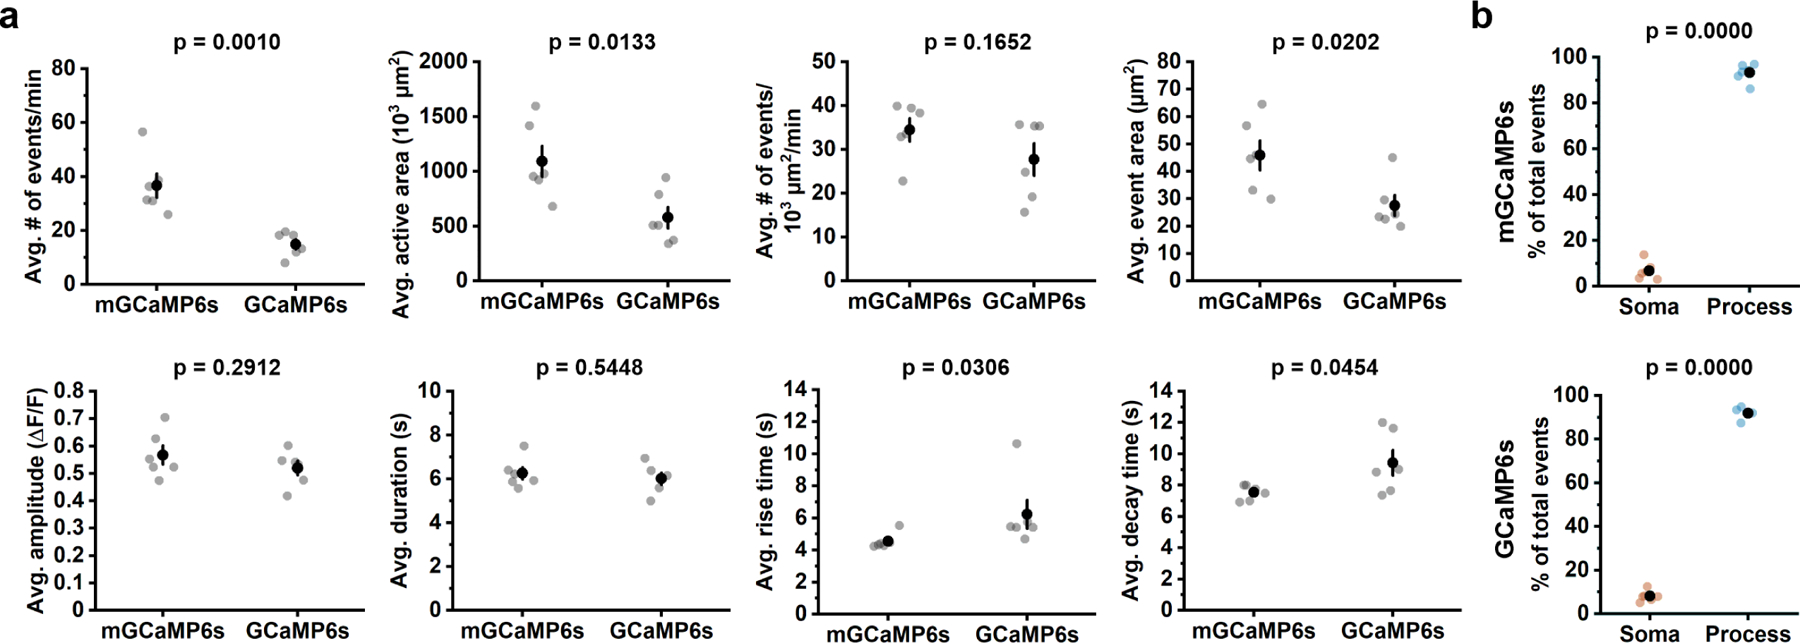
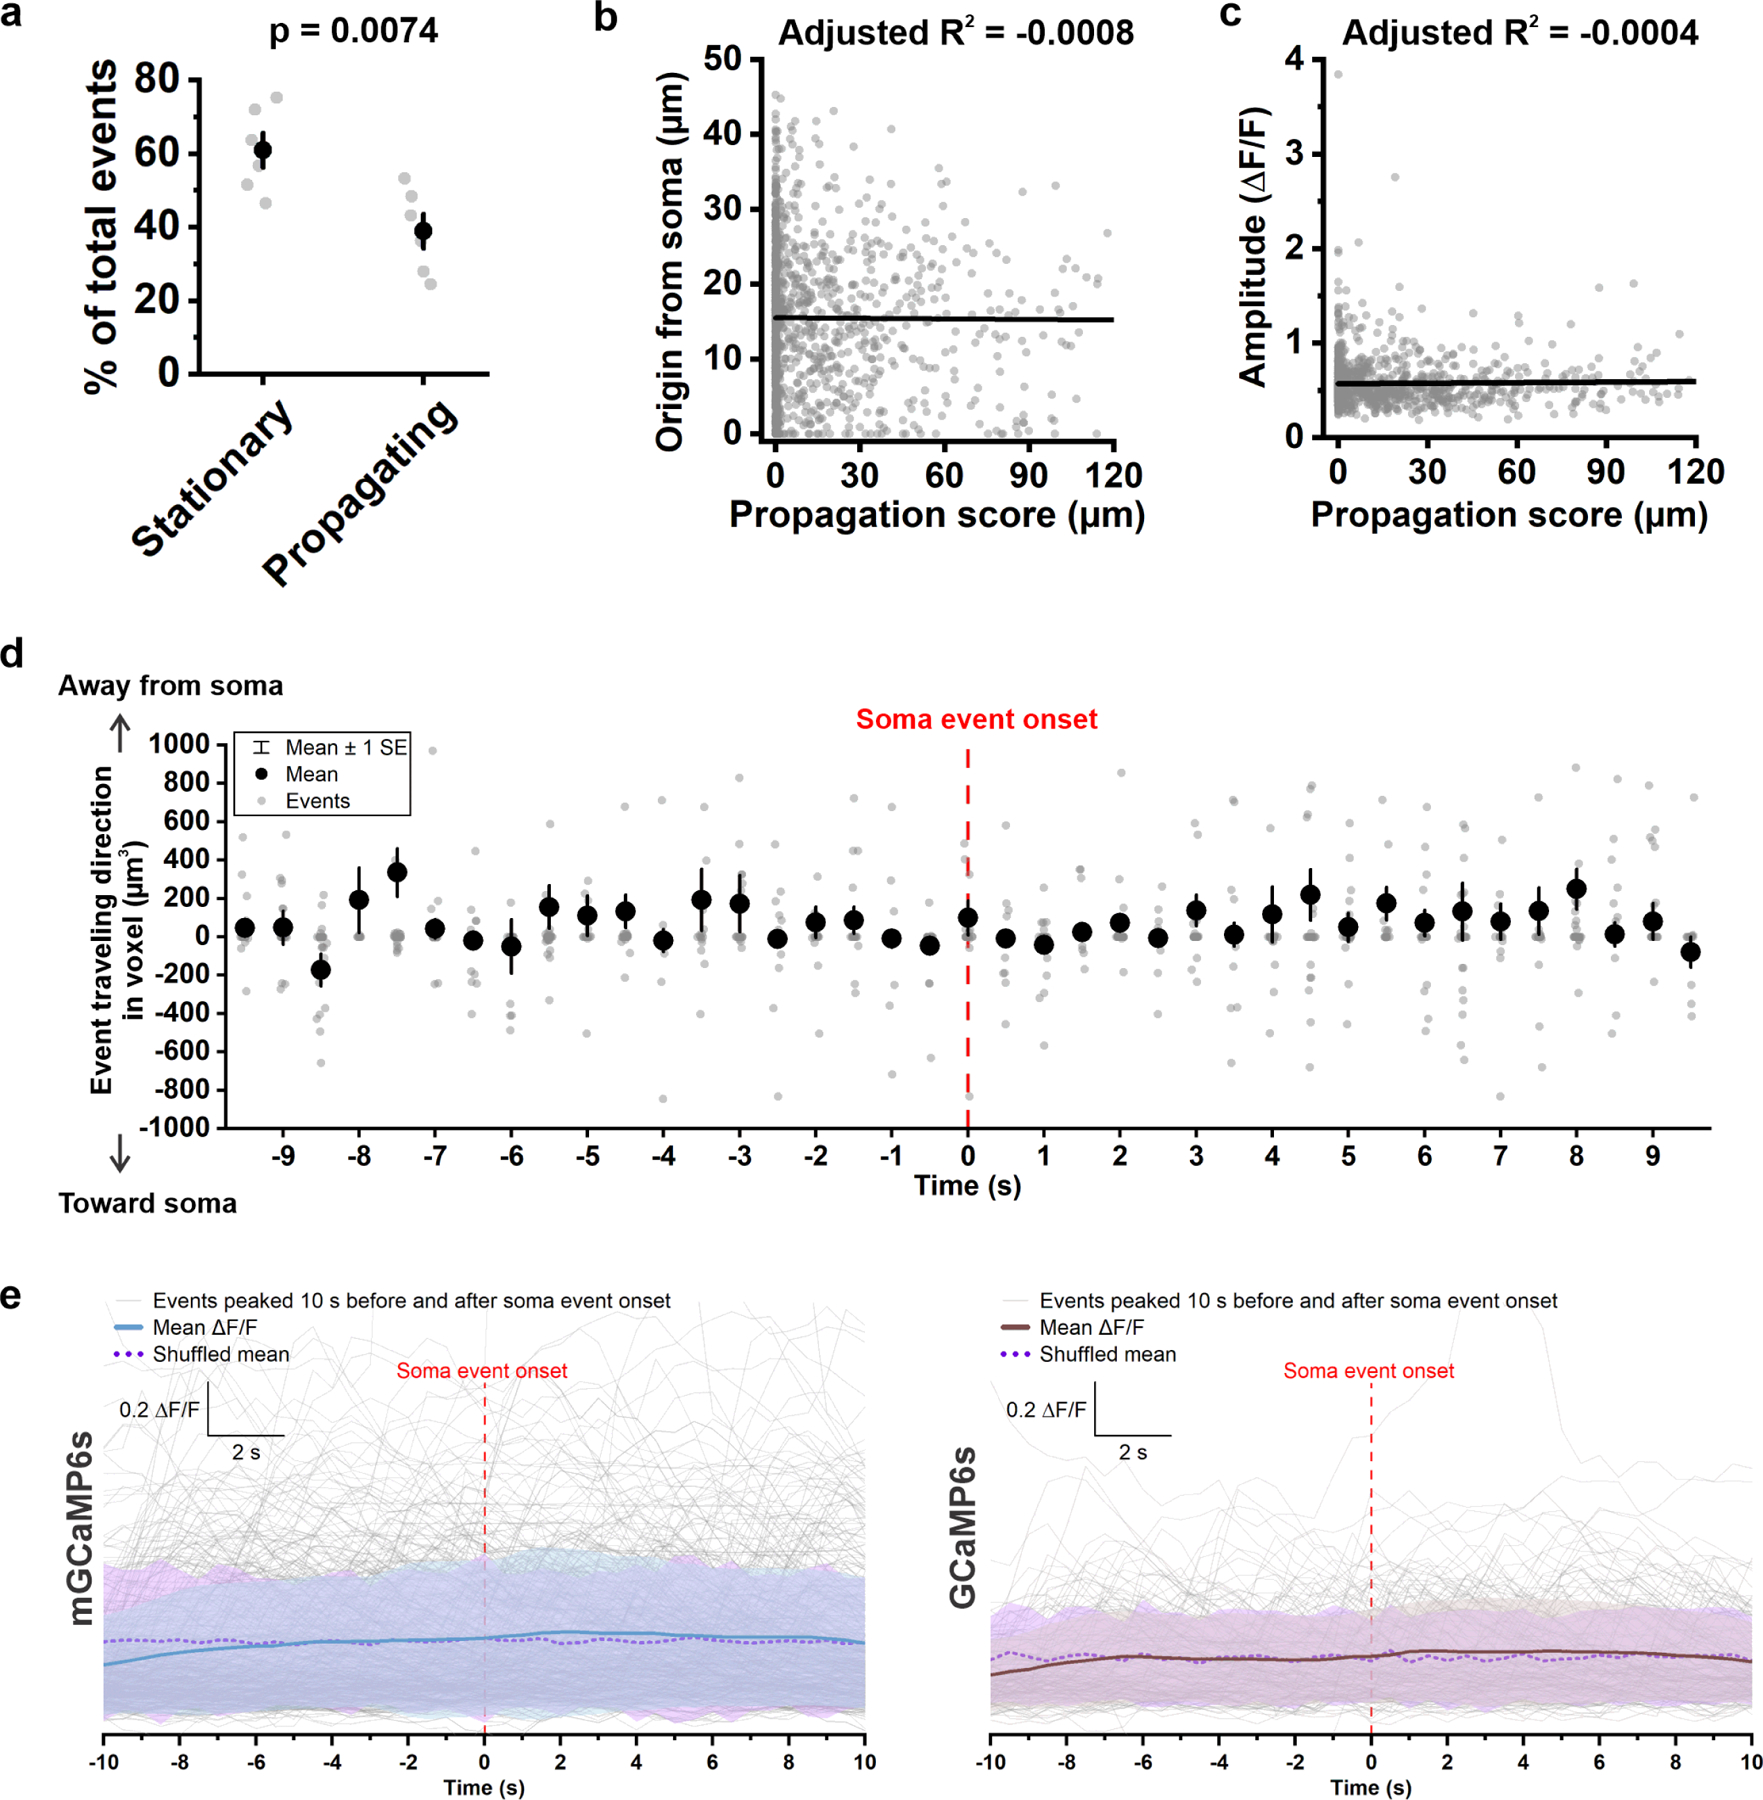
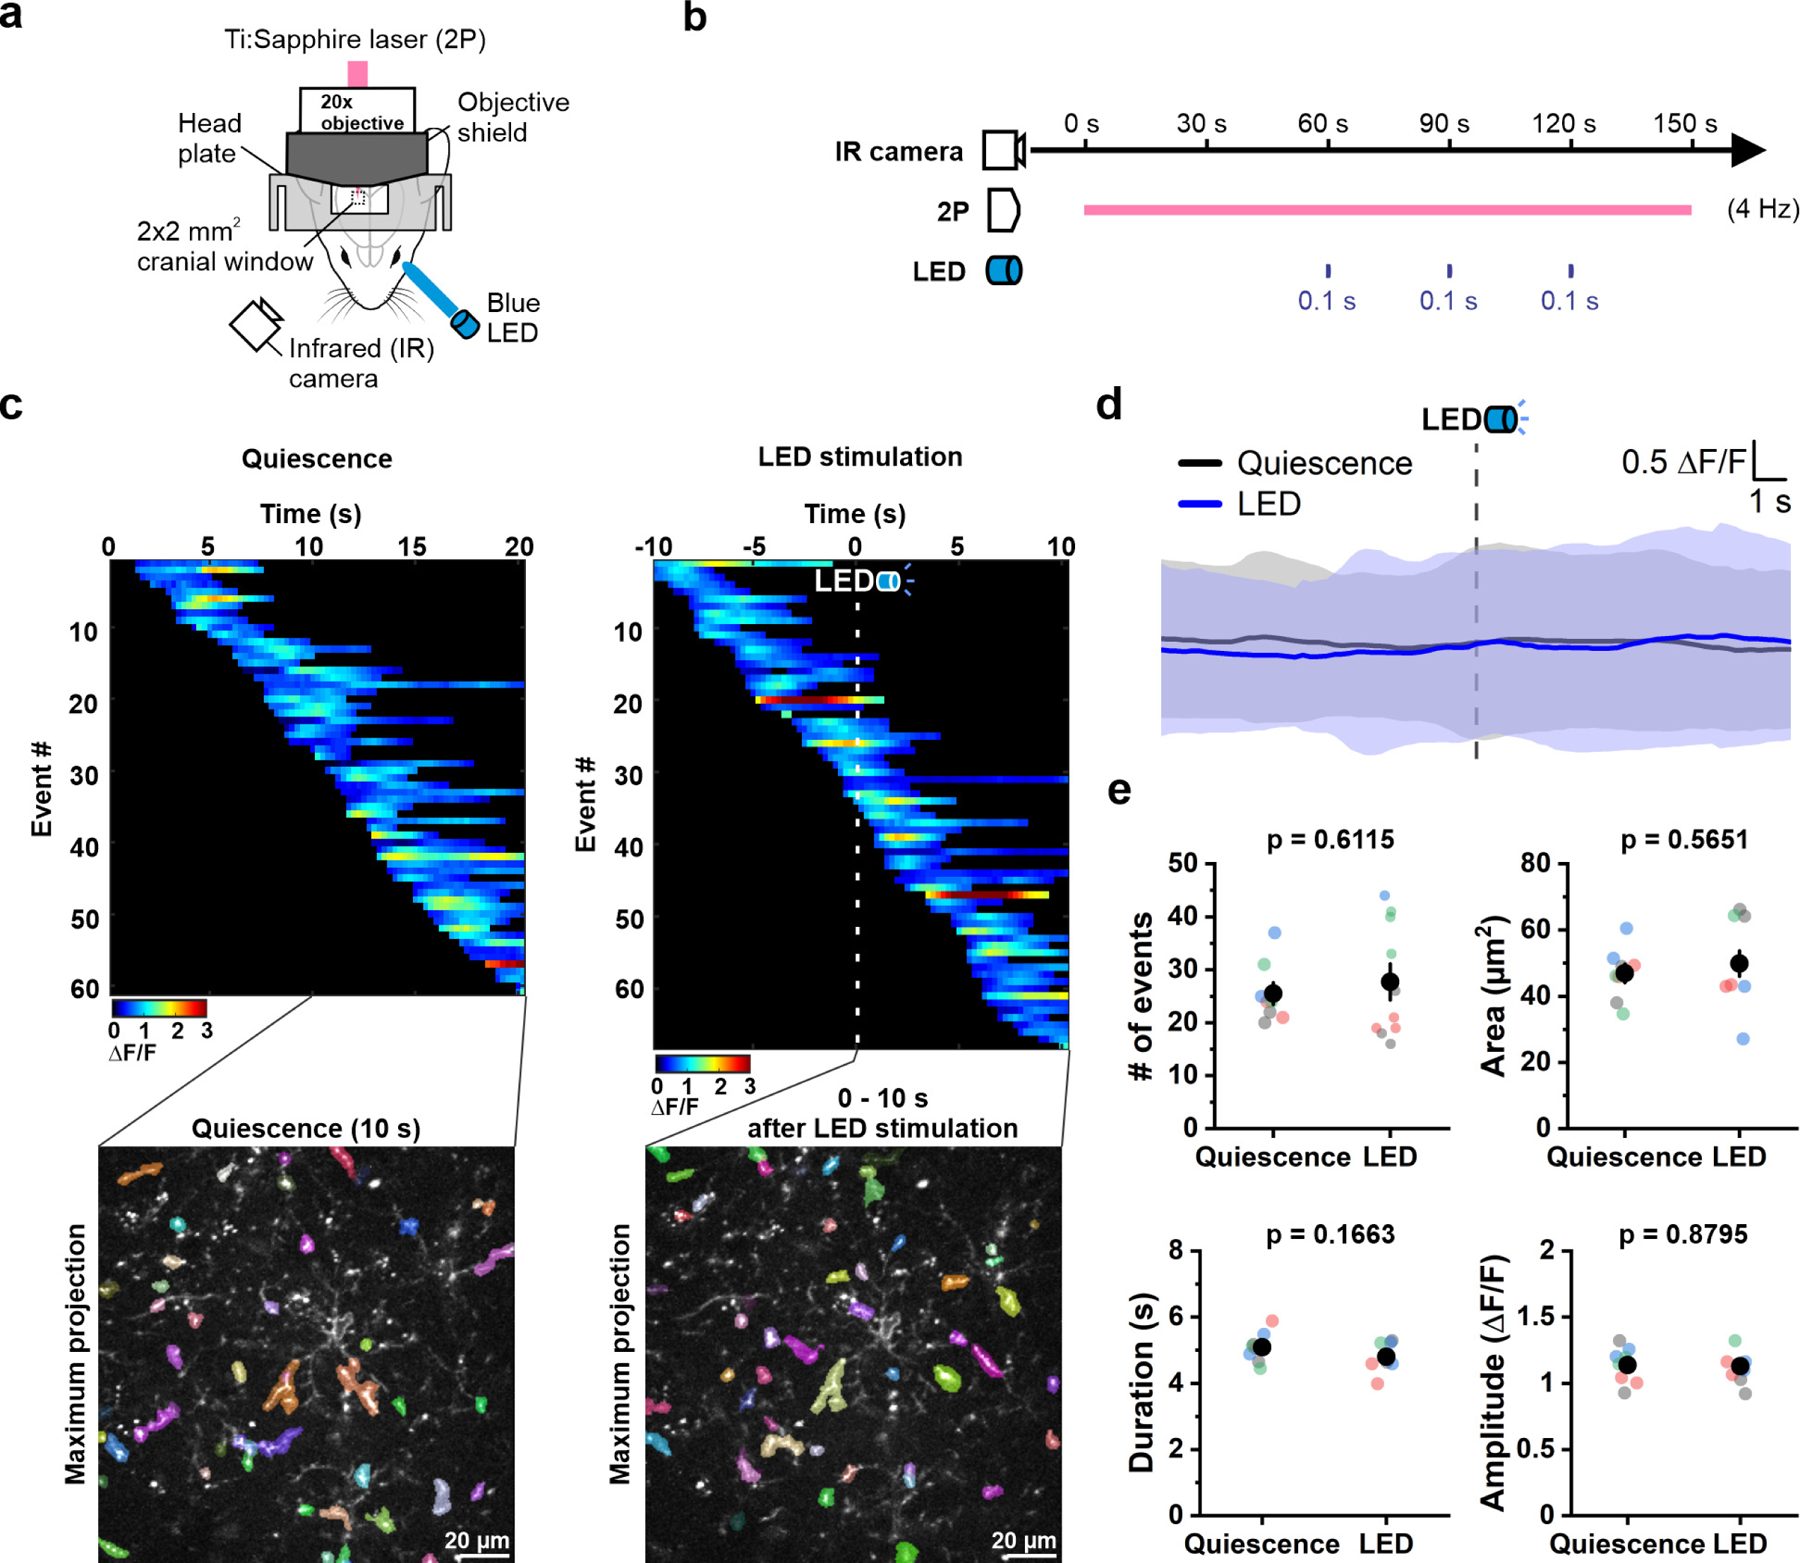
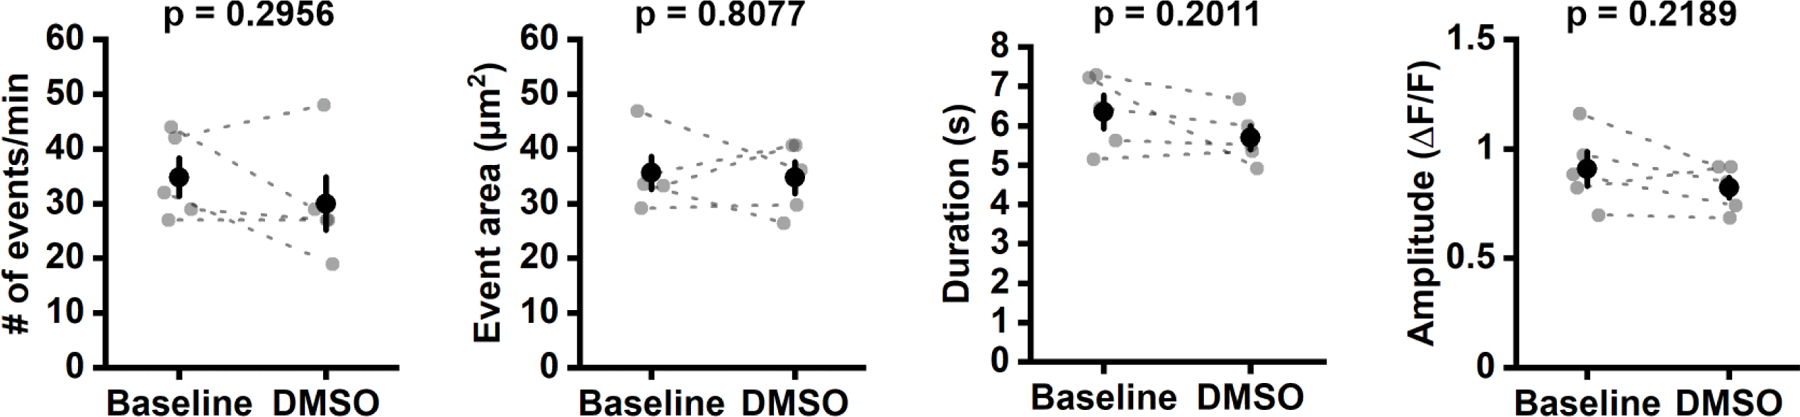
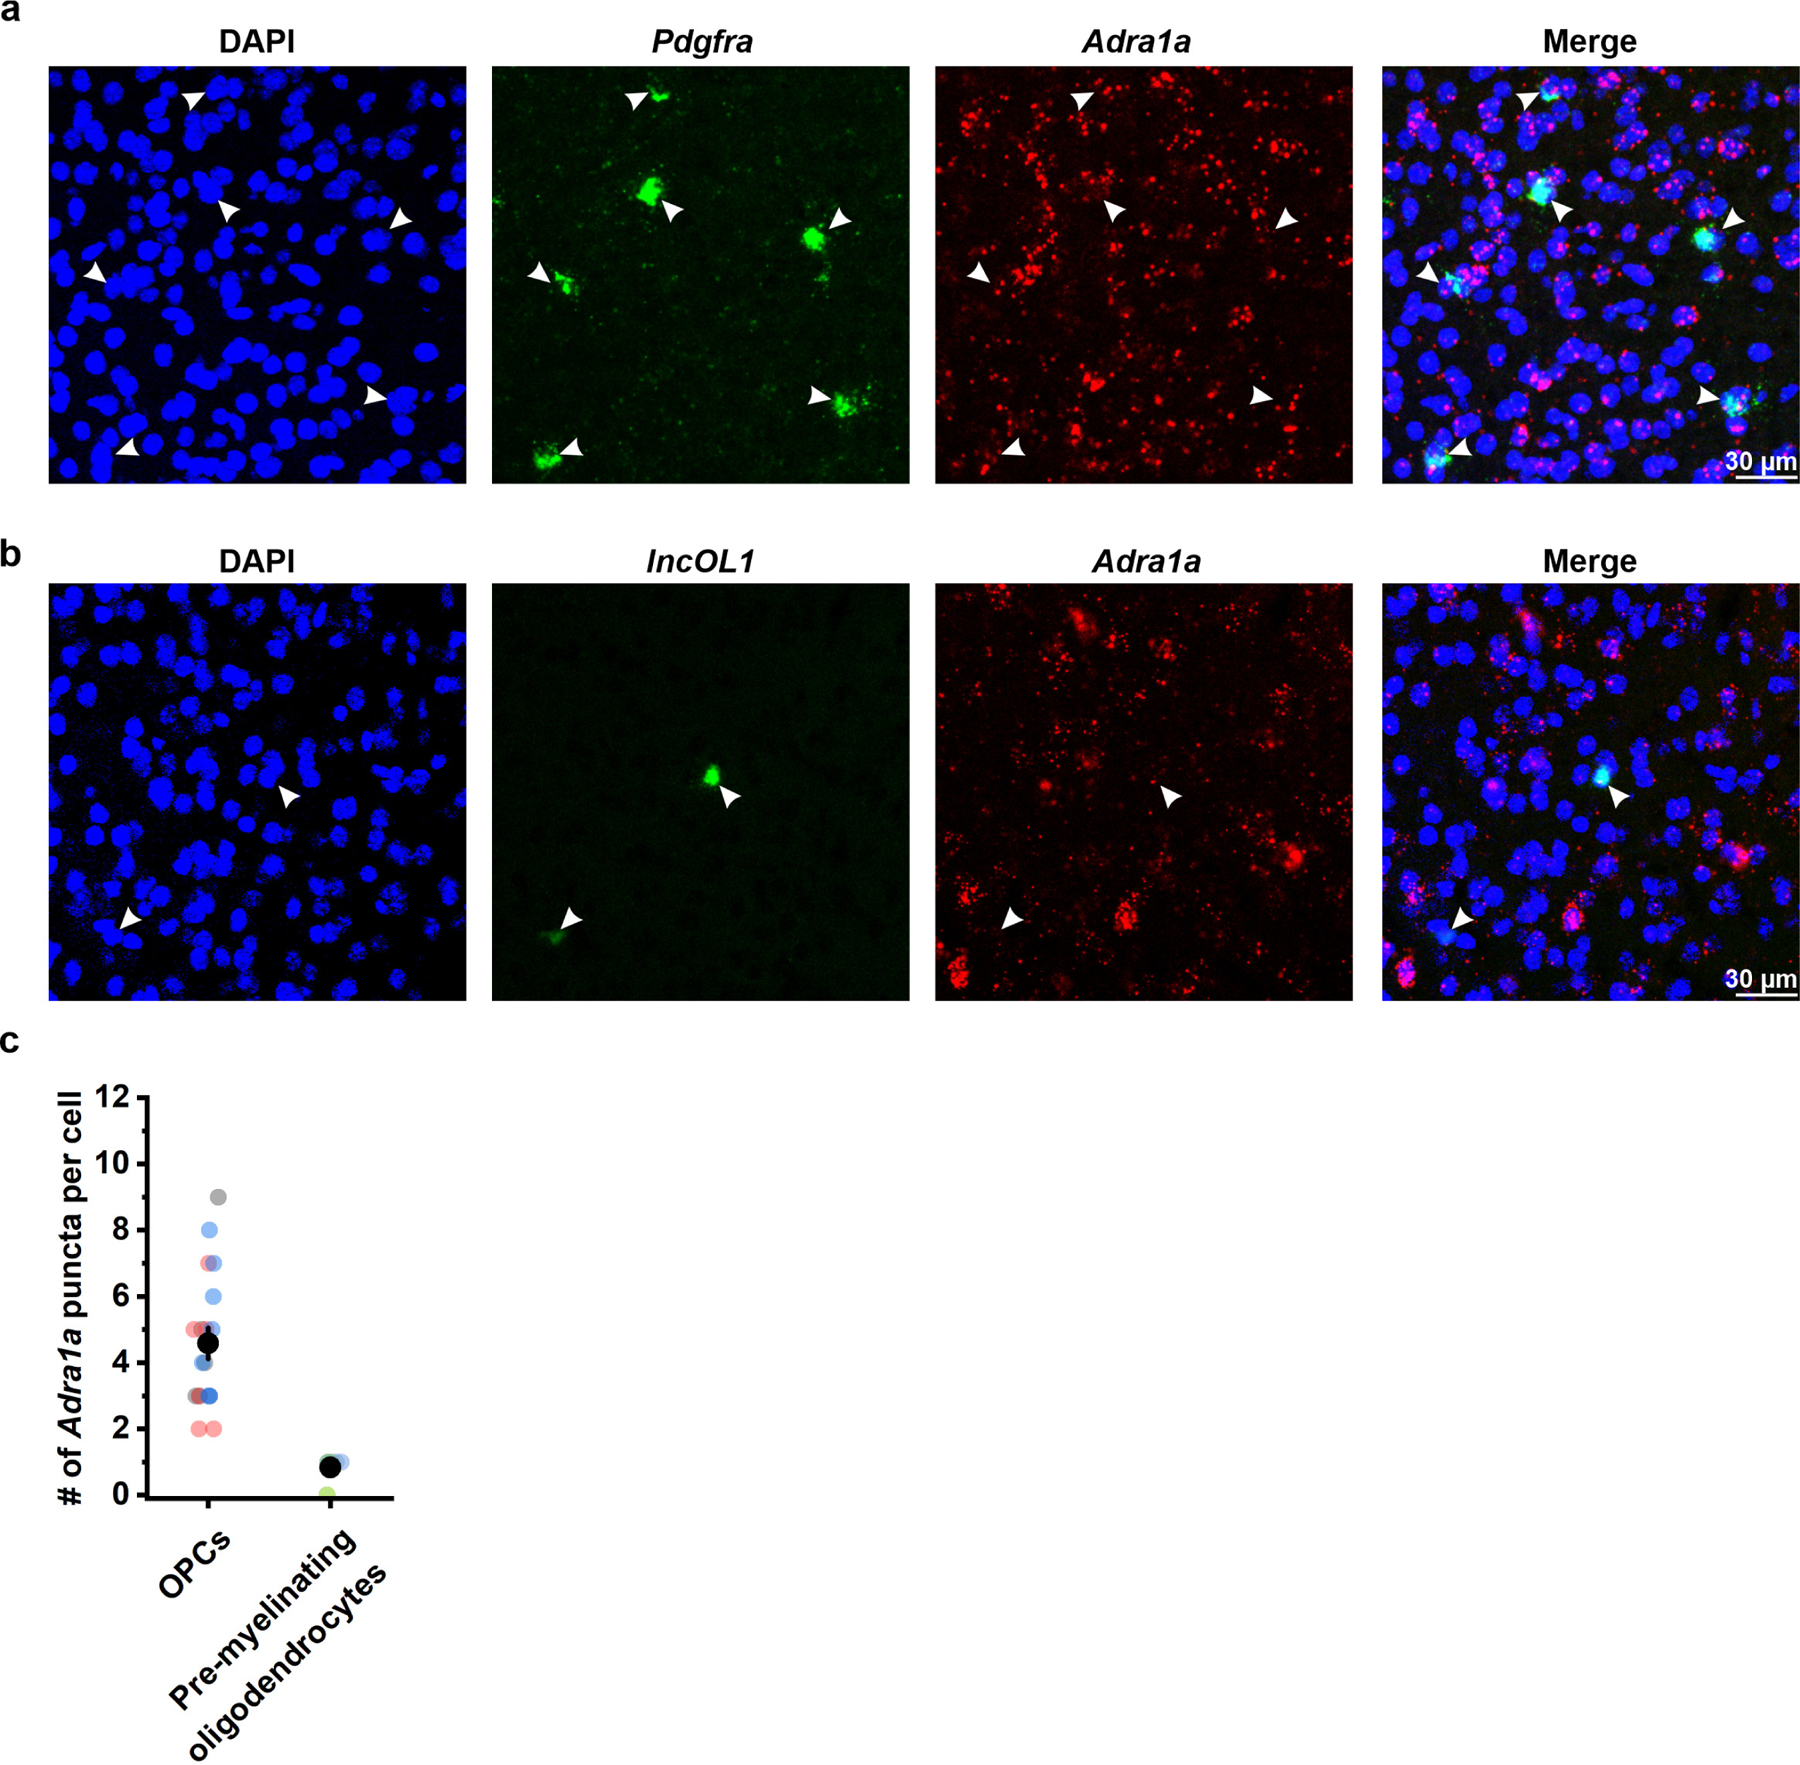
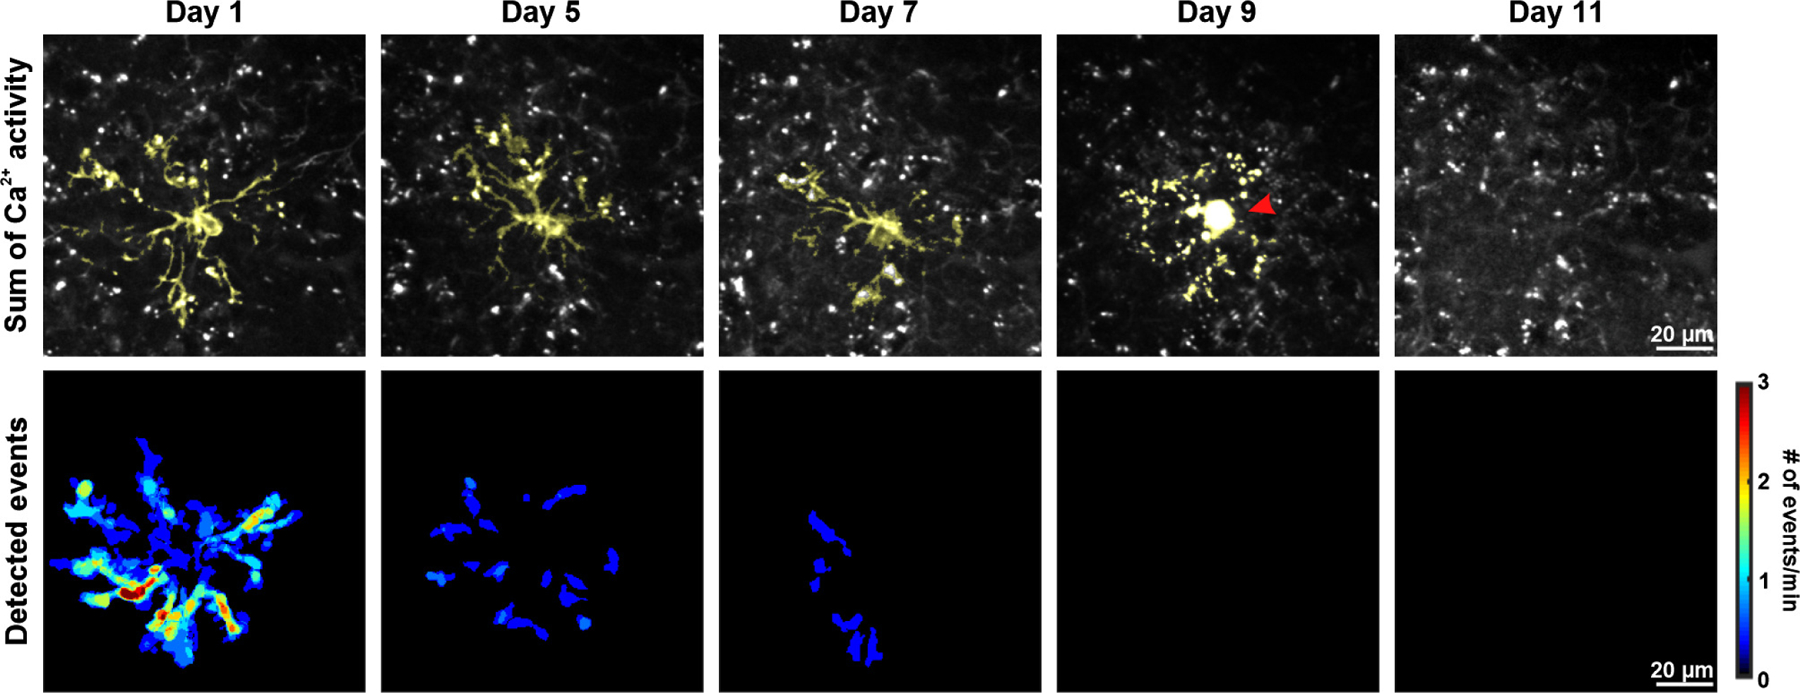
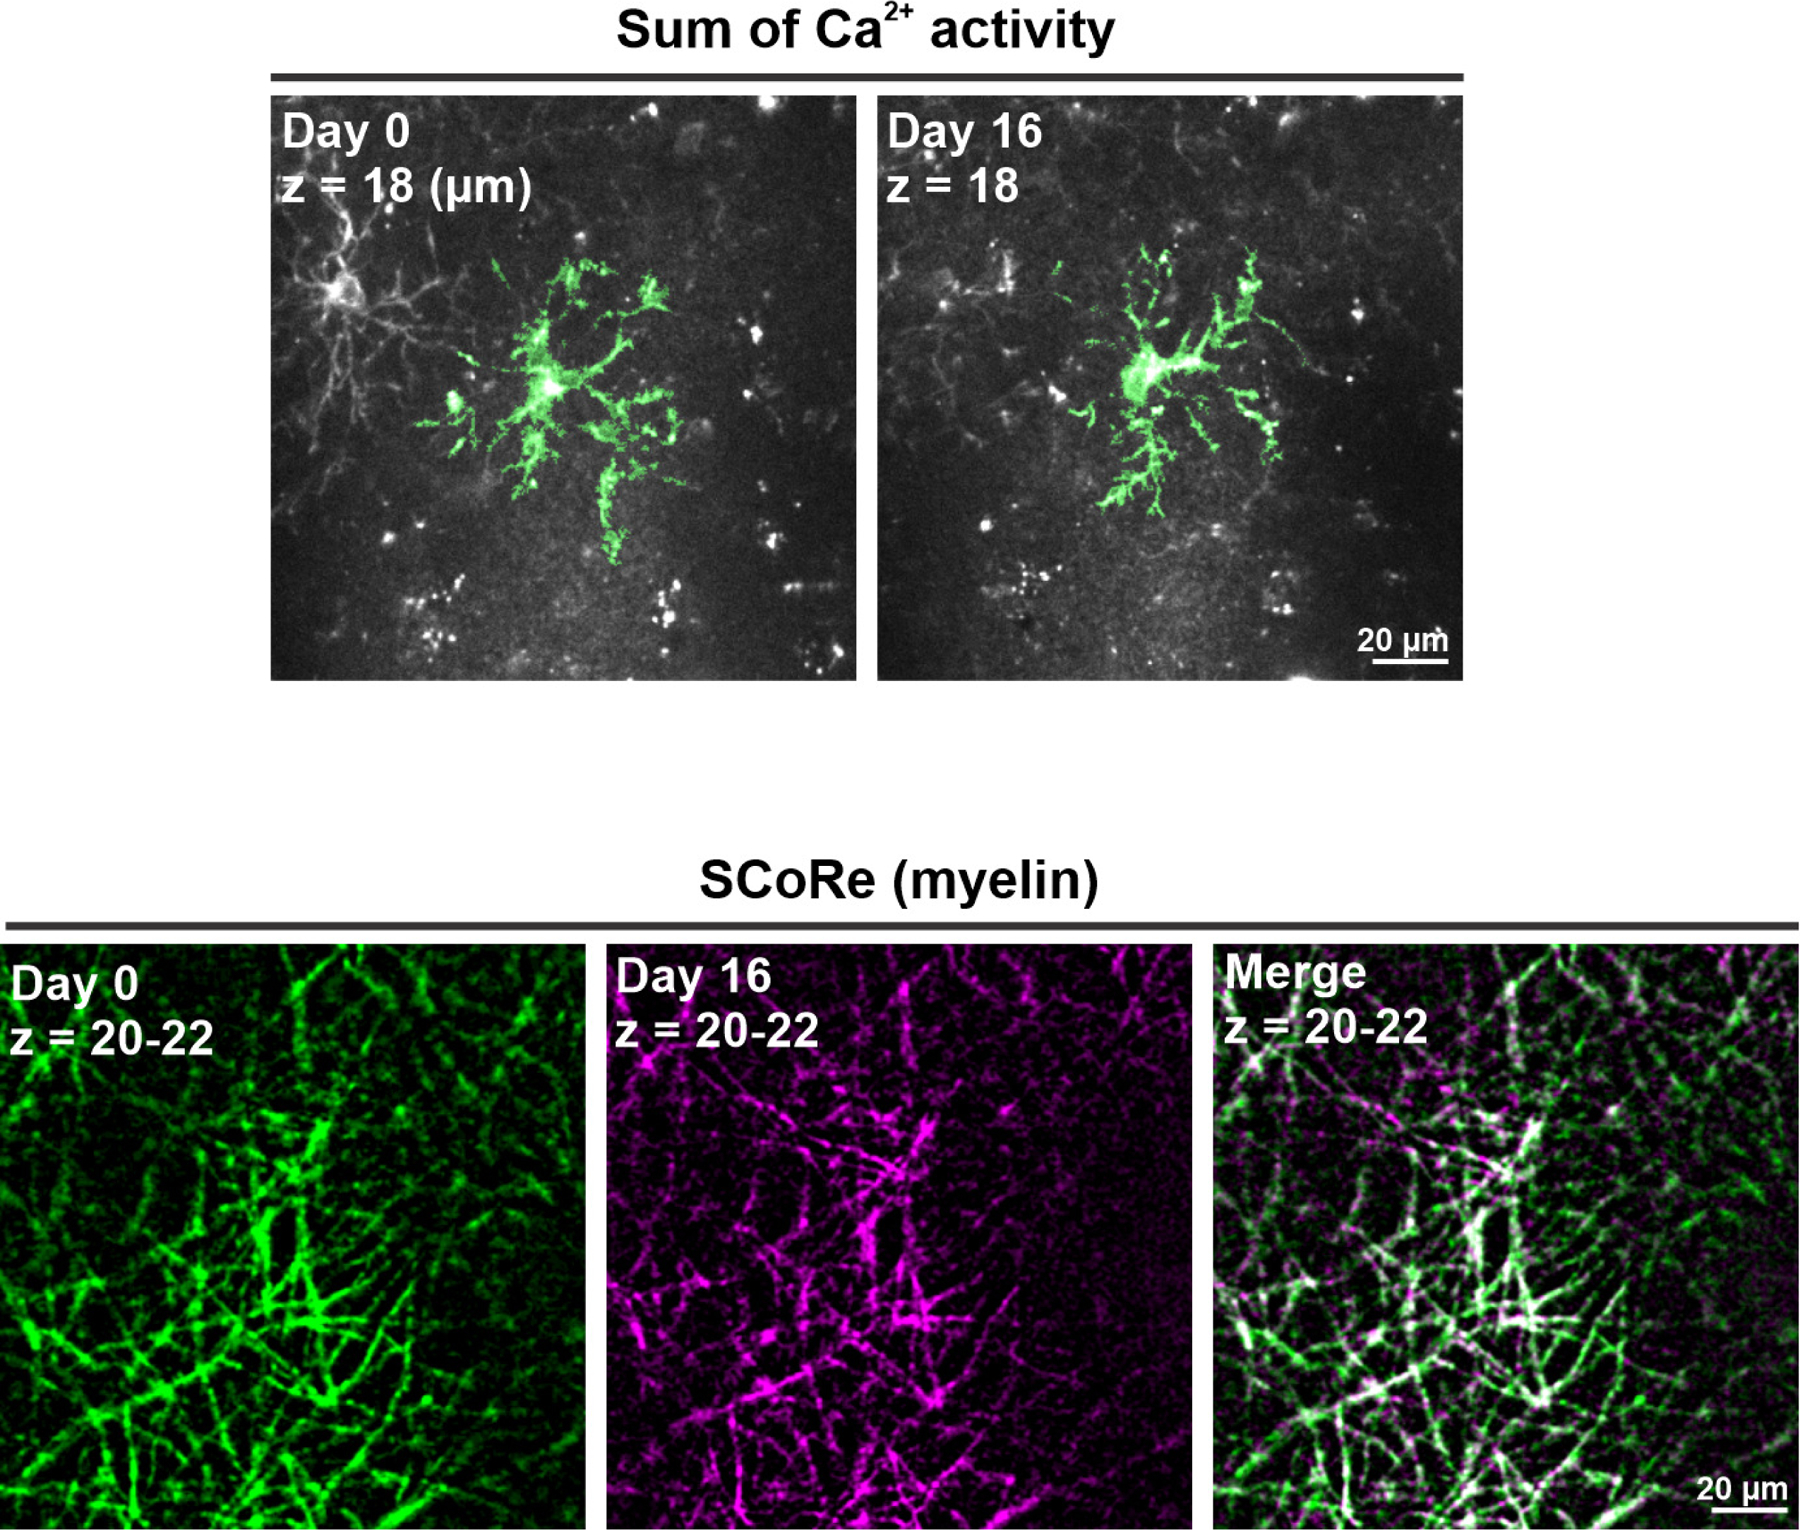
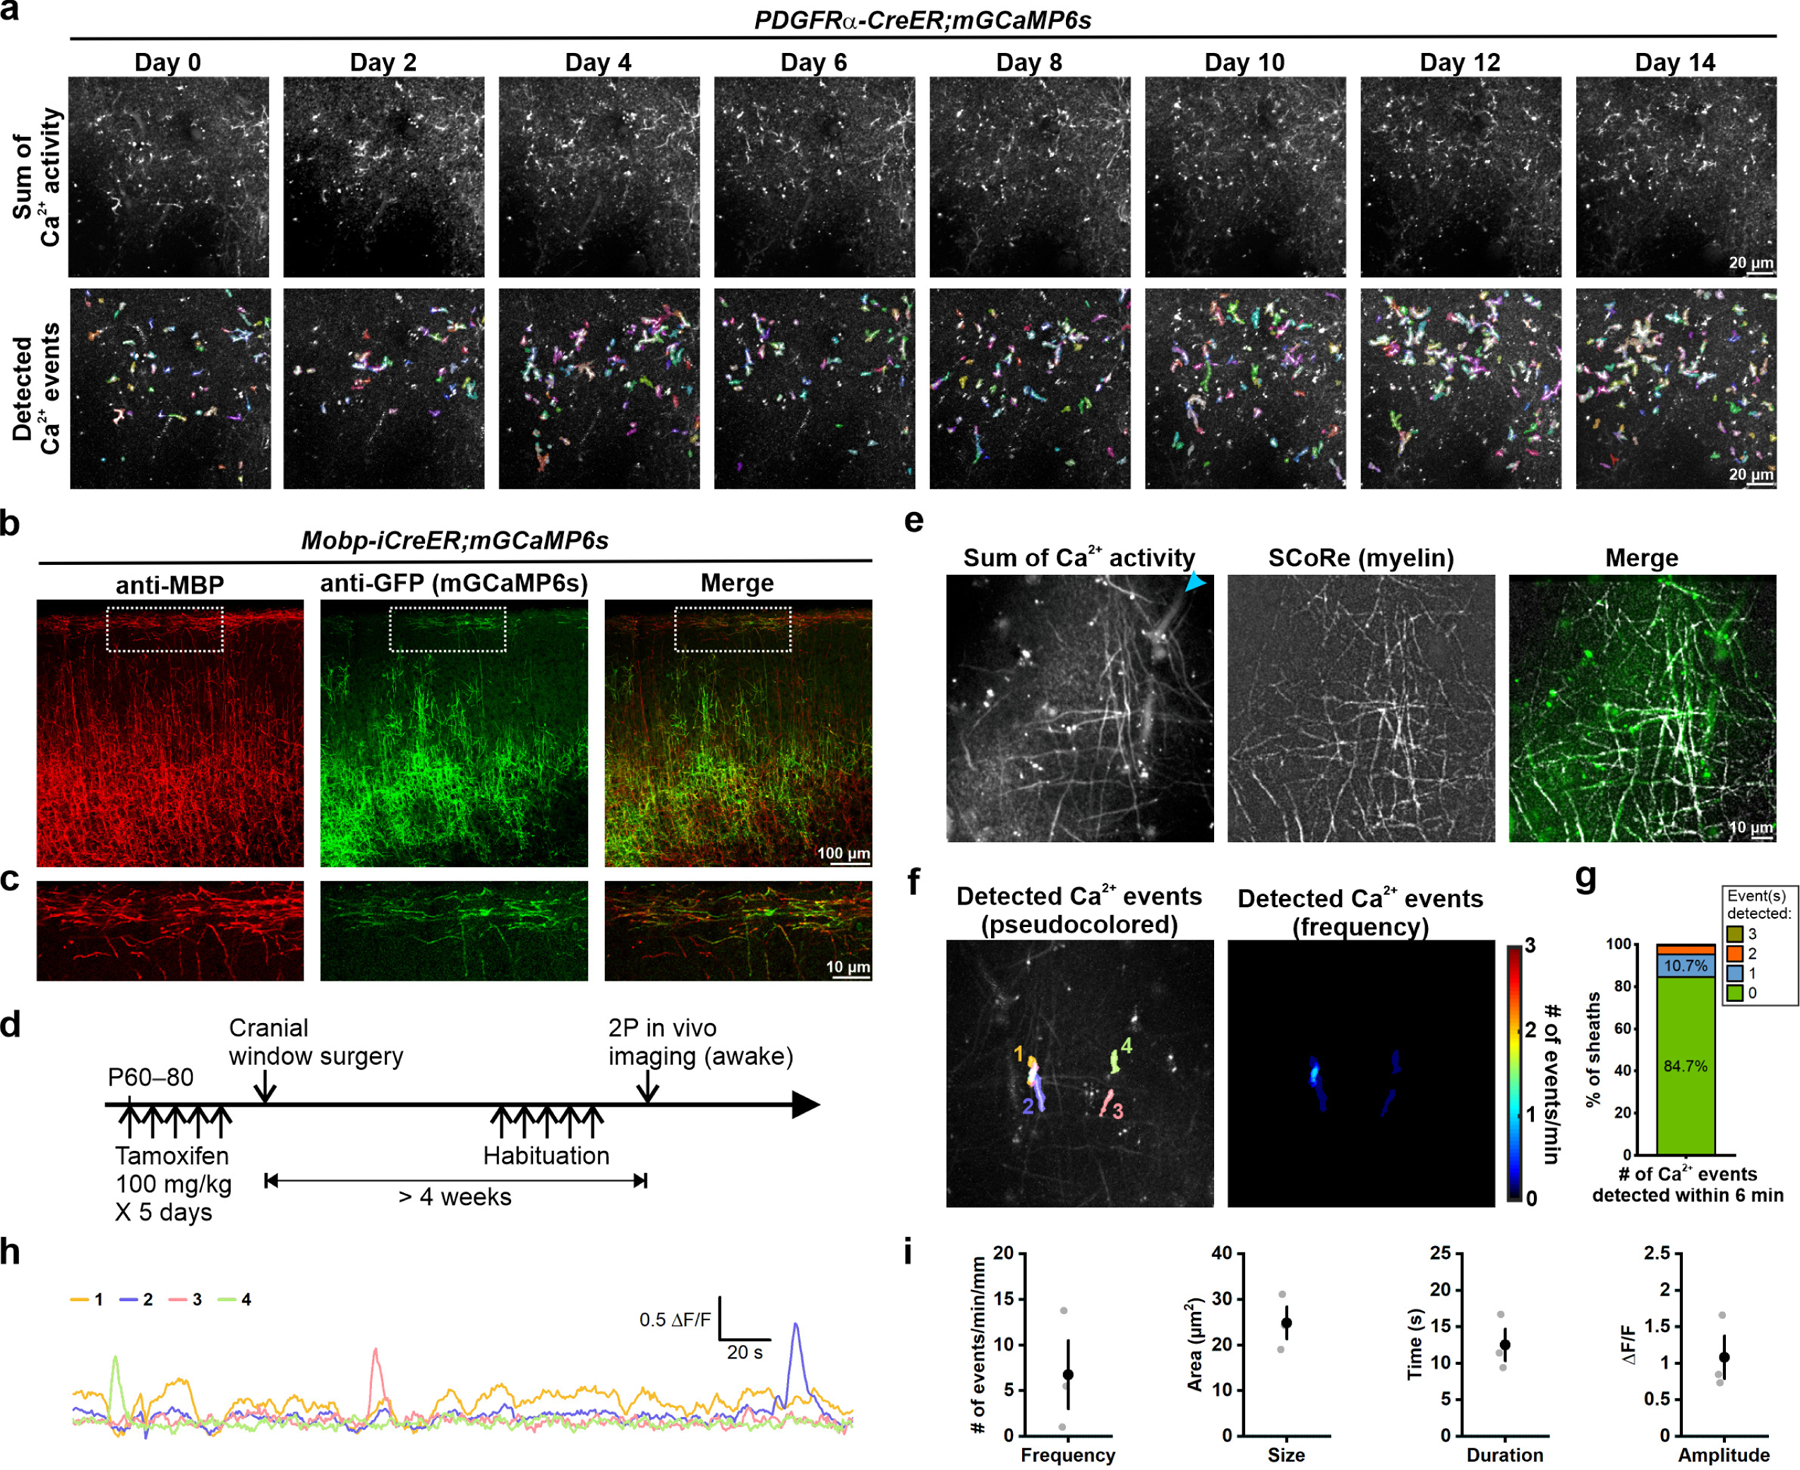
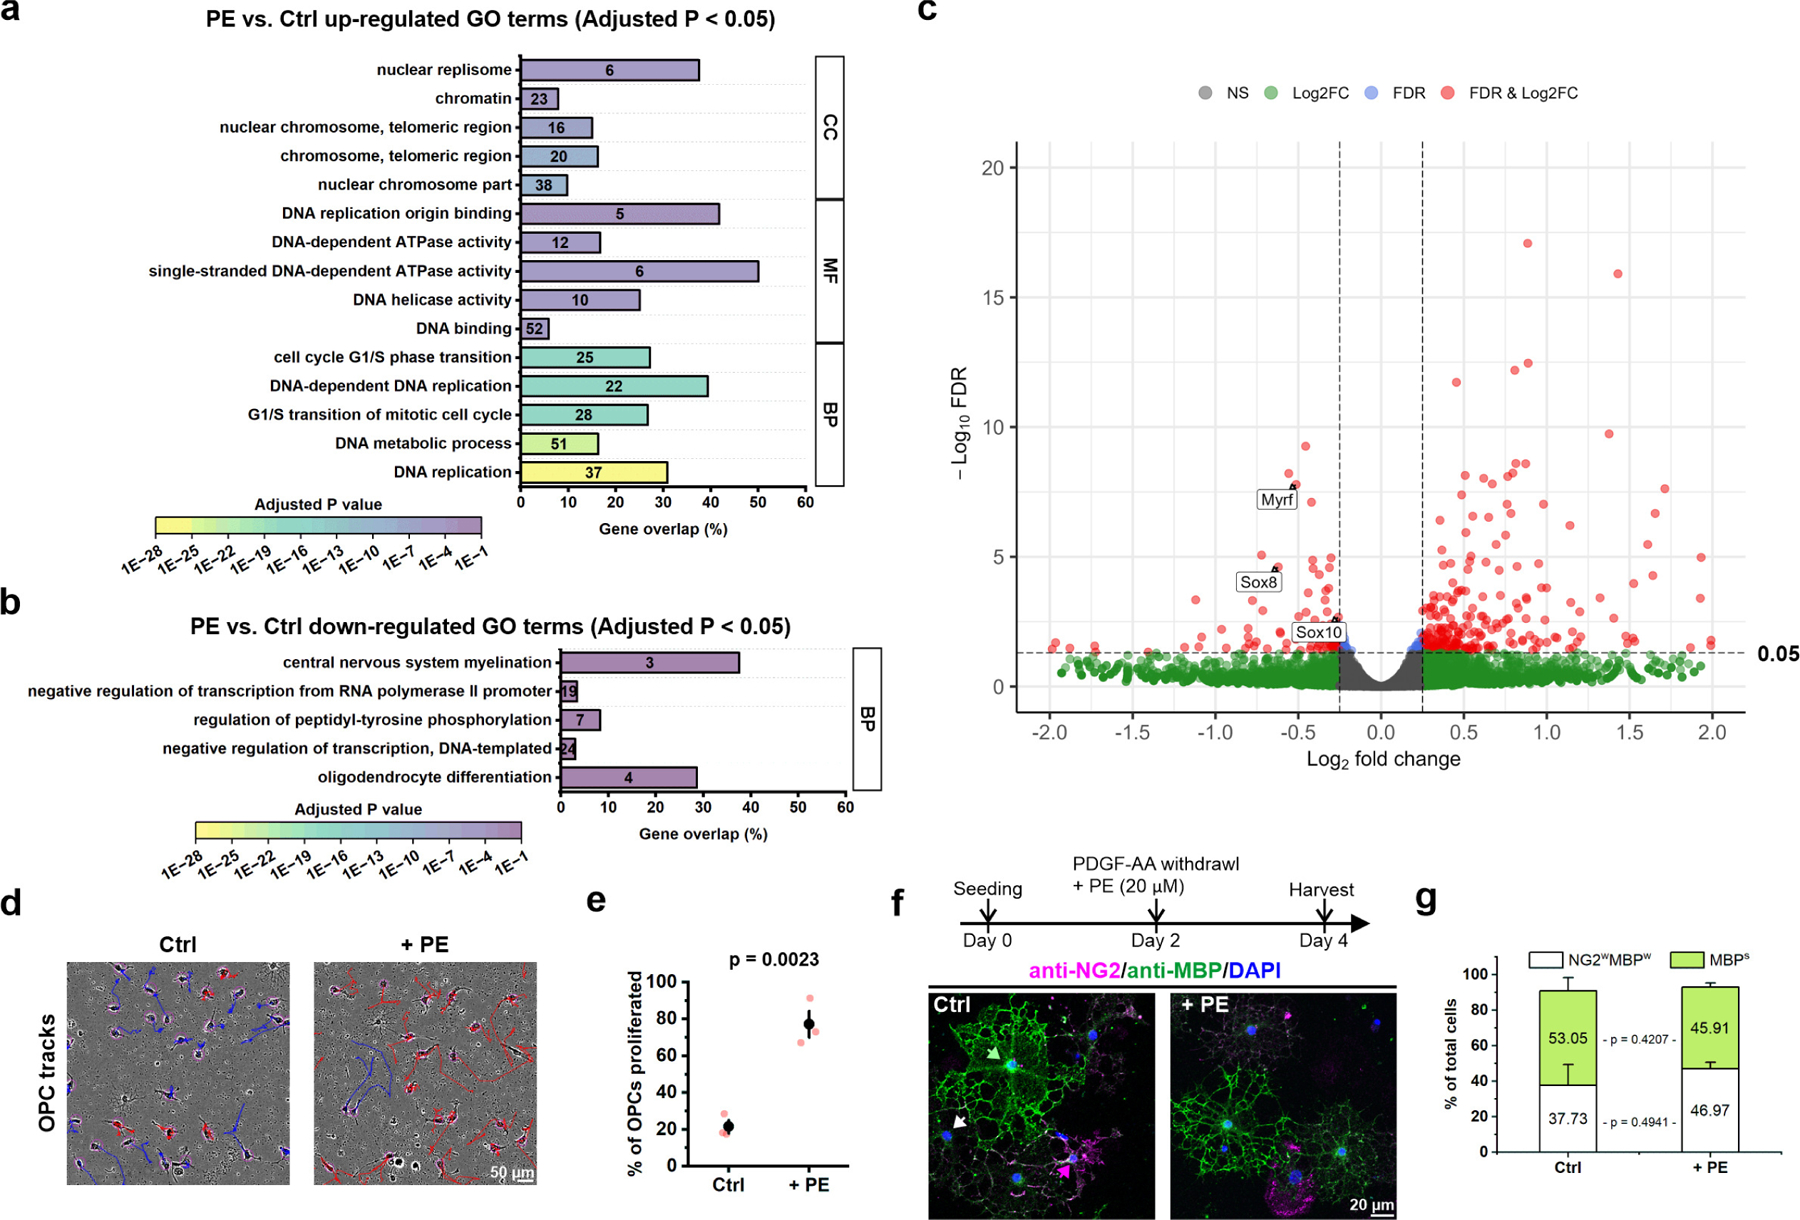
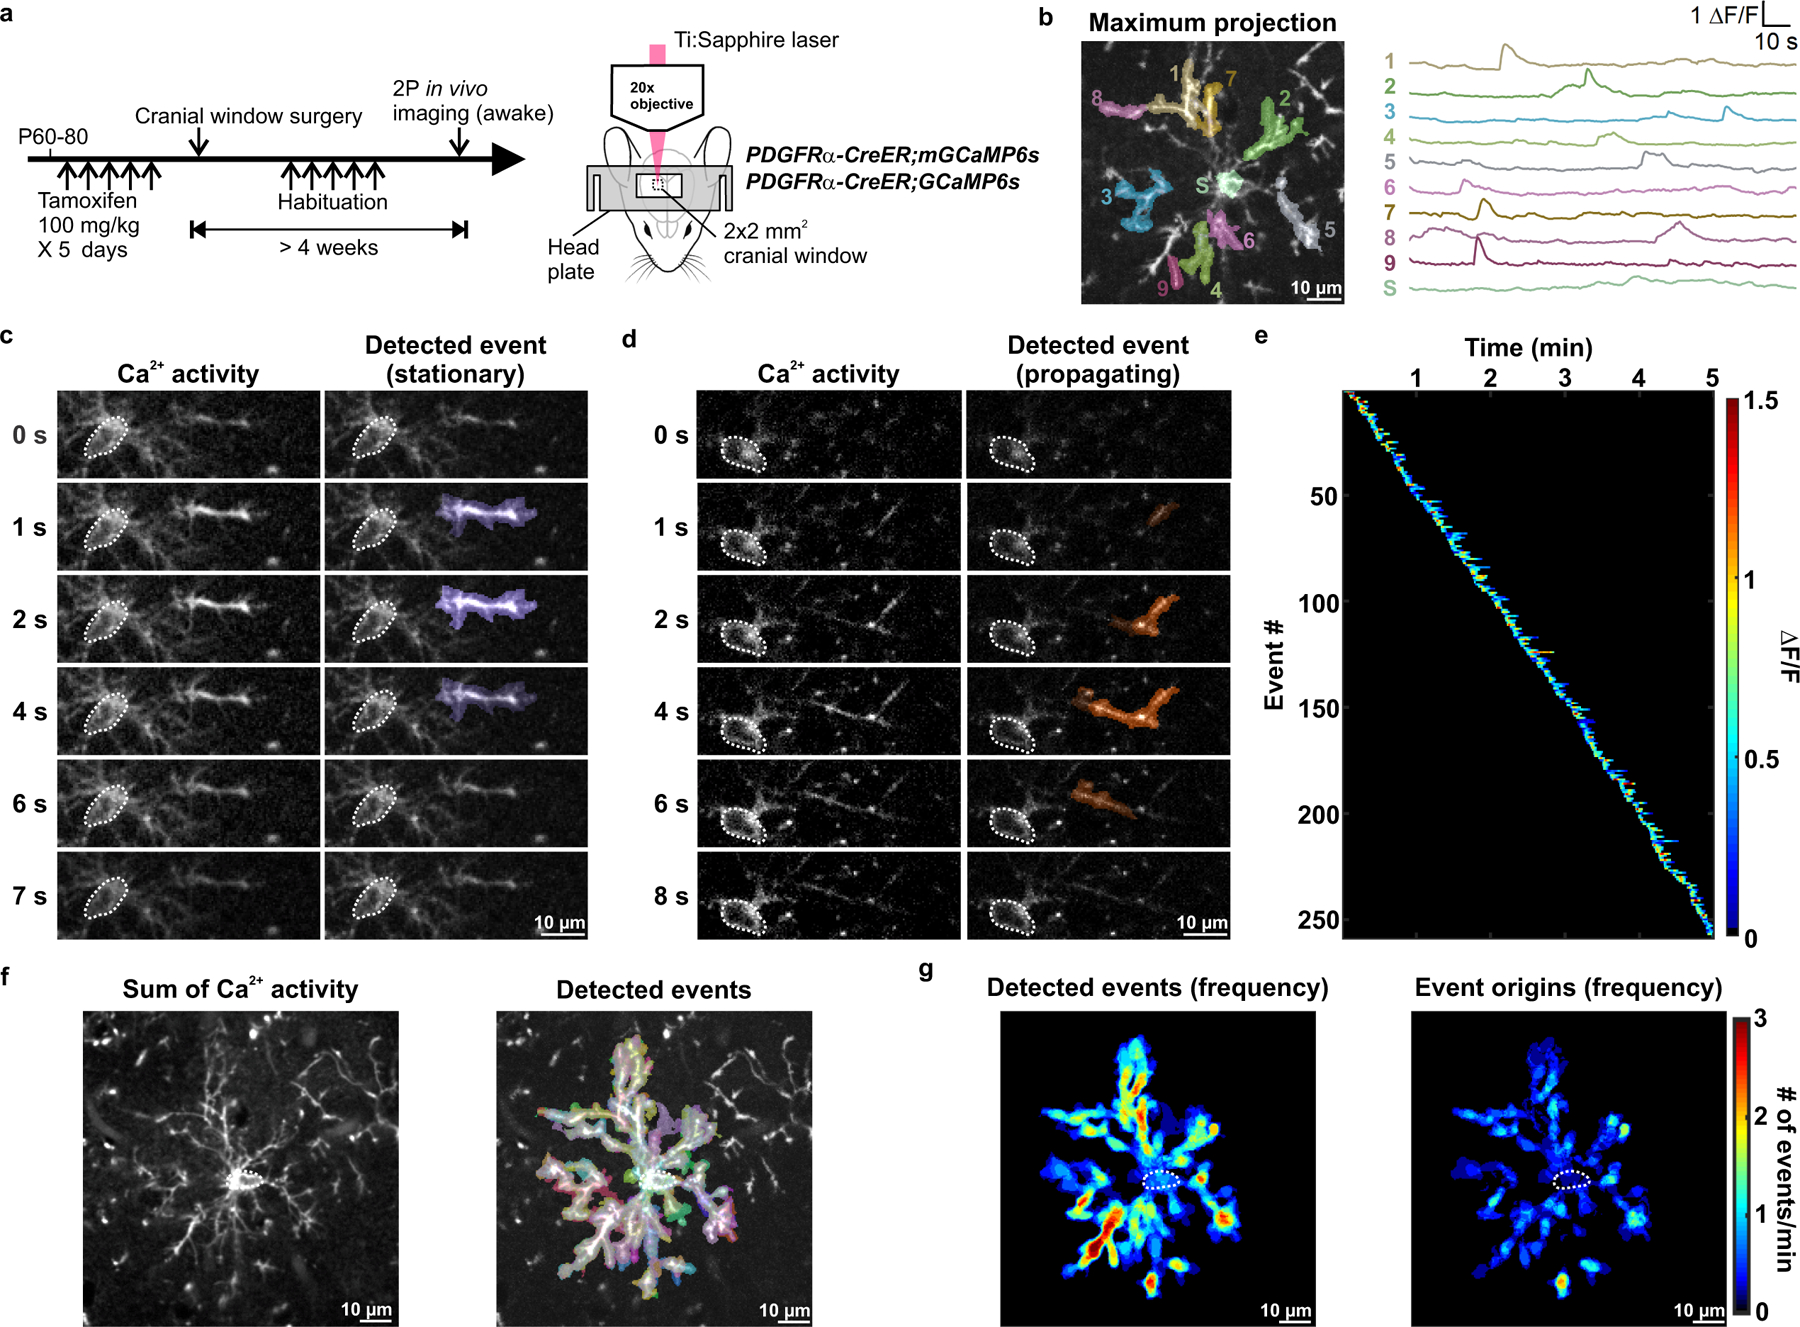
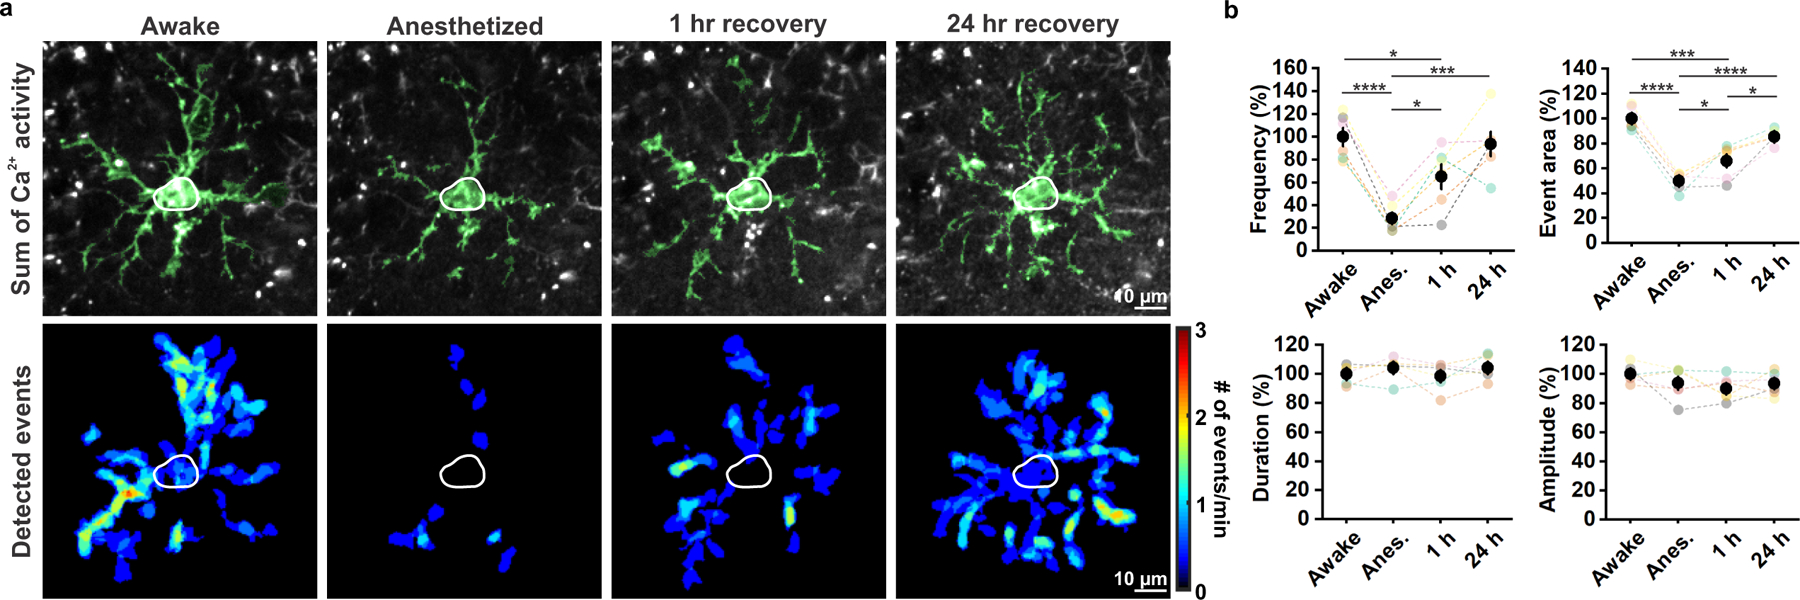
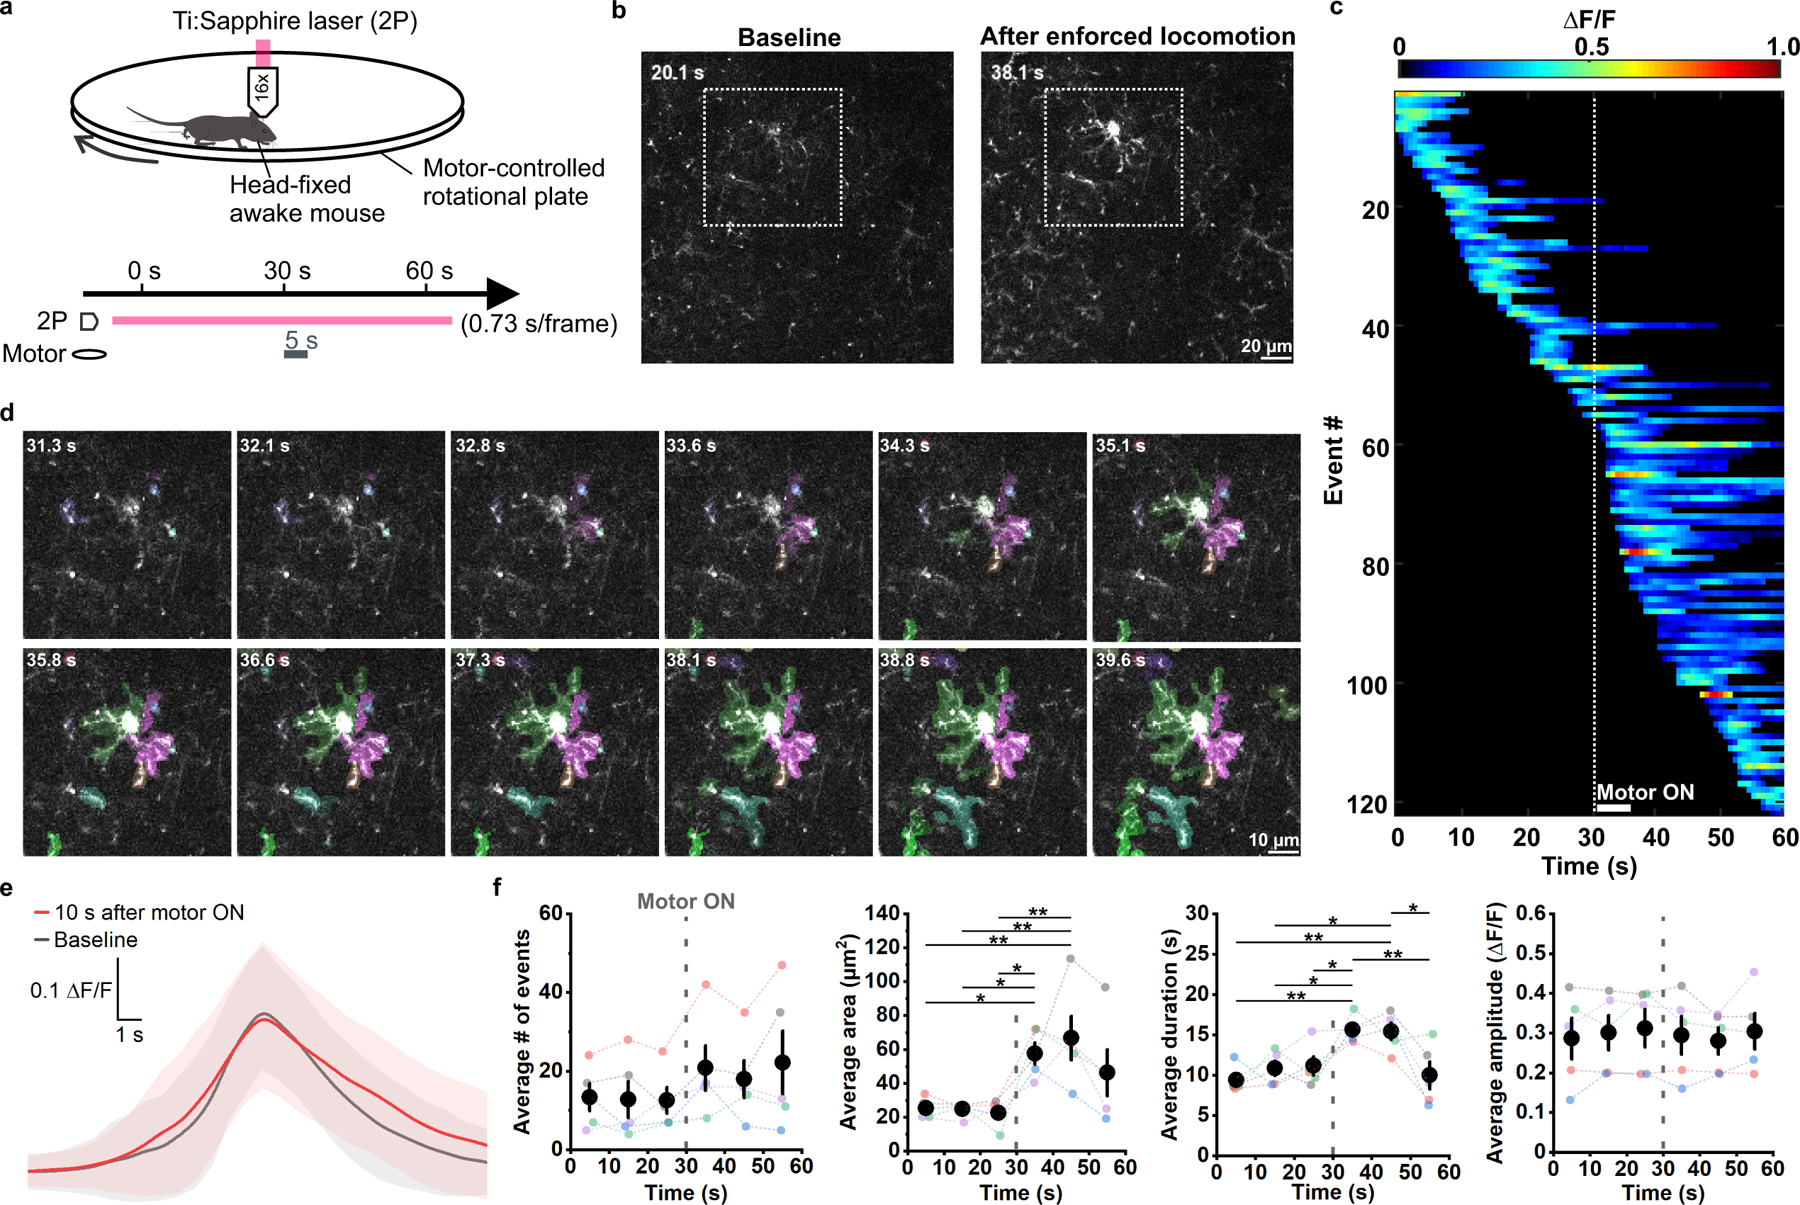
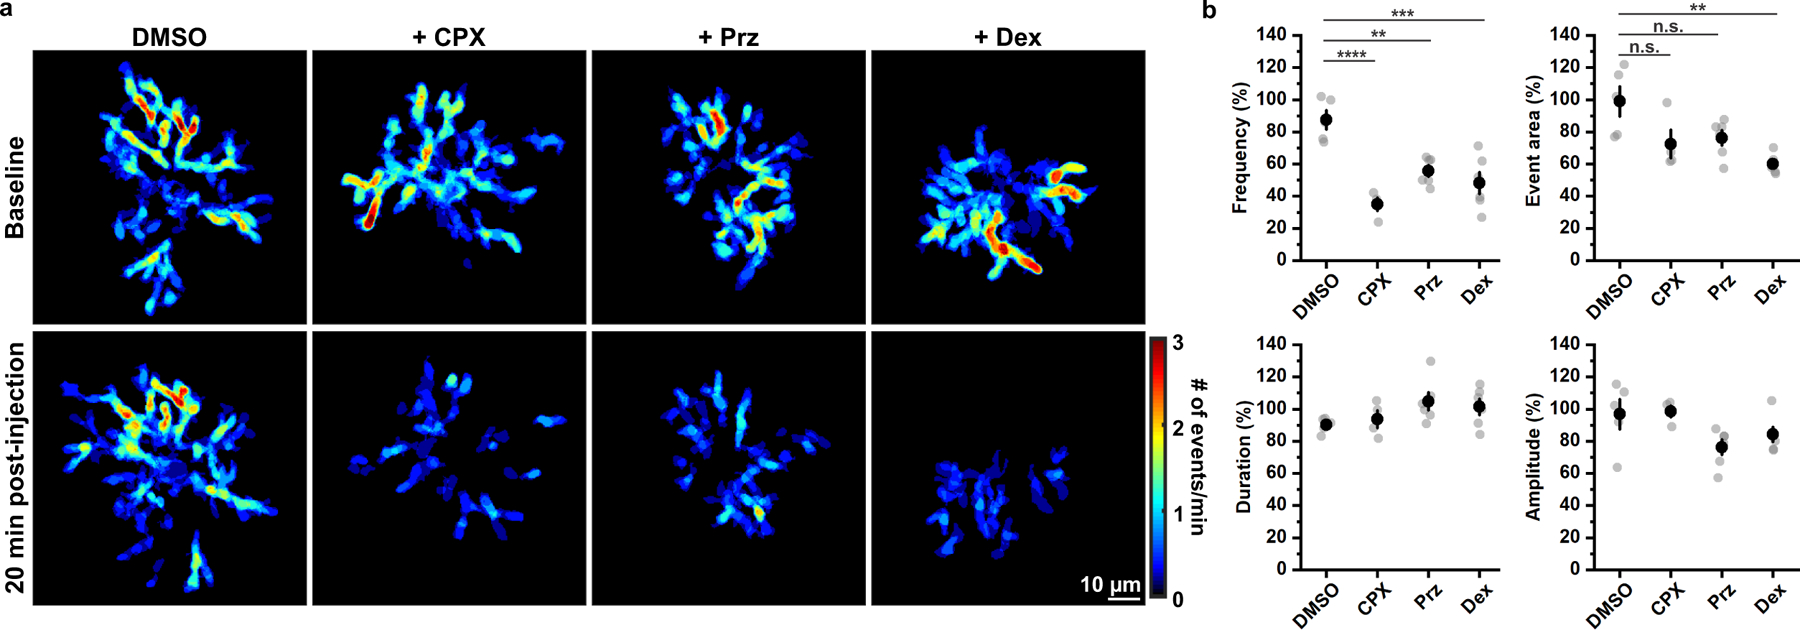
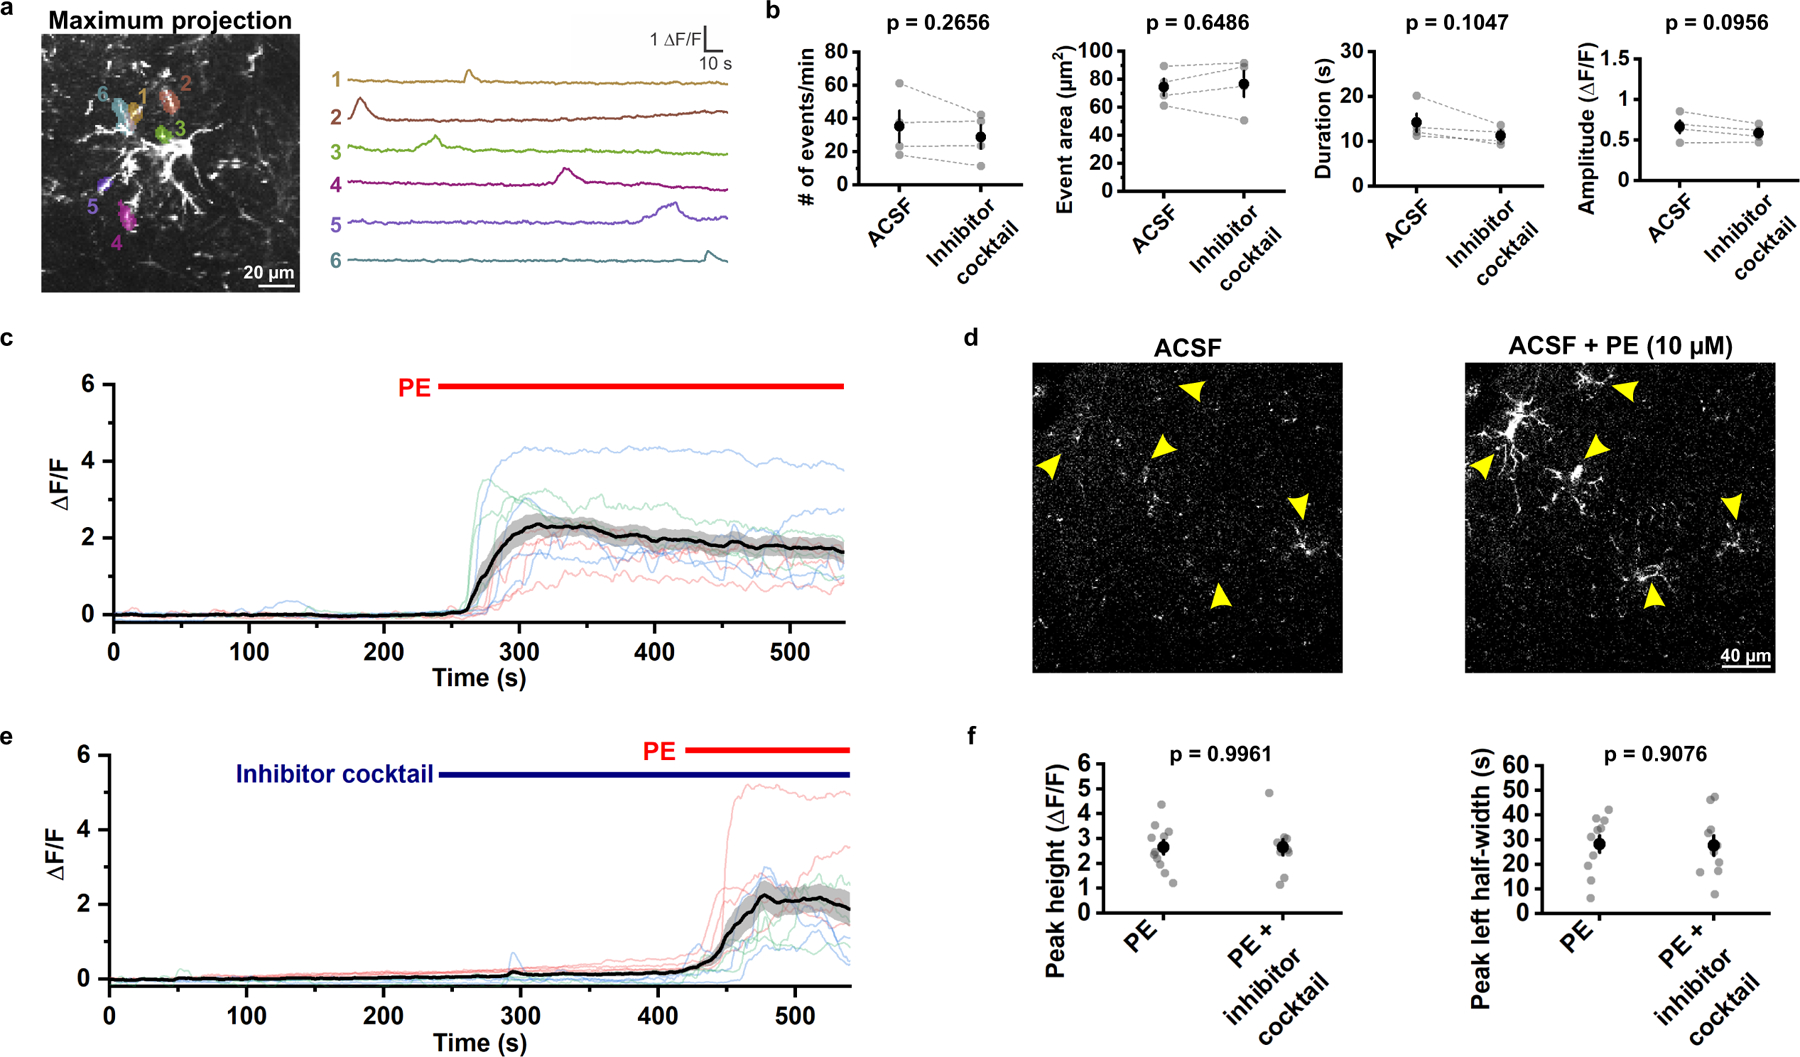
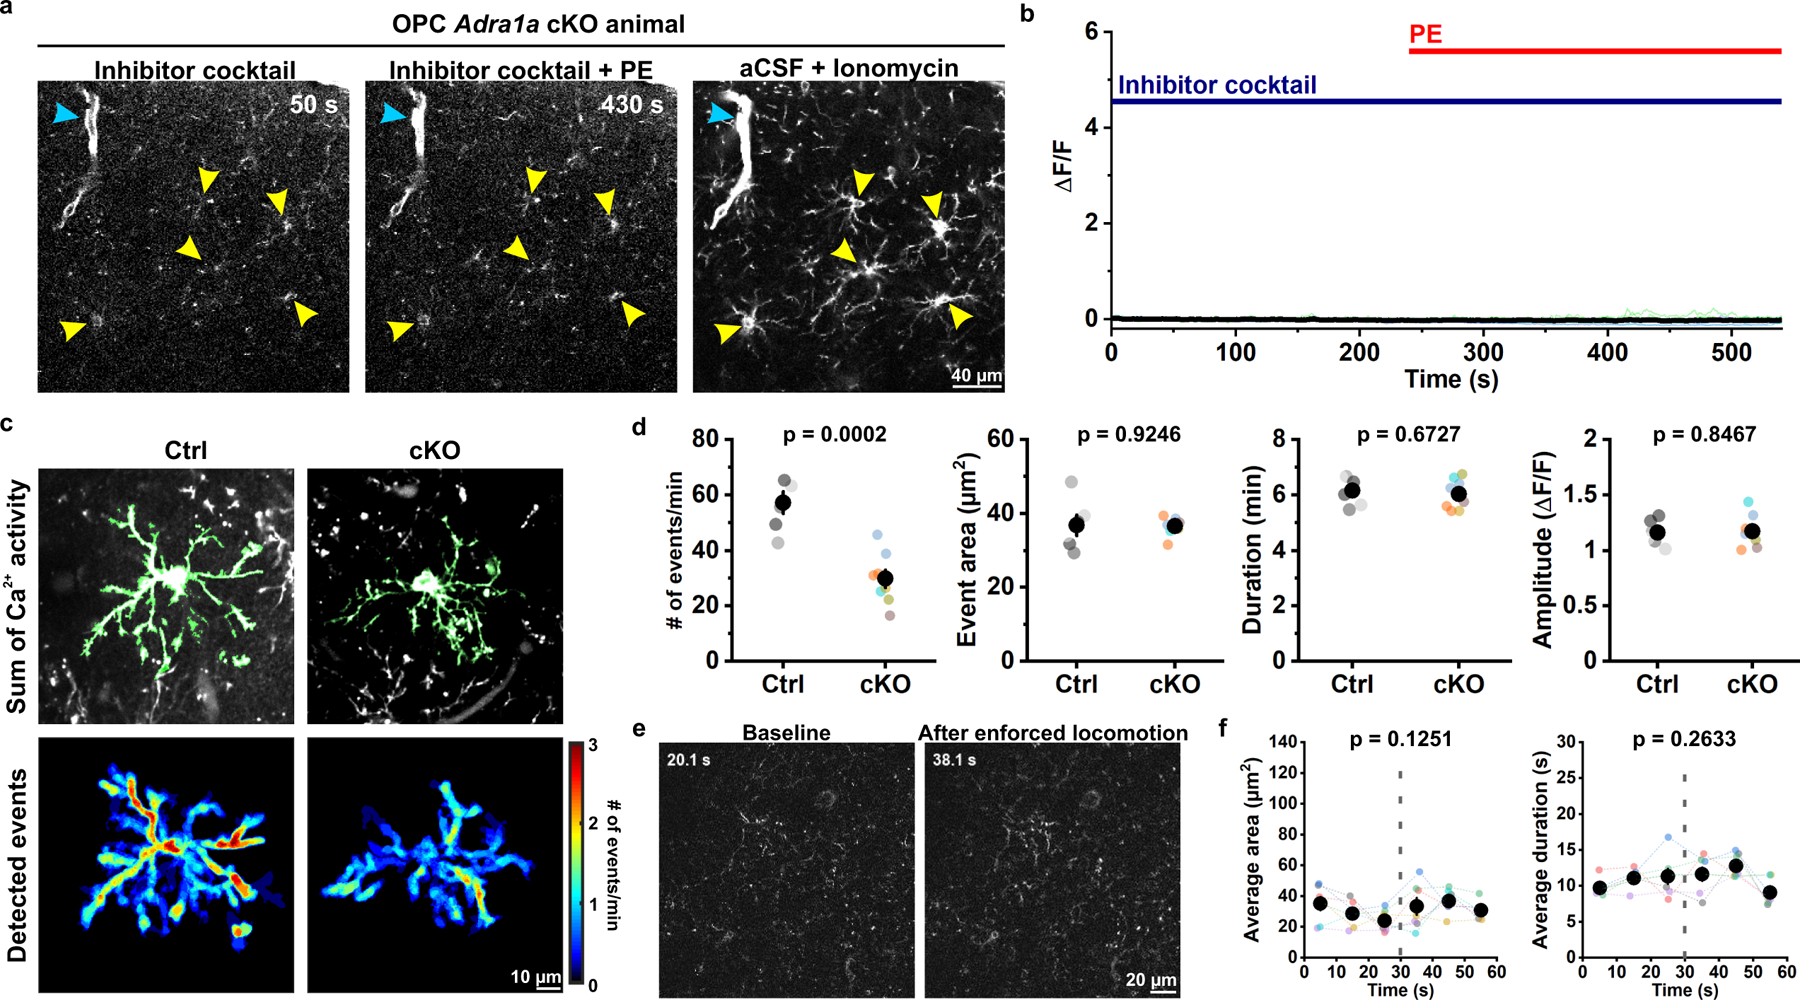
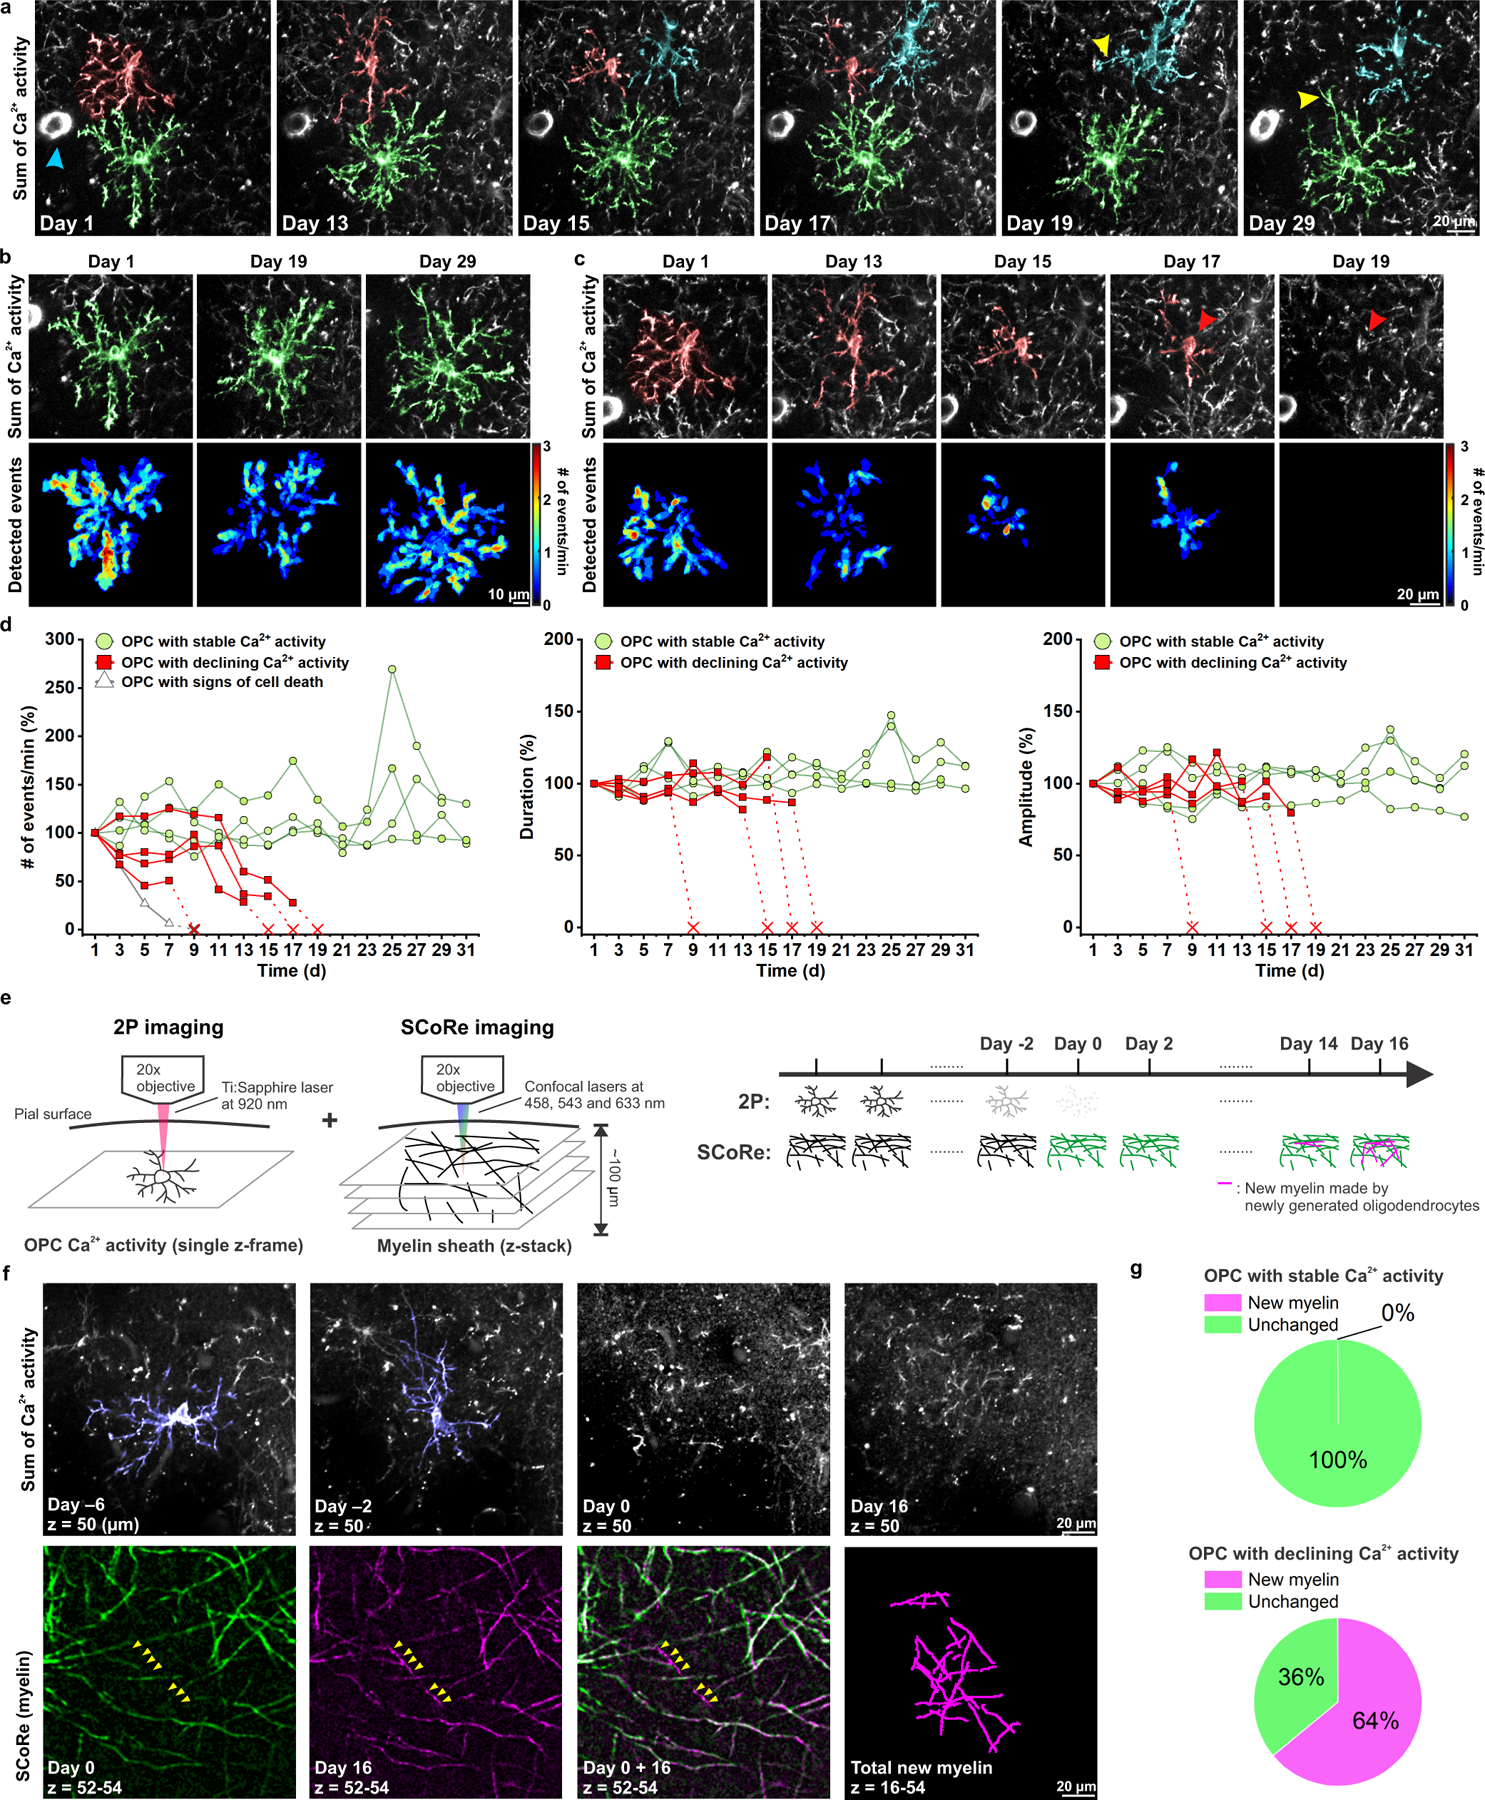
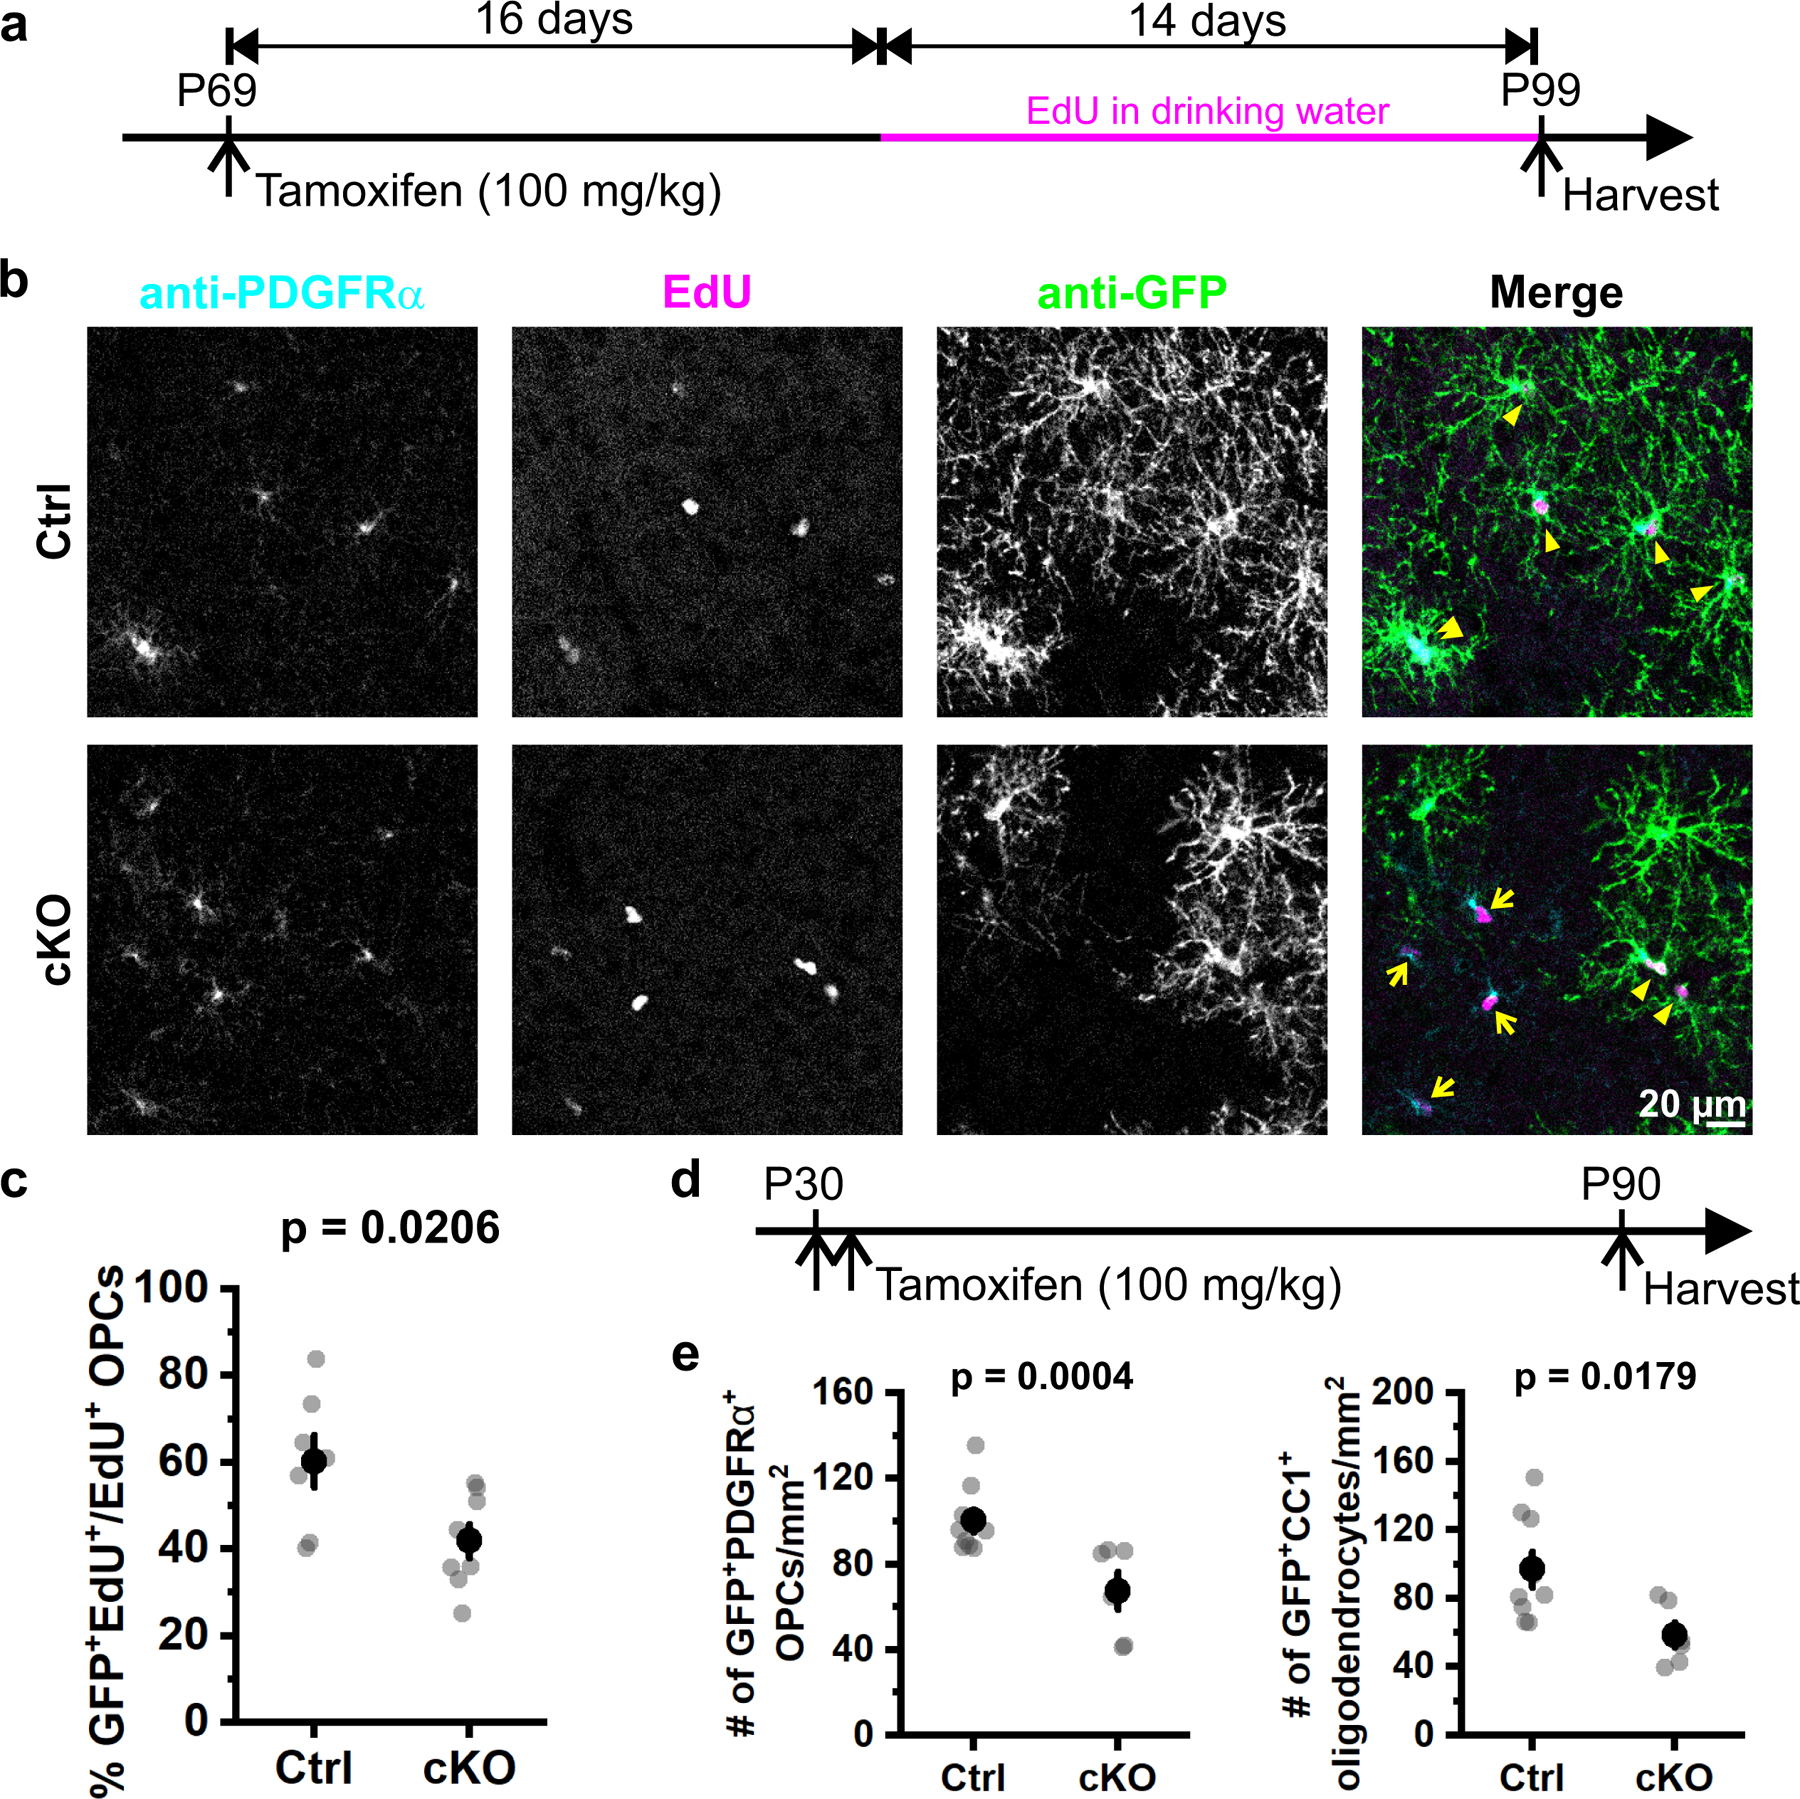
Oligodendrocytes, the myelinating cells of the central nervous system (CNS), are generated from oligodendrocyte precursor cells (OPCs) that express neurotransmitter receptors. However, the mechanisms that affect OPC activity in vivo and the physiological roles of neurotransmitter signaling in OPCs are unclear. In this study, we generated a transgenic mouse line that expresses membrane-anchored GCaMP6s in OPCs and used longitudinal two-photon microscopy to monitor OPC calcium (Ca2+) dynamics in the cerebral cortex. OPCs exhibit focal and transient Ca2+ increases within their processes that are enhanced during locomotion-induced increases in arousal. The Ca2+ transients occur independently of excitatory neuron activity, rapidly decline when OPCs differentiate and are inhibited by anesthesia, sedative agents or noradrenergic receptor antagonists. Conditional knockout of α1A adrenergic receptors in OPCs suppresses spontaneous and locomotion-induced Ca2+ increases and reduces OPC proliferation. Our results demonstrate that OPCs are directly modulated by norepinephrine in vivo to enhance Ca2+ dynamics and promote population homeostasis.


Conflict of interest statement

Competing interests

The authors declare no competing interests

Figures

Extended Data Figure 1.
Extended Data Figure 1.. Expressing membrane-anchored GCaMP6s (mGCaMP6s) in OPCs using Rosa26-lsl-mGCaMP6s knockin transgenic mice.
a, Design of Rosa26-lsl-mGCaMP6s and Rosa26-lsl-GCaMP6s knockin transgenic mice. MARCKS: N-terminal myristoylation sequence of myristoylated alanine-rich C-kinase substrate. b, Representative confocal images showing expression of mGCaMP6s (anti-GFP) in cortical OPCs (anti-NG2) 4 weeks after tamoxifen injection. c, Quantification of mGCaMP expression by OPCs (n = 3 mice). d, Representative images showing expression of cytosolic GCaMP6s in cortical OPCs 4 weeks after tamoxifen injection. e, Quantification of GCaMP6s expression by OPCs (n = 3 mice). f-g, Representative images of single mGCaMP6s- (f) and GCaMP6s-expressing (g) OPCs. Magnified views of their distal processes (yellow arrowheads) from regions highlighted by white squares shown below. Note limited cytosolic GCaMP6s expression in the processes.
Extended Data Figure 2.
Extended Data Figure 2.. Features of OPC Ca2+ events detected by mGCaMP6s and GCaMP6s.
a, Dot plots comparing the average amplitude (avg.) event frequency (events/min), active area, frequency normalized to cell area, active area (amount of cell that exhibits Ca2+ changes), amplitude, duration (the time between 50% onset time point – 50% offset time point), rise time (onset duration from 10% to 90% of the peak amplitude) and decay time (offset duration from 90% to 10%) between mGCaMP6s- and GCaMp6s-expressing OPCs. Each data dot represents one OPC. n = 6 OPCs from 6 mice. Black filled circles and error bars represent mean ± SEM throughout. For data that passed the Shapiro-Wilk normality test at the 0.05 level, Student’s t-test was performed. For data that did not pass the Shapiro-Wilk normality test at the 0.05 level, including avg. event area and avg. rise time, Mann-Whitney test was performed.b, Quantification of event origins from mGCaMP6s- and GCaMP6s-expressing OPCs (n = 6 OPCs from 6 mice). Student’s t-test.
Extended Data Figure 3.
Extended Data Figure 3.. Propagation of OPC Ca2+ transients is independent of site of event origin, event amplitude, and somatic Ca2+ activity.
a, Average percentage of stationary (having an overall propagation score < 10 μm) and propagating (having an overall propagation score ≥ 10 μm) OPC Ca2+ events (n = 6 OPCs from 6 mice). Student’s t-test. b, Plot of the distance between event origin and soma (Origin from soma) versus overall propagation score. R: Pearson’s r. n = 1,100 propagating events from 6 mice. c, Plot of event amplitude against event overall propagation score. R: Pearson’s r. n = 1,100 propagating events from 6 mice. d, Directions of event propagation 10 s before and after the onset of a soma event. Event travelling direction was determined by total voxels that traveled away from soma minus total voxels that traveled toward soma. n = 911 propagating events from 6 mice. e, ΔF/F traces of Ca2+ events (thin gray lines) that peaked 10 s before and after soma event onset in mGCaMP6s-expressing and GCaMp6s-expressing OPCs, respectively. Mean ΔF/F (solid blue and brown lines) is the average ΔF/F of 165 events in mGCaMP6s-expressing mice (6 cells from 6 mice), and 509 events in GCaMP6s-expressing mice (6 cells from 6 mice). Shuffled mean (dotted purple lines) is the average value after shuffling ΔF/F values of each event. Shaded areas indicate standard deviation.
Extended Data Figure 4.
Extended Data Figure 4.. Activation of visual cortex by visual stimulation with light does not alter OPC Ca2+ events in vivo.
a, Schematic illustration of the experiment setup. A customized 3D-printed objective shield was used to prevent LED light from entering the objective. The bottom part of the objective shield is not depicted in the illustration to display the cranial window. See Methods for details. b, Schematic illustration of the experiment design. Baseline OPC Ca2+ activity was recorded for 60 seconds (s) followed by 3, 0.1 s LED stimulations at 30 s intervals. An infrared (IR) camera used to observe mouse behavior during image acquisition. c, Representative heatmaps showing the ΔF/F value and duration of OPC Ca2+ events sorted according to the time of event onset. OPC Ca2+ events that occurred during 10 s of quiescence or 10 s after LED stimulation were overlaid onto a single frame (Maximum projection), respectively. d, Averaging the OPC Ca2+ activity during 20 s of quiescence (gray) and around LED stimulation (blue) suggests that LED stimulation does not influence OPC Ca2+ activity in vivo. Shaded areas represent standard deviation. n = 4 mice. e, Quantification of OPC Ca2+ event frequency, area, duration and amplitude during 10 s of quiescence and 10 s post LED stimulation. n = 8 randomly-selected quiescent periods and 10 LED trials in 4 mice (color-coded).
Extended Data Figure 5.
Extended Data Figure 5.. Exposure to carrier (DMSO) does not significantly alter OPC Ca2+ activity.
Quantification of OPC Ca2+ event frequency (# of events/min), area, duration and amplitude before (Baseline) and 20 minutes after DMSO injection (DMSO). n = 5 OPCs from 5 mice each. Paired sample Student’s t-test.
Extended Data Figure 6.
Extended Data Figure 6.. α1A adrenergic receptors mRNA is enriched in cortical OPCs relative to pre-myelinating oligodendrocytes.
a, Representative images from a cortical brain slice of visual cortex from an adult mouse hybridized with probes recognizing Pdgfra (green) and Adra1a (red) mRNA. DAPI (blue) was used to identify cell nuclei. Adra1a mRNA is found around Pdgfra+ nuclei, suggesting that cortical OPCs express ADRA1A (n = 19 cells, 3 mice). b, Representative images from a cortical brain slice of visual cortex from an adult mouse hybridized with probes recognizing lncOL1 (green), and Adra1a (red) mRNA. DAPI was used to identify cell nuclei (n = 6 cells, 2 mice). c, Quantification of Adra1a mRNA puncta in OPCs and premyelinating oligodendrocytes.
Extended Data Figure 7.
Extended Data Figure 7.. Illustration of an mGCaMP6s-expressing OPC undergoing cell death.
The mGCaMP6s-expressing OPC is highlighted in yellow. Note the round-shape and intensely fluorescent soma (red arrowhead), as well as fragmented processes on Day 9. Ca2+ events were not visible in fragmented processes.
Extended Data Figure 8.
Extended Data Figure 8.. Illustration that local myelin profiles did not change around stable OPCs.
An mGCaMP6s-expressing OPC (highlighted in green) was followed for 16 days and the local myelin profile was recorded by SCoRE microscopy concurrently. The local myelin profile remained unchanged from Day 0 (green) to Day 16 (magenta).
Extended Data Figure 9.
Extended Data Figure 9.. Myelinating oligodendrocytes exhibit infrequent Ca2+ events in only a select few myelin sheaths.
a, Local calcium events detected (randomly pseudocolored by AQuA) in the same imaging plane where the traced OPC (Figure 7f, highlighted in blue) became undetectable on Day 0. We did not observe persistent or enhanced Ca2+ events that can be attributed to the pre-myelinating OPC during this stage of maturation. b, Representative confocal images showing the expression of mGCaMP6s (anti-GFP) in the cortical myelinating oligodendrocytes (anti-MBP) using oligodendrocyte-specific and tamoxifen-inducible Cre transgenic line, Mobp-iCreER. c, The magnified views of the dotted squares in b. d, Schematic illustrations of the research design. The expression of mGCaMP6s in myelinating oligodendrocytes was induced between P60–80. Oligodendrocyte Ca2+ activity in the visual cortex of head-fixed, awake mice was observed and recorded using the same condition as the recording of OPC Ca2+ activity (see Fig. 1). e, Representative images showing the Ca2+ activity detected using 2P microscopy (Sum of Ca2+ activity from a 6-minute recording) corresponds to local myelin sheath detected using SCoRe. Blue arrowhead indicates auto-fluorescent vascular structures. f, Ca2+ events detected in e during a total 6-minute recording. g, Distribution of the number of Ca2+ events detected in myelin sheaths within 6 minutes (n = total 215 sheaths from 3 mice). Note that about 85% of the myelin sheath did not generate any Ca2+ event during the recording. h, Example ΔF/F traces of oligodendrocyte membrane Ca2+ events in f. i, Quantification of average Ca2+ event frequency, size, duration and amplitude (n = 3 mice).
Extended Data Figure 10.
Extended Data Figure 10.. PE promotes OPC proliferation in vitro.
a, Gene ontology (GO) terms that were significantly up-regulated (the adjusted p value < 0.05) in primary OPCs after 1 hour of PE treatment (20 μM, n = 3 independent biological repeats). Numbers in the bars indicate the number of genes that were significantly up-regulated after PE treatment within each GO term. If more than 5 GO terms were significantly enriched within the subontology (BP: Biological process; MF: Molecular function. CC: Cellular component), only the top 5 GO terms were shown. b, GO terms that were significantly down-regulated (the adjusted p value < 0.05) in primary OPCs after 1 hour of PE treatment. c, Volcano plot showing differential gene expression in OPCs treated with PE for 1 hour compared to control (no treatment). FDR: false discovery rate. FC: fold change. Total variables: 19,820. d, Representative live cell tracking of primary cultured OPCs for 24 hours after PE treatment (+ PE) and without treatment (Ctrl). OPCs that did not proliferate within 24 hours were labeled in blue. OPCs that proliferated at least once within 24 hours were labeled in red. e, Quantification of OPC proliferation in control and +PE conditions. n = 3 independent biological repeats. Student’s t-test. f, The experimental design of OPC differentiation assay, and representative confocal images of the OPC/oligodendrocytes mixed cultures 2 days after PDGF-AA withdrawal (Day 4) in the absence (Ctrl) or with the presence of PE (+ PE). Green arrow indicates an example of fully differentiated oligodendrocytes with strong MBP expression (MBPs). White arrow indicates an example of differentiating OPCs that have weak expression of both NG2 and MBP (NG2wMBPw). Magenta arrow indicates an example of OPCs that remain undifferentiated with strong NG2 expression. g, Quantification of f. n = 3 independent biological repeats.
Figure 1.
Figure 1.. In vivo 2P imaging reveals that OPCs exhibit dynamic Ca2+ activity.
a, Schematic illustrations of the research design. Expression of membrane anchored or cytosolic GCaMP6s or in PDGFRα+ OPCs was induced between P60–80. OPC Ca2+ activity in the visual cortex of head-fixed, awake mice was observed through a chronic cranial window using 2P excitation from a Ti:Sapphire laser. See Methods for details. b, Example ΔF/F traces of OPC membrane Ca2+ events detected and randomly pseudocolored by AQuA software. Example Ca2+ events were overlaid on an mGCaMP6s-expressing OPC visualized by projecting a total of 601 frames over 5 min onto a single image plane (Maximum projection). 1–9: process events. S: soma event. c-d, Frame-by-frame views of a stationary (c) and a propagating (d) OPC membrane Ca2+ event. Dotted white circles delineate the OPC cell body. e, Heatmap showing all Ca2+ events detected in an OPC over a 5-minute recording, sorted according to the time of event onset. Note absence of an increase of Ca2+ activity, which would suggest artificial photoactivation. f, Summation of all membrane Ca2+ activities and events (randomly pseudocolored by AQuA) exhibited by an OPC during a 5-minute recording. Note how the events are widespread throughout OPC soma and processes. g, Heatmaps showing overall event frequency and event origins (defined as the location where an event reaches 20% of the amplitude) of the OPC in f. Data from b-g is representative from 6 independent experiments that yielded similar results.
Figure 2.
Figure 2.. OPC Ca2+ activity is significantly suppressed during anesthesia.
a, Representative images of an mGCaMP6s-expressing OPC exhibiting decreased Ca2+ activity during general anesthesia. OPC morphology was visualized by summing a total of 361 frames (3 minutes) (Sum of Ca2+ activity) and highlighted in green. Heatmaps show Ca2+ event frequency (Detected events). b, Quantification of Ca2+ activity. Black filled circles and error bars represent mean ± SEM. n = 6 OPCs from 6 mice (mice are color-coded throughout). One-Way Repeated Measure ANOVA. Frequency: F = 91.3457, p = 0.0019; Event area: F = 81.9459, p = 0.0022; Duration: F = 1.2328, p = 0.4337; Amplitude: F = 0.7940, p = 0.5729. Post-hoc: Tukey. *: p < 0.05; **: p < 0.01; ***: p < 0.001; ****: p < 0.0001 throughout.
Figure 3.
Figure 3.. Enforced locomotion enhances OPC Ca2+ activity in the mouse visual cortex.
a, Schematic illustration of the experiment setup and design. During a 1 min recording window, enforced locomotion was triggered (Motor ON) at 30 s for 5 s. b, Representative 2P images showing OPC Ca2+ activity at baseline (20.1 s) and after enforced locomotion was triggered (38.1 s). c, A representative heatmap showing OPC Ca2+ events sorted according to their time of onset during the 1 min recording. Dotted line indicates the time when locomotion was induced. d, Frame-by-frame views of Ca2+ events (randomly pseudocolored) triggered by enforced locomotion. Cell highlighted by the white square in b. e, Average ΔF/F traces of Ca2+ events that occurred during baseline (gray) and 10 s after onset of enforced locomotion (red) aligned to their peaks. Shaded areas represent standard deviation. n = 114 baseline events and 131 enforced locomotion events in 5 mice. f, Quantification of the average number, area, amplitude, and duration of OPC Ca2+ events during the recording (binned by a 10-second interval). Gray dashed lines indicate onset of enforced locomotion. Black filled circles and error bars represent mean ± SEM. One-Way Repeated Measure ANOVA. Average # of events: F = 2.0814, p = 0.1013; Average area: F = 1.5205, p = 0.0300; Average duration: F = 1.8837, p = 0.0173; Average amplitude: F = 1.5530, p = 0.5725. Post-hoc: Tukey. n = 5 recordings from 5 mice.
Figure 4.
Figure 4.. OPC Ca2+ activity is reduced when noradrenergic signaling is inhibited.
a, Representative heatmaps showing suppression of OPC Ca2+ activity by chlorprothixene (CPX, 5 mg/kg), prazosin (Prz, 3 mg/kg) and dexmedetomidine (Dex, 0.1 mg/kg), respectively. DMSO was used as the solvent control. b, Quantification of the effects on noradrenergic modulators. Black filled circles and error bars represent mean ± SEM. n = 5 OPCs from 5 mice for DMSO, 4 OPCs from 4 mice for CPX, 6 OPCs from 6 mice for Prz and 6 OPCs from 6 mice for Dex. Frequency: F = 15.1469, p = 0.0000 (One-Way ANOVA); Event area: Chi-Square = 10.4329, p = 0.0152 (Kruskal-Wallis ANOVA); Duration: F = 1.9732, p = 0.1563; Amplitude: F = 3.13557, p = 0.0528 (One-Way ANOVA). Post-hoc: Tukey. n.s.: not significant.
Figure 5.
Figure 5.. OPC Ca2+ transients evoked by the α1 adrenergic receptor agonist are independent of synaptic activity in vitro.
a, Example ΔF/F traces of OPC membrane Ca2+ transients observed in layer I of acute cortical slices (close to somatosensory cortex) in ACSF at RT. The morphology of mGCaMP6s-expressing OPC was visualized by perfusing 10 μM phenylephrine (PE) at the end of the recording (also see in c). b, Comparison of average event frequency, area, amplitude and duration of OPC membrane Ca2+ transients across all cortical layers with and without the inhibitor solution containing: TTX (1 μM), NBQX (10 μM), CPP (10 μM) and SR 95531 (20 μM). Black filled circles and error bars represent mean ± SEM. n = 4 recordings from 4 mice. Paired sample Student’s t-test, two-sided. c, Quantification of PE-evoked Ca2+ transients induced in OPCs (see text for details). The black line and the shaded area represent mean ± SEM. n = 11 OPCs from 3 mice. d, Representative images showing evoked Ca2+ increases in mGCaMP6s-expressing OPCs (yellow arrowheads) after exposure to PE (ACSF + PE) compared to ACSF alone (ACSF). e, ΔF/F quantification from 10 OPCs in 3 mice when exposed to PE in the presence of the inhibitor solution. The black line and the shaded area represent mean ± SEM. f, Quantification of PE-evoked OPC Ca2+ increase in the presence and absence of the inhibitor solution. Black filled circles and error bars represent mean ± SEM. n = 11 OPCs from 3 mice for PE; 10 OPCs from 3 mice for PE + inhibitor solution. Student’s t-test, two-sided.
Figure 6.
Figure 6.. Deletion of Adra1a from OPCs eliminates alpha adrenoceptor mediated Ca2+ signaling.
a, Representative images showing that PE failed to evoke Ca2+ increases in mGCaMP6s-expressing OPCs (yellow arrowheads) in acute cortical slices from PDGFRα-CreER;Rosa26-lsl-mGCaMP6s;Adra1acKO/cKO animals (cKO). Note that PDGFRα+ perivascular fibroblasts (cyan arrowheads) were stimulated by PE, while Adra1a cKO OPCs were not. Ionomycin was applied at the end of the recording to identify mGCaMP6s-expressing OPCs. b, Quantification of the response of OPCs to PE. Black line and shaded area represent mean ± SEM. n = 18 OPCs, 3 mice. c, Representative images of summed Ca2+ activity and heatmaps of detected events showing cKO OPCs exhibited less frequent membrane Ca2+ transients than control (Ctrl, PDGFRα-CreER;Rosa26-lsl-mGCaMP6s;Adra1awt/wt) animals. d, Quantification of the response of OPCs to PE. Black filled circles and error bars represent mean ± SEM. n = 6 OPCs from 6 mice for Ctrl; 8 OPCs from 6 mice for cKO. Student’s t-test, two-sided. e, Representative images showing OPC Ca2+ activity in Adra1a cKO mice was not increased after enforced locomotion. f, Quantification of response of OPCs to enforced locomotion. Gray dotted lines indicate the onset of enforced locomotion. Black filled circles and error bars represent mean ± SEM. n = 7 recordings from 7 mice (color-coded). One-Way Repeated Measure ANOVA. Average area: F = 7.2384. Average duration: F = 3.0761. Post-hoc: Tukey.
Figure 7.
Figure 7.. Spontaneous Ca2+ transients in OPCs progressively decline as they differentiate into myelinating oligodendrocytes.
a, Representative images showing diverse Ca2+ dynamics within different OPCs. Cyan arrowhead indicates PDGFRα+ perivascular fibroblasts, which were used as landmarks to register images across different time points. The OPC highlighted in green persisted throughout the recording. The OPC highlighted in red became undetectable at Day 19, while a nearby OPC (cyan) extended its processes (yellow arrowhead) to the space now left unoccupied by the absent OPC. A similar phenomenon was also seen with the neighboring OPC highlighted in green on Day 29 (yellow arrowhead). b, Heatmaps showing the Ca2+ activity of the OPC highlighted in green on Day 1, 19 and 29. c, Heatmaps showing the Ca2+ activity of the OPC highlighted in red on Day 1, 13, 15, 17 and 19. The red arrowhead indicates the position of the cell body of the disappearing OPC (red) on Day 17. d, Quantification of the OPC Ca2+ event frequency, amplitude, and duration over time (n = 9 cells from 6 mice). e, Schematic illustration of the dual longitudinal imaging experiment using both 2P to detect Ca2+ changes and SCoRe imaging to detect changes in myelin (see Methods). f, An example of an OPC (blue) with declining activity, and the local myelin pattern surrounding its cell body on the day the OPC became undetectable (Day 0, green), and 16 days after the disappearance (Day 16, magenta). Yellow arrowheads indicate the new myelin found 16 days after the disappearance of the OPC. g, Quantification of f. n = 18 cells (7 stable and 11 declining) from 4 mice.
Figure 8.
Figure 8.. Selective deletion of Adra1a from OPCs reduces their proliferation.
a, Schematic illustration of the research design. Both control (Ctrl, PDGFRα-CreER;Rosa26-lsl-mGCaMP6s;Adra1awt/wt) and Adra1a cKO animals (cKO, PDGFRα-CreER;Rosa26-lsl-mGCaMP6s;Adra1afl/fl) were given one injection (i.p.) of tamoxifen at P69 to sparsely induce Cre-mediated recombination in OPCs. EdU (5-ethynyl-2’-deoxyuridine) was administered in drinking water 16 days later to label proliferating cells before brains were harvested at P99. b, Representative images illustrating EdU+ OPCs (PDGFRα+EdU+) in the mouse visual cortex. Yellow arrows highlight OPCs that were not recombined (still expressing ADRA1A) and proliferated during P85 – P99 (PDGFRα+EdU+GFP). c, Quantification of OPC proliferation. Each data point (gray dot) represents an average of 3–4 cortical slices per animal. Black filled circles and error bars represent mean ± SEM. Ctrl: n = 7 mice; cKO: n = 8 mice. Student’s t-test, two-sided. d, Schematic illustration of the research design for OPC fate-mapping. e, Quantification of OPCs (GFP+PDGFRα+) and oligodendrocytes (GFP+CC1+) in control and Adra1a cKO mice. Each data point (gray dot) represents an average from 3–4 cortical slices per animal. Black filled circles and error bars represent mean ± SEM. Ctrl: n = 9 mice; cKO: n = 6 mice. Student’s t-test, two-sided.

References

    1. Xiao L et al. Rapid production of new oligodendrocytes is required in the earliest stages of motor-skill learning. Nat. Neurosci 19, 1210–1217 (2016). - PMC - PubMed
    1. Hughes EG, Orthmann-Murphy JL, Langseth AJ & Bergles DE Myelin remodeling through experience-dependent oligodendrogenesis in the adult somatosensory cortex. Nat. Neurosci 21, 696–706 (2018). - PMC - PubMed
    1. Chang A, Nishiyama A, Peterson J, Prineas J & Trapp BD NG2-Positive Oligodendrocyte Progenitor Cells in Adult Human Brain and Multiple Sclerosis Lesions. J. Neurosci 20, 6404–6412 (2000). - PMC - PubMed
    1. Orthmann-Murphy J et al. Remyelination alters the pattern of myelin in the cerebral cortex. eLife 9, e56621 (2020). - PMC - PubMed
    1. Buchanan J et al. Oligodendrocyte precursor cells ingest axons in the mouse neocortex. Proc. Natl. Acad. Sci 119, e2202580119 (2022). - PMC - PubMed

Methods-only references

    1. Wang Y et al. Accurate quantification of astrocyte and neurotransmitter fluorescence dynamics for single-cell and population-level physiology. Nat. Neurosci 22, 1936–1944 (2019). - PMC - PubMed
    1. Dubbs A, Guevara J & Yuste R moco: Fast Motion Correction for Calcium Imaging. Front. Neuroinformatics 10, (2016). - PMC - PubMed
    1. Kalman RE A New Approach to Linear Filtering and Prediction Problems. J. Basic Eng 82, 35–45 (1960).
    1. Kang SH et al. Degeneration and impaired regeneration of gray matter oligodendrocytes in amyotrophic lateral sclerosis. Nat. Neurosci 16, 571–579 (2013). - PMC - PubMed
    1. Wolff C et al. Multi-view light-sheet imaging and tracking with the MaMuT software reveals the cell lineage of a direct developing arthropod limb. eLife 7, e34410 (2018). - PMC - PubMed

Publication types