. 2024 Apr;40(2):718-733.
doi: 10.1007/s12028-023-01816-z. Epub 2023 Sep 11.

Multimodal Prediction of 3- and 12-Month Outcomes in ICU Patients with Acute Disorders of Consciousness

Affiliations

Multimodal Prediction of 3- and 12-Month Outcomes in ICU Patients with Acute Disorders of Consciousness

Moshgan Amiri et al. Neurocrit Care. 2024 Apr.

Abstract

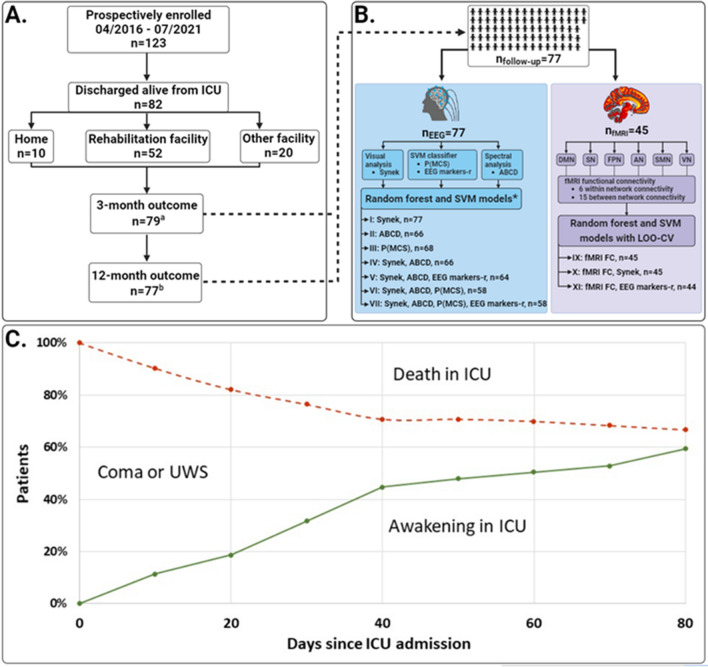
Background: In intensive care unit (ICU) patients with coma and other disorders of consciousness (DoC), outcome prediction is key to decision-making regarding prognostication, neurorehabilitation, and management of family expectations. Current prediction algorithms are largely based on chronic DoC, whereas multimodal data from acute DoC are scarce. Therefore, the Consciousness in Neurocritical Care Cohort Study Using Electroencephalography and Functional Magnetic Resonance Imaging (i.e. CONNECT-ME; ClinicalTrials.gov identifier: NCT02644265) investigates ICU patients with acute DoC due to traumatic and nontraumatic brain injuries, using electroencephalography (EEG) (resting-state and passive paradigms), functional magnetic resonance imaging (fMRI) (resting-state) and systematic clinical examinations.

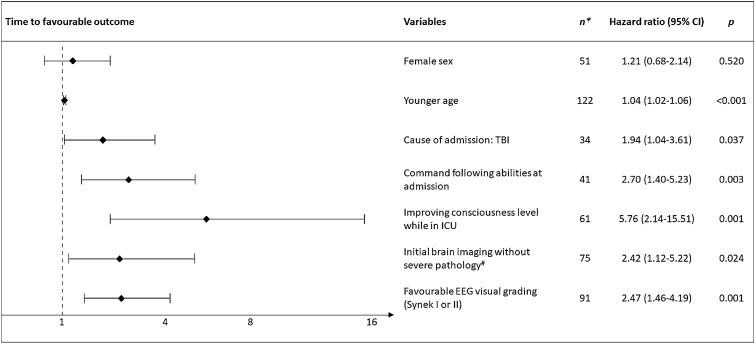
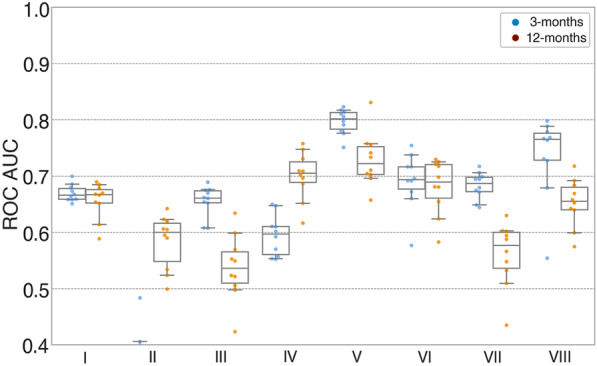
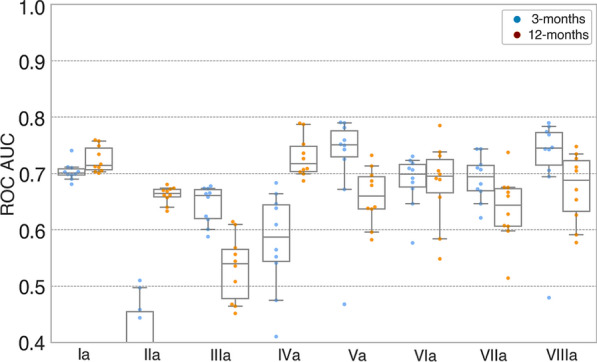
Methods: We previously presented results for a subset of patients (n = 87) concerning prediction of consciousness levels in the ICU. Now we report 3- and 12-month outcomes in an extended cohort (n = 123). Favorable outcome was defined as a modified Rankin Scale score ≤ 3, a cerebral performance category score ≤ 2, and a Glasgow Outcome Scale Extended score ≥ 4. EEG features included visual grading, automated spectral categorization, and support vector machine consciousness classifier. fMRI features included functional connectivity measures from six resting-state networks. Random forest and support vector machine were applied to EEG and fMRI features to predict outcomes. Here, random forest results are presented as areas under the curve (AUC) of receiver operating characteristic curves or accuracy. Cox proportional regression with in-hospital death as a competing risk was used to assess independent clinical predictors of time to favorable outcome.

Results: Between April 2016 and July 2021, we enrolled 123 patients (mean age 51 years, 42% women). Of 82 (66%) ICU survivors, 3- and 12-month outcomes were available for 79 (96%) and 77 (94%), respectively. EEG features predicted both 3-month (AUC 0.79 [95% confidence interval (CI) 0.77-0.82]) and 12-month (AUC 0.74 [95% CI 0.71-0.77]) outcomes. fMRI features appeared to predict 3-month outcome (accuracy 0.69-0.78) both alone and when combined with some EEG features (accuracies 0.73-0.84) but not 12-month outcome (larger sample sizes needed). Independent clinical predictors of time to favorable outcome were younger age (hazard ratio [HR] 1.04 [95% CI 1.02-1.06]), traumatic brain injury (HR 1.94 [95% CI 1.04-3.61]), command-following abilities at admission (HR 2.70 [95% CI 1.40-5.23]), initial brain imaging without severe pathological findings (HR 2.42 [95% CI 1.12-5.22]), improving consciousness in the ICU (HR 5.76 [95% CI 2.41-15.51]), and favorable visual-graded EEG (HR 2.47 [95% CI 1.46-4.19]).

Conclusions: Our results indicate that EEG and fMRI features and readily available clinical data predict short-term outcome of patients with acute DoC and that EEG also predicts 12-month outcome after ICU discharge.

Keywords: Coma; Consciousness; Electroencephalography; Functional magnetic resonance imaging; Intensive care unit.


Conflict of interest statement

The authors report no conflicts of interest.

Figures

Fig. 1
Fig. 1
Study flowchart, data assessment strategy and death in ICU. A. A total of 123 patients with acute DoC were included, of whom 41 died during ICU admission. Of the 82 patients discharged alive, 10 (12%) patients were discharged directly to their own home, 20 (24%) to other care facilities such as nursing homes, and the remaining 52 (63%) to a high-level neurorehabilitation facility. Three-month follow-up data was available from 79 (96%) patients, and 12-month follow-up data from 77 (94%) patients. B. Full sets of 3- and 12-month follow-up data were available for 77 (94%) patients. EEG recordings were available from all patients (blue box), while fMRI resting-state sequences were available from 45 (58%) patients (purple box). EEGs were analyzed with three different approaches; (1) visual manual analysis and scoring according to the Synek scale, (2) automated spectral analysis according to the ABCD model, and (3) a machine learning based SVM consciousness classifier resulting in the probability of being at least in a minimal conscious state (P(MCS)) and 68 EEG markers derived from segments of resting-state EEG (EEG markers-r). Two different machine learning algorithms (i.e., random forest and SVM) were used to conduct seven different predictive models based on EEG features (i.e., models I to VIII) and three different models including fMRI features with or without EEG features (i.e., models IX to XI). Models including fMRI features were assessed with additional LOO-CV procedure due to the limited number of available samples. C. This part depicts the proportion of patients in coma or UWS who either awoke to at least MCS- (i.e., regained consciousness to some degree) or died during ICU admission. At time 0 (admission to the ICU) none of the patients were awake (0%) and all were alive (100%). The red line shows the proportion of patients who died in the ICU, and the green line shows the proportion of patients who awoke from coma or UWS in the ICU. During ICU admission, a total of 41 patients (33%) died, while 82 (67%) survived, of whom 73 (59%) awoke prior to ICU discharge. The area between the red and green line indicates the proportion of patients (7%) who remained in coma or UWS at ICU discharge. aIncluding eight patients who died prior to 3-month follow-up; bIncluding 13 patients who died prior to 12-month follow-up; * all EEG models were also tested with same-sample data for head-to-head comparison (see also Table 3). Abbreviations: ICU = intensive care unit, EEG = electroencephalography, fMRI = functional magnetic resonance imaging, SVM = support vector machine, DMN = default mode network, SN = salience network, FPN = frontoparietal network, AN =auditory network, SMN = somatosensory network, VN = visual network, LOO-CV = leave-one-out cross-validation, FC = functional connectivity, UWS = unresponsive wakefulness syndrome.
Fig. 2
Fig. 2
Predictors of time to favorable outcome. This figure depicts independent variables predicting time to favorable outcome (i.e., GOS-E ≥ 4, mRS ≤ 3 and CPC ≤ 2). Death in ICU (n = 41) was treated as a competing risk in a multivariate Cox proportional regression model. Younger age, patients with TBI, ability to follow commands at admission, improving consciousness level during ICU, no severe pathological findings at admission brain imaging, and favorable visual grading of EEG (i.e., Synek score I or II) were all independent predictors of earlier recovery. *Of all 123 included patients, one patient without EEG was excluded from this analysis. #Severe pathological findings on brain imaging was defined as Fisher grade ≥ 3 (for subarachnoid hemorrhage), Marshall classification ≥ 3 (for TBI), hemorrhage volume ≥ 30 mL (for intracerebral hemorrhage), strategic hemorrhage or infarct in brainstem (for ischemic stroke or infratentorial hemorrhage), any visible sign of anoxic brain injury on CT scan (for cardiac arrest), global cortical edema (for patients with brain edema), brain tumors with midline compression, compression of basal cisterns and/or signs of hydrocephalus (for patients with any type of brain tumor). Abbreviations: TBI = traumatic brain injury. ICU = intensive care unit, EEG = electroencephalography.
Fig. 3
Fig. 3
Random forest EEG models with maximum available data predicting 3- and 12-month outcomes. Boxplots illustrating model performances (AUCs) of RF-models based on EEG features predicting 3-month (blue) and 12-month (orange) functional outcomes. Each model is based on the maximum amount of data available (see also Fig. 1). Of the unimodal models (I-III), only model I based on the Synek score could predict both 3- and 12-month outcomes. The highest AUC for predicting both outcomes (AUC3-month 0.79 [0.77–0.82]; AUC12-month 0.74 [0.71–0.77]) were obtained with the combined model (V) based on combination of three EEG features (i.e., Synek score, ABCD categories and EEG markers-r derived from the SVM consciousness classifier). Overall, this figure shows that while Synek score was the only unimodal EEG-model that predicted both 3- and 12-month functional outcomes, all models based on a combination of EEG features (IV–VII) could predict both 3- and 12-month outcomes with AUCs above chance level. A similar pattern was observed for SVM machine learning models (see Fig. S1). Individual EEG random forest models: I = Synek, II = ABCD, III = P(MCS) C. Combined EEG random forest models: IV = Synek + ABCD, V = Synek + ABCD + EEG markers-r, VI = Synek + ABCD + P(MCS), VII = Synek + P(MCS) and VIII = Synek + ABCD + P(MCS) + EEG markers-r
Fig. 4
Fig. 4
Random forest EEG models with same-sample data predicting 3- and 12-month outcomes. Boxplots illustrating model performances (AUCs) of machine learning models based on EEG features predicting 3-month (blue) and 12-month (orange) functional outcomes. Each model is based on the same samples (n = 58) for head-to-head comparison of EEG features. Of the unimodal models (Ia-IIIa), model Ia based on Synek score outperformed model IIa based on ABCD categories in predicting 3-month outcome (AUCSynek 0.70 [0.69–0.74] vs. AUCABCD 0.38 [0.31–0.45]). In predicting 12-month outcome, model Ia outperformed model IIIa which was based on P(MCS) measures (AUCSynek 0.70 [0.69–0.74] vs. AUCP(MCS) 0.54 [0.50–0.59]). Of the combined models based on at least three EEG features (Va-VIIa), all models could predict 3- and 12-month outcomes, and none outperformed the others. A similar pattern was observed for SVM machine learning models (see Fig. S2). Individual same-sample EEG random forest models: Ia = Synek, IIa = ABCD, IIIa = P(MCS) C. Combined same-sample EEG random forest models: IVa = Synek + ABCD, Va = Synek + ABCD + EEG markers-r, VIa = Synek + ABCD + P(MCS), VIIa = Synek + P(MCS) and VIIIa = Synek + ABCD + P(MCS) + EEG markers-r. Abbreviations: ROC = receiver operating curve, AUC = area under the curve.

Similar articles

Cited by

References

    1. Owen AM, Coleman MR, Boly M, Davis MH, Laureys S, Pickard JD. Detecting awareness in the vegetative state. Science. 2006;313(5792):1402. - PubMed
    1. Ballanti S, Campagnini S, Liuzzi P, et al. EEG-based methods for recovery prognosis of patients with disorders of consciousness: a systematic review. Clin Neurophysiol. 2022;144:98–114. - PubMed
    1. Edlow BL, Claassen J, Schiff ND, Greer DM. Recovery from disorders of consciousness: mechanisms, prognosis and emerging therapies. Nat Rev Neurol. 2021;17(3):135–156. - PMC - PubMed
    1. Kondziella D, Amiri M, Othman MH, et al. Incidence and prevalence of coma in the UK and the USA. Brain Commun. 2022 doi: 10.1093/braincomms/fcac188. - DOI - PMC - PubMed
    1. Hammond FM, Katta-Charles S, Russell MB, et al. Research needs for prognostic modeling and trajectory analysis in patients with disorders of consciousness. Neurocrit Care. 2021;35(Suppl 1):55–67. - PMC - PubMed

Associated data