. 2023 Oct;3(10):1288-1311.
doi: 10.1038/s43587-023-00479-x. Epub 2023 Sep 11.

Transcriptional and epigenetic decoding of the microglial aging process

Affiliations

Transcriptional and epigenetic decoding of the microglial aging process

Xiaoyu Li et al. Nat Aging. 2023 Oct.

Erratum in

Abstract

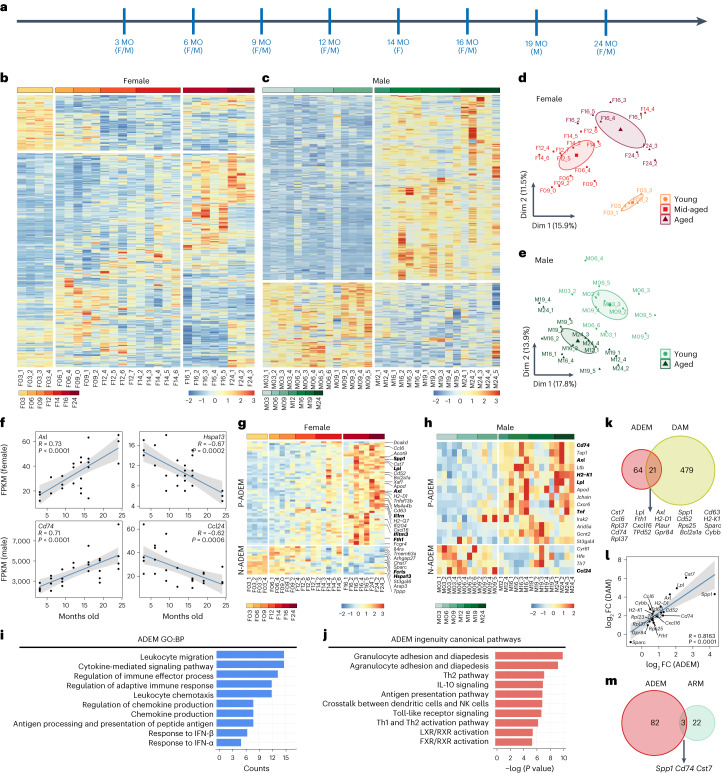
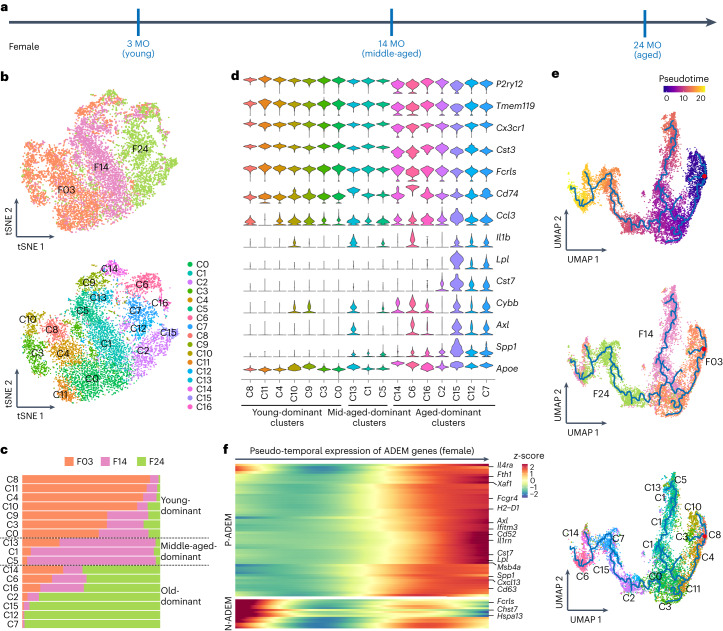
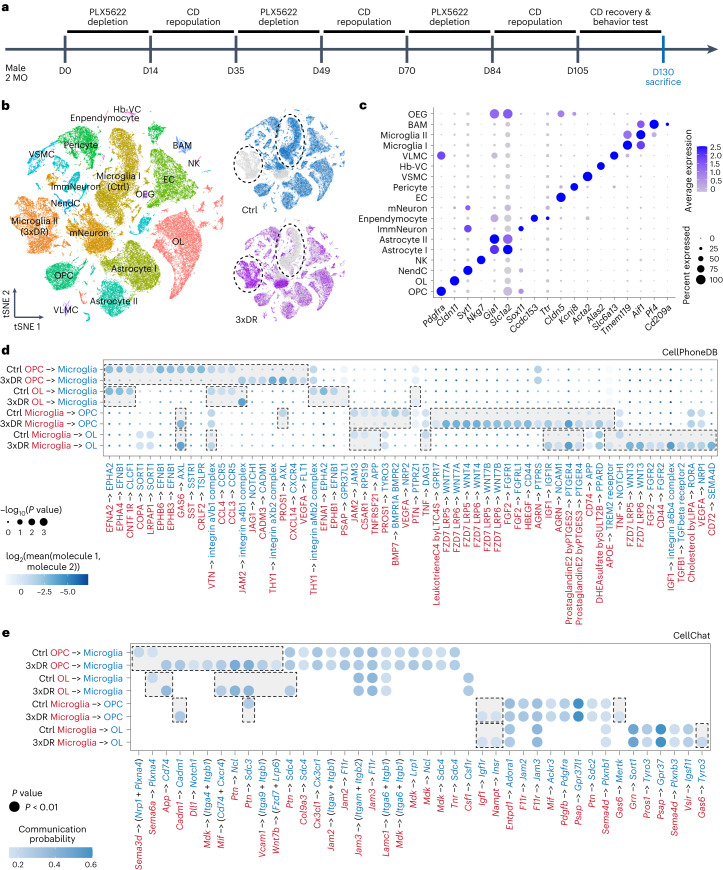
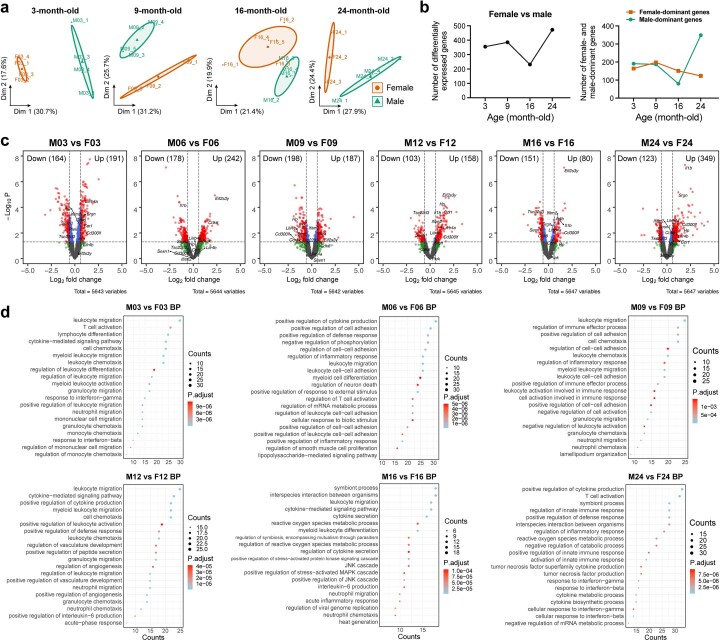
As important immune cells, microglia undergo a series of alterations during aging that increase the susceptibility to brain dysfunctions. However, the longitudinal characteristics of microglia remain poorly understood. In this study, we mapped the transcriptional and epigenetic profiles of microglia from 3- to 24-month-old mice. We first discovered unexpected sex differences and identified age-dependent microglia (ADEM) genes during the aging process. We then compared the features of aging and reactivity in female microglia at single-cell resolution and epigenetic level. To dissect functions of aged microglia excluding the influence from other aged brain cells, we established an accelerated microglial turnover model without directly affecting other brain cells. By this model, we achieved aged-like microglia in non-aged brains and confirmed that aged-like microglia per se contribute to cognitive decline. Collectively, our work provides a comprehensive resource for decoding the aging process of microglia, shedding light on how microglia maintain brain functions.


Conflict of interest statement

The authors declare no competing interests.

Figures

Fig. 1
Fig. 1. Transcriptional profiling by bulk RNA-seq to investigate the sex-dependent microglial aging process and ADEM gene set.
a, Scheme of timepoints for microglia bulk RNA-seq analysis. Microglia were collected by FACS from C57BL/6J female and male mouse brains. b,c, Heat maps of microglial DEGs during the aging process in female (b) and male (c) mice. Cells are colored according to the z-score, and stages are separated by gap. d,e, PCA plots of microglial phenotypes during the aging process in female (d) and male (e) mice. f, Scatter plot showing linear regression of representative genes correlated with the aging process. Gray shading represents the 95% confidence interval, and Pearson’s correlation coefficients and P values are shown. g,h, Heat maps of ADEM genes during the aging process in female (g) and male (h) mice. Cells are colored according to the z-score, and stages are separated by gap. i, Top 10 significantly enriched BPs of ADEM genes annotated by GO (q < 0.05). j, Top 10 significantly enriched canonical pathways of ADEM genes annotated by IPA (q < 0.05). k, Venn diagram revealing 21 genes overlapping between the ADEM and DAM gene sets. Genes in both ADEM and DAM gene sets are listed below. l, Scatter plot showing linear regression of log2FC of overlapping genes between ADEM and DAM gene sets, revealing that they are positively correlated. Gray shading represents the 95% confidence interval, and Pearson’s correlation coefficient and P value are shown at the bottom. m, Venn plot revealing that only three genes are overlapping between ADEM and ARM gene sets. Genes in both ADEM and ARM gene sets are listed below. n = 2–6 mice for each group. BP, biological process; F, female; F03_1, 3-month-old female, biological replicate 1; M03_1, 3-month-old male, biological replicate 1, and so on in a similar fashion; M, male; MO, months old; Dim, dimension. Source data
Fig. 2
Fig. 2. Characteristics of microglial cell aging by scRNA-seq.
a, Scheme of microglial scRNA-seq from young (3 MO), middle-aged (14 MO) and aged (24 MO) female mice. b, tSNE plots of young (3 MO), middle-aged (14 MO) and aged (24 MO) microglia. Cells are divided into 17 clusters (C0–C16) by unsupervised classification, and cells are colored according to age (upper panel) and cluster (lower panel). c, Cell proportion of three ages in each cluster identifies young-dominant, middle-aged-dominant and aged-dominant clusters; clusters and age distributions are shown in b. d, Violin plots showing the expression levels of 14 microglial homeostasis-associated genes and inflammatory-related genes in each cluster. e, Pseudotime trajectories of microglia from three ages. Microglia at distinct time states show distinct trajectories. f, Heat map showing the expression levels of ADEM genes, which are correlated with pseudotime. n = 5 mice for each group. In total, 4,207 young (3 MO), 3,272 middled-aged (14 MO) and 2,497 aged (24 MO) microglia are harvested. F03, 3-month-old female, and so on in a similar fashion; MO, months old. Source data
Fig. 3
Fig. 3. Chromatin landscapes identified by ATAC-seq unveil epigenetic features of microglia during the aging process.
a, Scheme of microglial ATAC-seq from young (3 MO), middle-aged (14 MO) and aged (24 MO) mice. b, ATAC peaks around the TSS (−1 kb to 1 kb) of microglia at three ages. Data are presented as mean ± s.d., heat map showing enrichment of normalized ATAC-seq reads within ±1 kb of TSS in microglia at different stages. c, Representative genome browser views showing ATAC peaks of Axl, Cd74, Cst7, Spp1 and Fth1. The numbers in brackets indicate the minimum and maximum values of the y axis. Ref, reference genome view of mm10. d, Heat map of differentially accessible chromatin promoter regions of ADEM genes. Cells are colored according to the z-score, and rows are hierarchically clustered. e,f, Heat map of differentially accessible TF motifs to all genes (e) and ADEM genes (f). Cells are colored according to the z-score, and rows are hierarchically clustered. g, Sequence logos of selected ADEM gene-associated TF motifs. h,i, Line chart showing the peak counts of the TF-encoding genes Cebpb (up-regulated with age) and Mef2c (down-regulated with age). j,k, Line chart showing the binding activities of CEBPβ (j) and MEF2C (k) to all genes and ADEM genes. Data are presented as mean ± s.d. n = 2 ATAC-seq tests for each group. Microglia from 2–3 mice were pooled together for each ATAC-seq test. MO, months old. Source data
Fig. 4
Fig. 4. scRNA-seq and bulk RNA-seq reveal that microglia respond to LPS challenge in an age-dependent manner.
a, Scheme of LPS and PBS administration and timepoints for scRNA-seq and bulk RNA-seq. b, tSNE plots of scRNA-seq display different responses of young (3 MO), middle-aged (14 MO) and aged (24 MO) microglia to LPS challenge. Cells are colored according to the group (left) and unsupervised clusters (right) separately. c, PCA plots of bulk RNA-seq display different responses of young, middle-aged and aged microglia to LPS challenge. n = 3–5 mice for each group. d, Violin plots show the expression levels of Ifitm1, Ifitm6, Ilr2, Il1β, Ifitm2, Ccl5, Ccl7, Ccl3, Ccl4, Ccl12, Ifi205 and Il1rn grouped by clusters; these genes are enriched in c13–c16. e, Top 10 significant BPs annotated by GO and IPA of c13–c16 enriched genes (q < 0.05). f, Volcano plots of LPS-challenged microglia versus PBS-treated controls at 3 months, 14 months and 24 months of age. Red and blue represent significant DEGs (P < 0.05, log2FC ≥ 1, QL F-tests). g, Heat maps of cytokine production and phagocytosis-related DEGs of LPS-challenged microglia versus PBS-treated control at 3 months, 14 months and 24 months of age. h, Bar plot showing the DEG numbers of cytokine production-related and phagocytosis-related genes (as shown in g). i, FPKM of Myd88, Il1b, Il6, Tnf, Ccl5, S100a8, S100a9 and Cxcl13. Data are presented as mean ± s.d. Two-tailed independent t-test. n = 5, 4, 3, 3, 5 and 3 mice for young (PBS), middle-aged (PBS), aged (PBS), young (LPS), middle-aged (LPS) and aged (LPS), respectively. Two-tailed independent t-test. n = 5 mice for each group of b, d and e. In total, 3,539 young (3 MO), 4,149 middle-aged (14 MO) and 4,313 aged (24 MO) microglia after LPS challenge were harvested in each group of b, d and e. BP: biological process; BW, body weight; F03_LPS, LPS-challenged 3-month-old females, and so on in a similar fashion; MO, months old; Dim, dimension. Source data
Fig. 5
Fig. 5. ATAC-seq reveals the divergence of chromatin modifications between microglial aging and reactivity to LPS challenge.
a, Scheme of LPS and PBS administration and timepoints for ATAC-seq. b, ATAC peaks around the TSSs (−1 kb to 1 kb) of LPS-challenged microglia at three ages. Data are presented as mean ± s.d., heat map showing enrichment of normalized ATAC-seq reads within ±1 kb of TSSs in microglia at different stages. c, PCA plot showing that microglia of different ages exhibit distinct chromatin modifications in response to LPS challenge. d, Volcano plots of differentially accessible peaks upon LPS challenge (3 MO LPS versus 3 MO PBS) and age-related change (24 MO PBS versus 3 MO PBS), revealing divergent chromatin modifications between LPS challenge and the aging process (P < 0.05, log2FC ≥ 1, QL F-tests). e, Bar plots showing the distribution of differential peaks in gene encoding and regulatory element regions. f, Representative genome browser views showing ATAC peaks of Il1rn, Vmp1, Aff1, Bach1 and Map2k3os. The numbers in brackets indicate the minimum and maximum values of the y axis. Ref, reference genome view, mm10. g, Volcano plots of differential accessible peaks of LPS-challenged microglia across different ages reveal conserved epigenetic modifications across different ages. n = 2 ATAC-seq tests for each group. Microglia from 2–3 mice were pooled together for each ATAC-seq test (P < 0.05, log2FC ≥ 1, QL F-tests). BW, body weight; MO, months old; UTR, untranslated region; Dim, dimension. Source data
Fig. 6
Fig. 6. 3xDR microglia exhibit an aged-like phenotype.
a, Scheme of 3xDR and timepoints for experiments. b, 3xDR shortens the microglial telomere. n = 7 mice for each group. Two-tailed independent t-test. c, 3xDR microglia (1,313 cells) exhibited transcriptional characteristics distinct from control mice (2,180 cells). n = 5 mice for each group. d, 3xDR microglia display higher P-ADEM and lower N-ADEM gene signature scores. e, 3xDR versus control microglia FC (qPCR) exhibited a similar trend to LPS challenge as aged versus young microglia FC (bulk RNA-seq). n = 4 (3xDR and control) and 3 (3-month-old and 24-month-old; data from Fig. 4) mice. Linear regression. f, tSNE plots show the expression levels of microglial activation-associated and homeostasis-associated genes. g, 3xDR microglia exhibit a phenotype resembling that of aged microglia. h, 3xDR and 24-month-old microglia exhibit higher pseudotime value than 3-month-old and 14-month-old microglia. One-way ANOVA with Bonferroni’s post hoc test. n = 5 mice for each group. In total, 4,207 young, 3,272 middled-aged, 2,497 aged and 1,313 3xDR microglia (g,h). i, Only five genes are overlapping between 3xDR DEGs and ARM gene set. jl, 3xDR microglia exhibit a distinct morphology to control microglia. 3xDR microglia display a larger cell body than control microglia. n = 8 mice for control and 9 mice for 3xDR, 100 cells from cortex and hippocampus for each group. Each dot represents an average result in one mouse (l). Two-tailed independent t-test. m, Top 10 significantly enriched canonical pathways of 3xDR versus control microglial DEGs annotated by IPA (q < 0.05). n,o, 3xDR versus control microglia FC are positively correlated with ADEM (n) and DAM (o) gene sets. Gray shading represents the 95% confidence interval, and Pearson’s correlation coefficients and P values are shown at the bottom. p,q, Representative confocal image shows that OPN and AXL are up-regulated in 3xDR microglia. n = 10 mice for each group. Two-tailed independent t-test. Data are presented as mean ± s.d. BW, body weight; Ctrl, control; MO, months old; NxDR, N-round depletion–repopulation; PLX5622, PLX5622-formulated diet. Source data
Fig. 7
Fig. 7. 3xDR leads to cognitive decline and myelination impairment in non-aged mice.
a, Scheme of the 3xDR mice preparation and behavior tests. b, NOR reveals that 3xDR induces cognitive decline in recognition memory, resembling the phenotype of aged mice. Left, the paradigm of NOR; right, the mouse exploration time to two objects. n = 12, 10, 11 and 11 mice for young, aged, control and 3xDR groups, respectively. c, Y maze reveals that 3xDR induces cognitive decline in spatial learning. Left, representative trajectory heat map in the Y maze; middle and right, the statistical results of control and 3xDR mice. n = 10 mice for each group. d, Morris water maze reveals that 3xDR induces cognitive decline in spatial learning. Left, representative swimming route of control and 3xDR mice in the Morris water maze; right, latency in the training phase, the number of times the mice passed across the platform and the time in the target quadrant in the probe trial. n = 10 and 11 mice for control and 3xDR, respectively. e, Representative confocal images of MBP in the cortex and quantification of average MBP expression in control and 3xDR mouse brains. 3xDR impairs myelination in the cortex. n = 9 and 8 mice for control and 3xDR, respectively. Data are presented as mean ± s.d. Two-tailed independent t-test. Ctrl, control; OFT, open field test. Source data
Fig. 8
Fig. 8. scRNA-seq characterizes the microglial crosstalk with OPCs and OLs in control and 3xDR brains.
a, Scheme of the forced microglial turnover model and timepoints for experiments. Control mice are sex-matched and age-matched animals fed with CD for 130 d. b, tSNE plots of 11,952 control and 8,914 3xDR microglia, revealing an aged-like phenotype of 3xDR microglia. c, Dot plot showing the expression levels of well-known representative cell-type-enriched marker genes across all 16 cell types (18 populations). d, Significant ligand–receptor interactions predicted by CellPhoneDB. One-sided permutation test. e, Significant molecule–molecule interactions predicted by CellChat. One-sided permutation test. Hb-VC, hemoglobin-expressing vascular cell; ImmNeuron, immature neuron; mNeuron, mature neuron; NendC, neuroendocrine cell; OEG, olfactory ensheathing glia; VLMC, vascular and leptomeningeal cell; VSMC, vascular smooth muscle cell.
Extended Data Fig. 1
Extended Data Fig. 1. Sex differences in the microglial transcriptome at each age.
(a) PCA plots display the sex differences in the microglial transcriptome at 3, 9, 16 and 24 months of age. (b) Numbers of differentially expressed genes at each age (left) and numbers of differentially expressed genes with higher expression in females or males (right). (c) Volcano plots of male vs. female microglial transcriptome changes at each age. Red points indicate DEGs. Log2FC ≥ Log21.5, P < 0.05, quasi-likelihood (QL) F tests. (d) Top 20 enriched BP annotations by GO of the male vs. female microglial DEG profile at each age. Q < 0.05. Accumulative hypergeometric test with false discovery rate (FDR) correction. Dim, dimension. Source data
Extended Data Fig. 2
Extended Data Fig. 2. Chromatin modifications in the microglial aging process.
(a) Percentages of differential chromatin accessibility in gene coding and regulatory elements at 3 ages. (b) Chromatin accessibility of ADEM genes at each age. Standardized values were calculated according to peak counts of the promoter region. (c-d) Encoding counts of genes encoding ADEM-enriched transcription factors at each age. Data are presented as mean ± SD. N = 2 ATAC-seq tests for each group. Microglia from 2 to 3 mice were pooled together for each ATAC-seq test. MO: month-old; ADEM: age-dependent microglia. Source data
Extended Data Fig. 3
Extended Data Fig. 3. S100a8 or S100a9 knock-down down-regulates the LPS-induced immune response.
(a) Scheme of Lipofectamine transfection and LPS challenge to primary microglia. (b) qPCR reveals that siS100a8 transfection by Lipofectamine transfection successfully knocks down S100a8. Consequently, 7 out of 13 immune-related genes were down-reregulated upon LPS challenge. In the negative control group: S100a8 (N = 5), Ccl3 (N = 3), Ccl4 (N = 3), Ccl5 (N = 3), Ccl12 (N = 3), Cd14 (N = 3), Cxcl13 (N = 3), Ifitm2 (N = 5), Ifitm3 (N = 3), Il1b (N = 3), Il6 (N = 5), Myd88 (N = 3), Socs3 (N = 4) and Tnf (N = 3). In the siS100a8 group: S100a8 (N = 6), Ccl3 (N = 6), Ccl4 (N = 6), Ccl5 (N = 6), Ccl12 (N = 6), Cd14 (N = 6), Cxcl13 (N = 6), Ifitm2 (N = 9), Ifitm3 (N = 6), Il1b (N = 6), Il6 (N = 9), Myd88 (N = 6), Socs3 (N = 9) and Tnf (N = 6). Where “N” corresponds to the number of biological replicates. (c) qPCR reveals that siS100a9 transfection by Lipofectamine transfection successfully knocks down S100a9. Consequently, 8 out of 13 immune-related genes were down-reregulated upon LPS challenge. In the negative control group: S100a9 (N = 6), Ccl3 (N = 6), Ccl4 (N = 6), Ccl5 (N = 6), Ccl12 (N = 6), Cd14 (N = 5), Cxcl13 (N = 6), Ifitm2 (N = 6), Ifitm3 (N = 6), Il1b (N = 6), Il6 (N = 6), Myd88 (N = 6), Socs3 (N = 6) and Tnf (N = 6). In the siS100a9 group: S100a9 (N = 6), Ccl3 (N = 6), Ccl4 (N = 6), Ccl5 (N = 6), Ccl12 (N = 6), Cd14 (N = 6), Cxcl13 (N = 6), Ifitm2 (N = 6), Ifitm3 (N = 6), Il1b (N = 6), Il6 (N = 6), Myd88 (N = 5), Socs3 (N = 6) and Tnf (N = 6). Where “N” corresponds to the number of biological replicates. Data are presented as mean ± SD. Two-tailed independent t test. Source data
Extended Data Fig. 4
Extended Data Fig. 4. scRNA-seq characterizes the microglial cross talk with astrocytes and endothelial cells in the aged brain.
(a) Scheme of brain scRNA-seq from young (3 MO) and aged (24 MO) mice. N = 5 mice for each group. (b-c) tSNE plots of 4,326 3 MO and 2,762 24 MO brain cells. Cells are colored according to age (b) and cell type (c) separately. (d) Dot plot showing the expression levels of well-known representative cell-type-enriched marker genes across all 15 cell types (16 populations) (see details in Methods). (e) Dot plot showing the expression levels of two astrocyte subtype marker genes. Gja1, Mfge8, Apoe, Slc1a2 and Slco1c1 were relatively enriched in Astrocyte 1, while S100β, Sox9, Gfap and Aldh1l1 were highly expressed in Astrocyte 2. (f) Strip chart displaying 24 MO vs. 3 MO fold-changes in gene expression levels in each cell population. Colored dots indicate significantly up- or down-regulated (P < 0.05, log2FC ≥ 0.25) genes in aged cells compared to young cells. Non-parametric Wilcoxon rank sum test. (g) Heat maps of 24-month-old vs. 3-month-old DEGs (significantly up- or down-regulated (P < 0.05, log2FC ≥ 0.25) in no less than 2 populations) in Astrocyte 1 cells, Astrocyte 2 cells, EC and microglia. (h) Top significantly enriched biological processes of DEGs (significantly up- or down-regulated (P < 0.05, log2FC ≥ 0.25) annotated by GO (Q < 0.05) in Astrocyte 1, Astrocyte 2, EC and microglia. The accumulative hypergeometric test is used for statistical analysis with false discovery rate (FDR) correction. MO: month-old; GO: Gene Ontology; BP: biological process; EC: endothelial cell; VSMC: vascular smooth muscle cell; OL: oligodendrocyte; OPC: oligodendrocyte precursor cell; ABC: arachnoid barrier cell; NSC: neural stem cell; CPC: choroid plexus epithelial cell; NK: natural killer cell.
Extended Data Fig. 5
Extended Data Fig. 5. Predicted molecule-molecule interactions among microglia, astrocytes and ECs in young and aged mice.
(a) Age-dependent ligand-receptor interactions predicted by CellPhoneDB. One-sided permutation test. (b) Significant age-dependent molecule-molecule interactions predicted by CellChat. MO: month-old; EC: endothelial cell. One-sided permutation test.
Extended Data Fig. 6
Extended Data Fig. 6. Each microglial cell proliferates several times by 3xDR.
(a) Scheme of the forced microglial turnover model and timepoints for experiments. (b) Representative spatial distribution of microglia in 3 rounds of depletion-repopulation. Each green dot represents an IBA1+ microglial cell. (c) Statistics of IBA1+ cell number in each round of microglial depletion-repopulation. Data are represented as the mean ± SD. N = 6 (1xDPL, 2xDPL, 3xDPL, 1xDR and 2xDR) to 7 mice (3xDR) for each group. PLX5622: PLX5622-formulated diet; CD: control diet; NxDPL: N-round depletion; NxDR: N-round depletion-repopulation. Source data
Extended Data Fig. 7
Extended Data Fig. 7. Despite the increased morphology-based senescence index, 3xDR microglia do not display a senescent state at the transcriptional level.
(a) Volcano plots of DEGs in 3xDR vs. control microglial transcriptomes (log2 FC > 0.25, adjusted P value < 0.05). Non-parametric Wilcoxon rank sum test. (b) Top 10 significantly enriched biological processes (Q < 0.05) in 3xDR vs. control microglia. The orange bar represents up-regulated gene-enriched pathways; the blue bar represents down-regulated gene-enriched pathways. (c) UMAP plot of LPS-treated, PBS-treated and 3xDR microglia, revealing that 3xDR microglia do not exhibit a reactive phenotype. (d) Senescence index of microglia in the control and forced turnover groups, calculated as the area of IBA1 (mm2) divided by the area under the curve (AUC). Data are represented as the mean ± SD. N = 8 and 7 mice for control and 3xDR, respectively. Two-tailed independent t test. (e) Quantification of β-gal levels in cortical and hippocampal microglia. IBA1 area, β-gal area or β-gal+ microglia are not changed in 3xDR mice. Data are presented as mean ± SD. N = 9 mice for each group, 60 cells in total. Two-tailed independent t test. (f) Scatter plot showing the correlation between well-known senescence genes and the 3xDR microglial phenotype, indicating that well-defined senescence genes are not correlated with 3xDR microglia. Pearson correlation. (g) 3xDR and control microglia exhibit similar SASP gene signature scores. PLX5622: PLX5622-formulated diet; CD: control diet; Ctrl: control; 3xDR: 3-round depletion-repopulation; FC: fold change; SASP: senescence-associated secretory phenotype; FOV: field of view; AU: arbitrary unit. Source data
Extended Data Fig. 8
Extended Data Fig. 8. 3xDR IBA1+ brain parenchymal cells are microglia instead of BAMs or infiltrating myeloid cells.
(a) Scheme of the 3xDR forced microglial turnover model. (b) Almost all IBA1+ cells are GFP+ microglia in 3xDR TMEM119-GFP and P2Y12-CreER-GFP mice. N = 4 mice for TMEM119-GFP and N = 8 for P2Y12-CreER-GFP mice. Data are presented as mean ± SD. PLX5622: PLX5622-formulated diet; CD: control diet; NxDR: N-round depletion-repopulation. Source data
Extended Data Fig. 9
Extended Data Fig. 9. 3xDR does not increase anxiety level or social deficit.
(a) 3xDR does not influence the body weight of mice. N = 5 mice for each group. Multiple t test. (b) Open field test reveals that the total distance and time spent in the center zone were comparable among young (3-month-old), aged (21-month-old), control and 3xDR mice, indicating that 3xDR does not increase anxiety-like behavior. N = 12, 22, 11 and 11 for young, aged, control and 3xDR mice, respectively. One-way ANOVA. (c) Three-chamber test shows that sniff times in the sociability stage and social novelty stage are not changed in 3xDR mice, indicating that 3xDR does not exhibit the social deficit. N = 8 for control mice and 7 for 3xDR mice. Two-tailed independent t test. Data are presented as mean ± SD. Ctrl: control; 3xDR: 3-round depletion-repopulation. Source data
Extended Data Fig. 10
Extended Data Fig. 10. 3xDR does not influence the adult neurogenesis, neuron number or OPC density.
(a) Quantification of Ki67+ DCX+ cell numbers in microglia in the dentate gyrus. 3xDR does not influence adult neurogenesis in the dentate gyrus. N = 7 and 6 mice for control and 3xDR, respectively. (b) NeuN quantification in CA1. 3xDR does not influence the NeuN thickness of CA1. N = 8 and 7 mice for control and 3xDR, respectively. (c) 3xDR does not influence the OPC density. N = 8 and 7 mice for control and 3xDR, respectively. Data are presented as mean ± SD. Two-tailed independent t test. Ctrl: control; 3xDR: 3-round depletion-repopulation. Source data

Comment in

Similar articles

Cited by

References

    1. Lukens JR, Eyo UB. Microglia and neurodevelopmental disorders. Annu. Rev. Neurosci. 2022;45:425–445. doi: 10.1146/annurev-neuro-110920-023056. - DOI - PMC - PubMed
    1. Borst K, Dumas AA, Prinz M. Microglia: immune and non-immune functions. Immunity. 2021;54:2194–2208. doi: 10.1016/j.immuni.2021.09.014. - DOI - PubMed
    1. Hong S, Dissing-Olesen L, Stevens B. New insights on the role of microglia in synaptic pruning in health and disease. Curr. Opin. Neurobiol. 2016;36:128–134. doi: 10.1016/j.conb.2015.12.004. - DOI - PMC - PubMed
    1. Badimon A, et al. Negative feedback control of neuronal activity by microglia. Nature. 2020;586:417–423. doi: 10.1038/s41586-020-2777-8. - DOI - PMC - PubMed
    1. Ronaldson PT, Davis TP. Regulation of blood-brain barrier integrity by microglia in health and disease: a therapeutic opportunity. J. Cereb. Blood Flow Metab. 2020;40:S6–S24. doi: 10.1177/0271678X20951995. - DOI - PMC - PubMed

Publication types