. 2023 Sep 11;23(1):846.
doi: 10.1186/s12885-023-10896-1.

Integrated profiling identifies CACNG3 as a prognostic biomarker for patients with glioma

Affiliations

Integrated profiling identifies CACNG3 as a prognostic biomarker for patients with glioma

Enfang Shan et al. BMC Cancer. .

Abstract

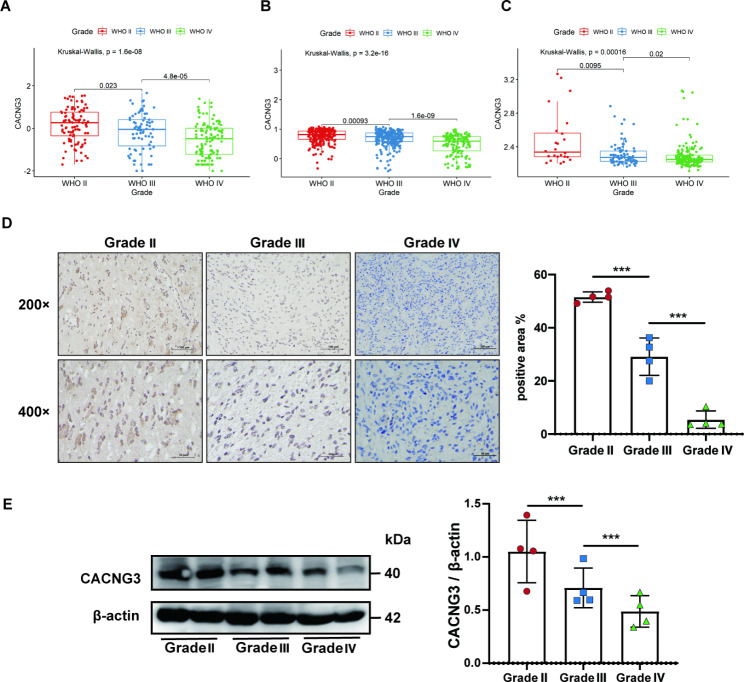
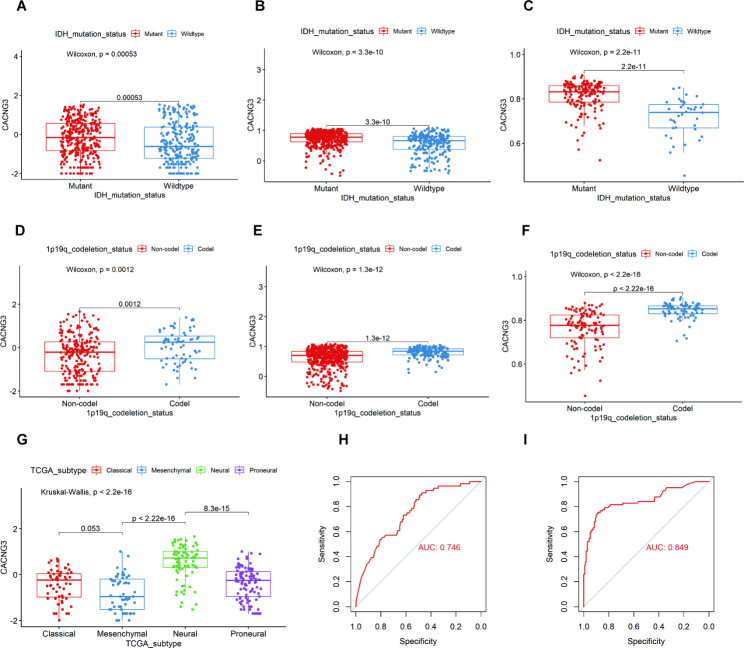
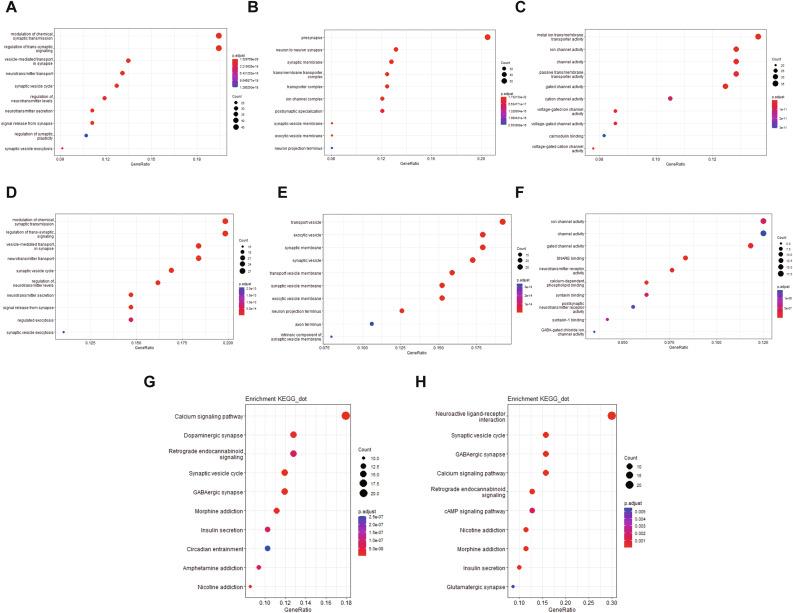
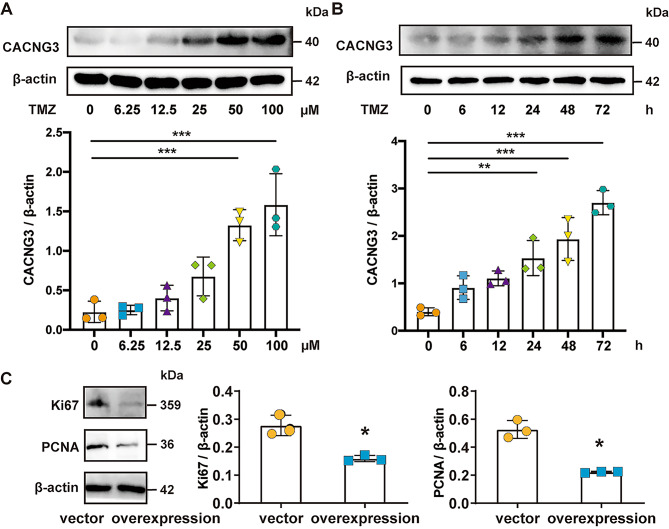
Gliomas are the most common malignant primary brain tumors in adults with poor prognoses. The purpose of this study is to explore CACNG3 as a prognostic factor that is closely related to the progression and survival outcome of gliomas and to provide a potential new molecular target for the diagnosis and treatment of glioma patients. CACNG3 expression and related clinical data were collected from three major databases of The Chinese Glioma Genome Atlas (CGGA), The Cancer Genome Atlas (TCGA), and Gene Expression Omnibus (GEO). The CGGA dataset was used as a training set, and TCGA and GEO datasets obtained from the GEO database were used for validation. CACNG3 was expressed at low levels in the tumor group, and the overall survival (OS) in patients with low CACNG3 expression is shorter. Furthermore, CACNG3 expression was negatively associated with glioma grades, which was confirmed in the IHC results of clinical samples. The expression level of CACNG3 in the IDH1 wide-type group, 1p/19q non-codel group, and mesenchymal subtype group was significantly reduced, and the results showed that CACNG3 could serve as a biomarker for the mesenchymal molecular subtype. In addition, the univariate and multivariate analysis verified the prognostic value of CACNG3 in predicting the OS of gliomas of all grades. The results of functional annotation and pathway enrichment analysis of differently expressed genes(DEGs), showed that CACNG3 might affect the development of glioma by interfering with synaptic transmission. Moreover, temozolomide (TMZ), commonly used in the treatment of glioma, increased CACNG3 expression in a dose and time-dependent manner. Therefore, CACNG3 plays a vital role in the occurrence and development of gliomas and can serve as a potential biomarker for targeted therapy and further investigation in the future.

Keywords: Biomarker; CACNG3; Glioma; Overall survival; Prognostic factor.


Conflict of interest statement

The authors declare that they have no competing interests.

Figures

Fig. 1
Fig. 1
CACNG3 expression correlates with glioma grades. CACNG3 expression decreased in the tumor group, more significantly in the high-grade glioma (HGG) group in CGGA (A, B) and GEO4290 datasets (C, D). Different overall survival of all grade glioma patients between high and low CACNG3 expression group. Kanplan-Meier curves showed patients with high CACNG3 expression had longer OS than those with low CACNG3 expression in CGGA (E) and TCGA (F) datasets
Fig. 2
Fig. 2
CACNG3 has a lower expression level in higher-grade gliomas in CGGA (A), TCGA (B), and GSE 16,011 datasets (C). CACNG3 expression that was investigated by IHC (D) and WB (E) decreased in higher-grade gliomas. The blots were cropped, and the full-length blots are presented in Supplementary Fig. 5 for CACNG3 and Supplementary Fig. 6 for β-actin. *** P < 0.001 compared with the control group
Fig. 3
Fig. 3
CACNG3 serves as a potential biomarker. CACNG3 expression is associated with IDH mutation status and 1p/19q codeletion status. CACNG3 is enriched in the IDH1 mutation group and 1p/19q codel group in CGGA (A, D), TCGA (B, E), and GSE 58,218 (C, F) datasets. Different expression patterns of CACNG3 in four molecular subtypes are defined by the TCGA network. CACNG3 is downregulated in the mesenchymal molecular subtype and significantly upregulated in the neural subtype in CGGA datasets (G). ROC curves of CACNG3 expression to predict mesenchymal and neural subtypes in CGGA datasets (H, I). AUC was calculated and presented
Fig. 4
Fig. 4
Heat map shows the expression level of 330 genes positively related to CACNG3 expression and clinical information ordered by CACNG3 expression in CGGA datasets
Fig. 5
Fig. 5
Gene Ontoly (GO) and KEGG (www.kegg.jp/kegg/kegg1.html) pathway enrichment analysis of coexpression genes. The top 10 GO terms in biological process (BP) (A), cellular component (CC) (B), molecular function (MF) (C), and KEGG (www.kegg.jp/kegg/kegg1.html) pathway enrichment analysis results (D) based on the CGGA datasets were presented in dot plots, respectively. TCGA database GO enrichment analysis results BP (E), CC (F), MF (G), KEGG (www.kegg.jp/kegg/kegg1.html) pathway analysis results (H). Counts: number of genes in a gene cluster enriched in this GO term or KEGG pathway. p.adjust: adjusted p-value of this enrichment result
Fig. 6
Fig. 6
Volcano plot and heat map generated to show the different expression levels of DEGs in high and low CACNG3 expression groups in CGGA datasets. Screening thresholds were set as adj.p.value below 0.05 and log2 fold-change above 1.2. Up-regulated DEGs in the high CACNG3 expression group were presented as red spots and down-regulated DEGs were presented as green spots in the volcano plot (A). The heat map presented the top 30 up- and top 30 down-regulated DEGs (B)
Fig. 7
Fig. 7
PPI network between CACNG3 and DEGs was constructed, and a biological analysis of the down-regulated DEGs and main gene cluster in the network was conducted. The PPI network was processed with Cytoscape v.3.7.2, of which up-regulated DEGs were colored purple and down-regulated DEGs colored green (A). The main gene cluster was analyzed by MCODE (B). GO terms in BP (C) and KEGG (www.kegg.jp/kegg/kegg1.html) pathway analysis results (D) of down-regulated DEGs in the network were presented in dot plots. The main gene cluster in GO enrichment analysis results BP (E), CC (F), MF (G), and KEGG (www.kegg.jp/kegg/kegg1.html) pathway enrichment analysis results (H)
Fig. 8
Fig. 8
Expression of CACNG3 in U251. (A) Western blot was used to detect the expression of CACNG3 in U251 cells treated with TMZ at concentrations of 0, 6.25, 12.5, 25, 50, and 100 µM for 24 h. The blots were cropped, and the full-length blots are presented in Supplementary Fig. 1 for CACNG3 and Supplementary Fig. 2 for β-actin. (B) Western blot was used to detect the expression of CACNG3 in U251 cells after TMZ treatment at 0, 6, 12, 24, 48, and 72 h at 100 µM concentration. The blots were cropped, and the full-length blots are presented in Supplementary Fig. 3 for CACNG3 and Supplementary Fig. 4 for β-actin. (C) CACNG3 overexpression inhibited Ki67 and PCNA expression. The blots were cropped, and the full-length blots are presented in Supplementary Fig. 7 for Ki67, Supplementary Fig. 8 for PCNA, and Supplementary Fig. 9 for β-actin. The bars showed the means ± SD of three independent experiments. * P < 0.05, ** P < 0.01 and *** P < 0.001 compared with control group

Similar articles

Cited by

References

    1. Ostrom QT et al. CBTRUS Statistical Report: Primary brain and other central nervous system tumors diagnosed in the United States in 2010–2014. Neurooncology, 2017. 19(suppl_5). - PMC - PubMed
    1. Lapointe S, Perry A, Butowski NA. Primary brain tumours in adults. Lancet (London England) 2018;392(10145):432–46. doi: 10.1016/S0140-6736(18)30990-5. - DOI - PubMed
    1. McNeill KA. Epidemiology of brain tumors. Neurol Clin. 2016;34(4):981–98. doi: 10.1016/j.ncl.2016.06.014. - DOI - PubMed
    1. Jiang T, et al. Clinical practice guidelines for the management of adult diffuse gliomas. Cancer Lett. 2021;499:60–72. doi: 10.1016/j.canlet.2020.10.050. - DOI - PubMed
    1. Molinaro AM, et al. Genetic and molecular epidemiology of adult diffuse glioma. Nat Reviews Neurol. 2019;15(7):405–17. doi: 10.1038/s41582-019-0220-2. - DOI - PMC - PubMed