. 2023 Sep 12;21(1):190.
doi: 10.1186/s12915-023-01685-0.

Quantitative determination of fluorescence labeling implemented in cell cultures

Affiliations

Quantitative determination of fluorescence labeling implemented in cell cultures

Chiara Schirripa Spagnolo et al. BMC Biol. .

Abstract

Background: Labeling efficiency is a crucial parameter in fluorescence applications, especially when studying biomolecular interactions. Current approaches for estimating the yield of fluorescent labeling have critical drawbacks that usually lead them to be inaccurate or not quantitative.

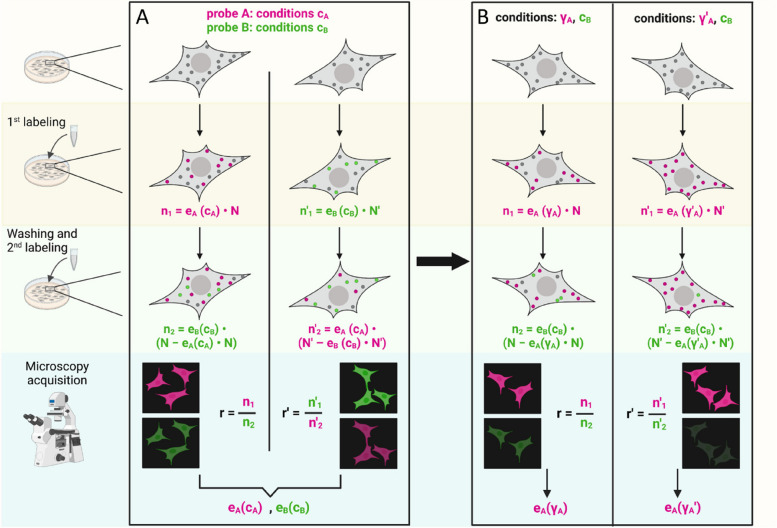
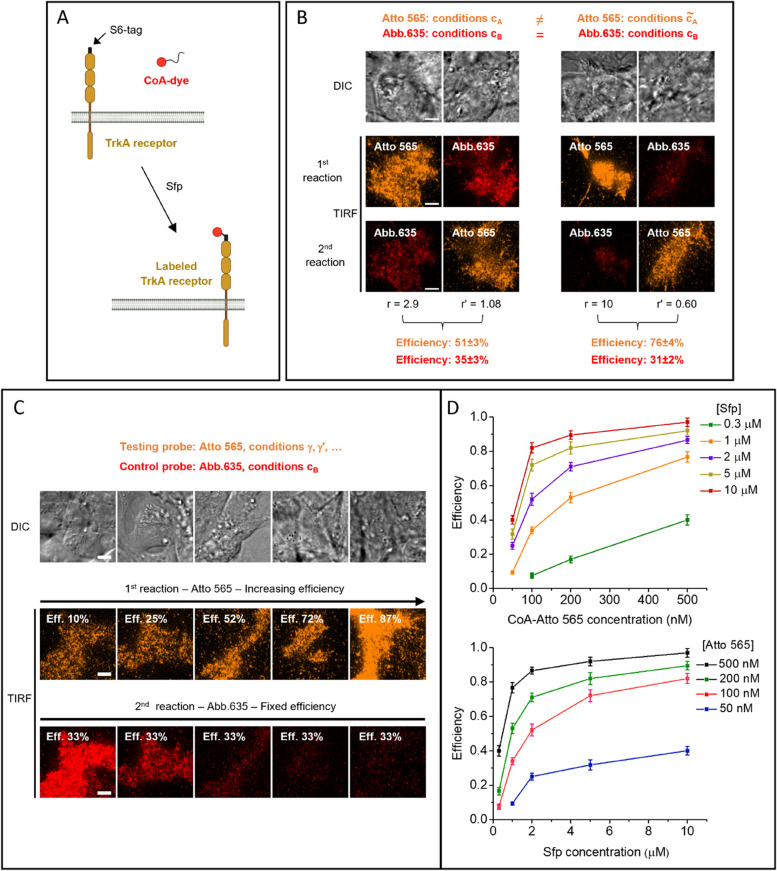
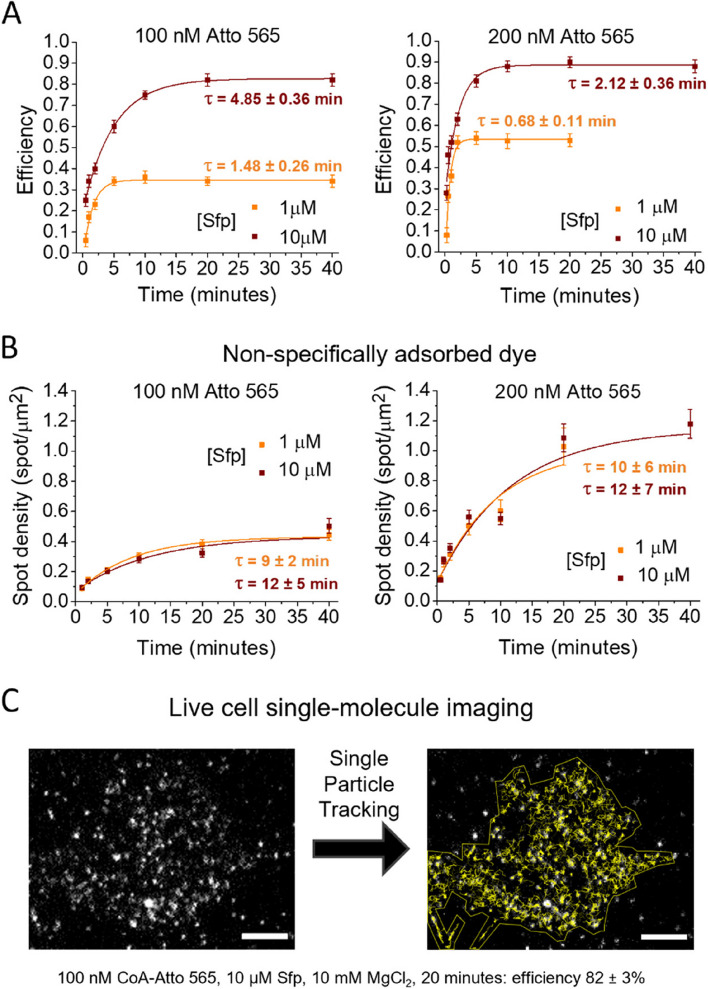
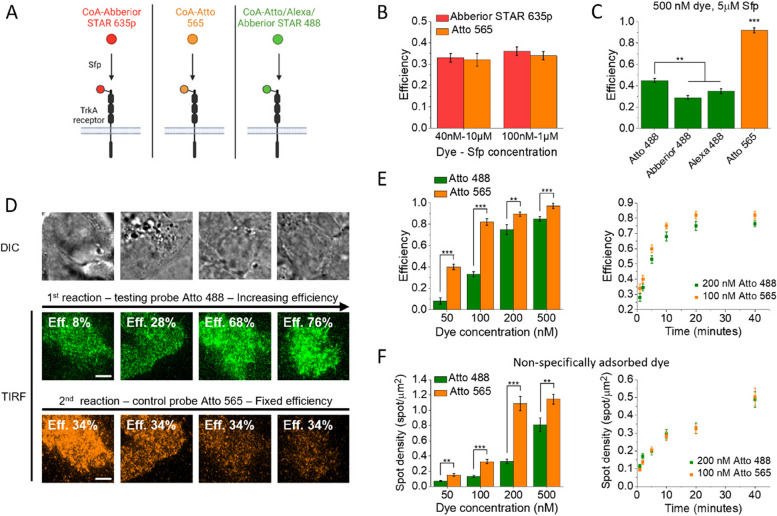
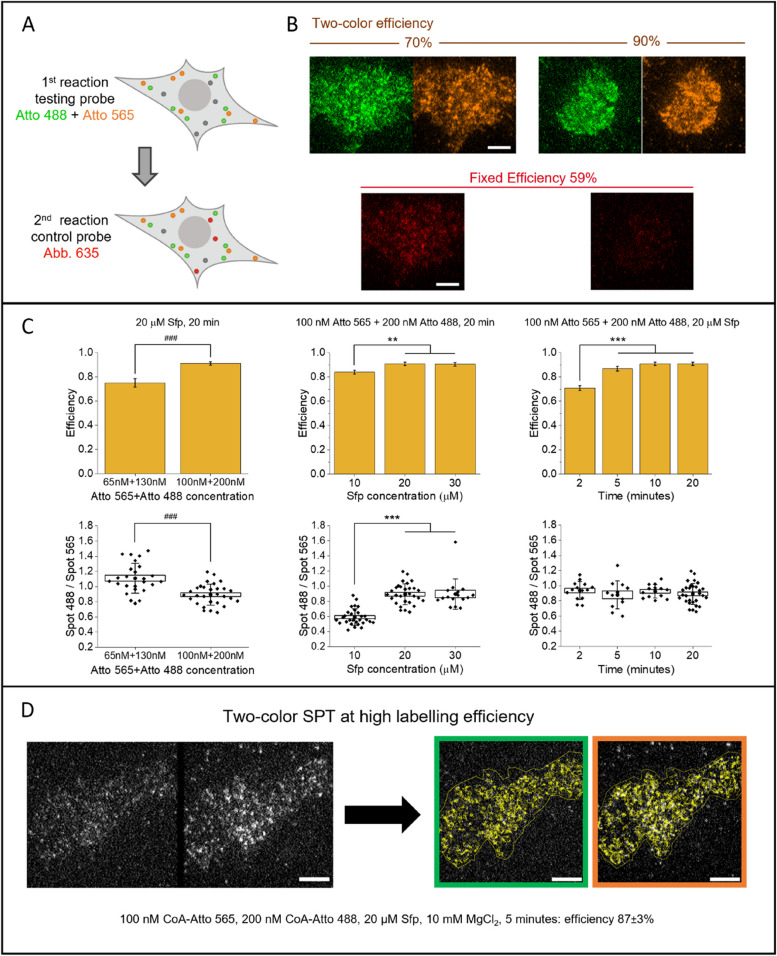
Results: We present a method to quantify fluorescent-labeling efficiency that addresses the critical issues marring existing approaches. The method operates in the same conditions of the target experiments by exploiting a ratiometric evaluation with two fluorophores used in sequential reactions. We show the ability of the protocol to extract reliable quantification for different fluorescent probes, reagents concentrations, and reaction timing and to optimize labeling performance. As paradigm, we consider the labeling of the membrane-receptor TrkA through 4'-phosphopantetheinyl transferase Sfp in living cells, visualizing the results by TIRF microscopy. This investigation allows us to find conditions for demanding single and multi-color single-molecule studies requiring high degrees of labeling.

Conclusions: The developed method allows the quantitative determination and the optimization of staining efficiency in any labeling strategy based on stable reactions.

Keywords: Fluorescence microscopy; Fluorescent labeling; Membrane receptors; Sfp phosphopantetheinyl transferase; Single-molecule imaging; Single-particle tracking.


Conflict of interest statement

The authors declare no competing interests.

Figures

Fig. 1
Fig. 1
Method workflow. Left, outside boxes: depiction of the steps needed in the experiments. In panels A and B, each of the four columns represent a different experiment; grey circles in cells represent unlabeled molecules, which initially are N('); magenta and green circles are molecules labeled with either of two different dyes (n(')1 or n(')2 in number, where subscript 1 or 2 indicates respectively the first or second labeling reaction). On the bottom, the two microscopy detection channels (in green and magenta) are schematically represented for a single field of view for each experiment to visualize the same cells labeled with both the two dyes at the end of the whole labeling procedure. Box A: method to be used when no labeling efficiency information is available; both experiments must be performed, inverting the order of labeling while keeping constant the reaction conditions cA and cB for the magenta and the green probe respectively. From the ratios of the labeled molecules r and r' in the two cases, it is possible to extract the labeling efficiencies eA(cA) and eB(cB) for the two probes in the used conditions (see main text and Eqs. (1) and (2)). Box B: method to measure eA in varying conditions (e.g., γA, γA') of the “magenta” dye, keeping constant the conditions cB for the “green” one used as control with known efficiency eB(cB). Molecules are labeled sequentially with the test and the control probe and the ratio between the number of molecules labeled with the two dyes is evaluated. Each experiment yields the labeling efficiency eAA), eAA') for the tested probe in the used condition (Eq. (3)). Created with BioRender.com
Fig. 2
Fig. 2
Application of the method to TrkA receptors labeled through Sfp. A Scheme for Sfp-based labeling applied on S6-tagged TrkA receptors expressed on living cell membranes. B Determination of labeling efficiency, performed as described in Fig. 1A, for Abberior STAR 635p (Abb.635, red channel) in conditions cB, while using two different conditions (cA on the left and cA~ on the right) for reactions with the other probe (Atto 565, orange channel). Each image column shows a single representative cell: DIC image (top) and TIRF images of the channel of the dye used in the first (middle) and second (bottom) labeling reaction. Conditions for Atto 565 were as follows: 100 nM CoA-dye, 2 µM Sfp, and 20 min reaction time (left) and 100 nM CoA-dye, 10 µM Sfp, and 10 min (right); conditions for Abb.635 were in both cases 40 nM CoA-dye, 10 µM Sfp, 20 min. r and r’ are the ratios between the number of molecules labeled in the two channels. Reported efficiency results are mean ± SEM estimate (see the “Methods” section), obtained from 17, 20, 25, and 16 cells analyzed for experiments represented in each image column. The results obtained for Abb.635 efficiency are not significantly different, and the efficiency estimated averaging the two results is 32.7 ± 1.7%. C Examples of experimental images corresponding to the workflow steps depicted in Fig. 1B, for some of the analyzed conditions reported in D. Each image column shows a single cell: DIC image (top); TIRF channel of the tested probe Atto 565 (middle, orange), TIRF image of the control probe Abb.635 (bottom, red). Eff.: efficiency estimated (for Atto 565 in varying conditions) or previously measured (for Abb.635 in fixed conditions). D Fluorescent labeling efficiency obtained for Atto 565 at various concentrations of CoA-dye ([Atto 565]) and Sfp ([Sfp]), after 20 min of reaction and in presence of 10 mM of MgCl2 (dots: mean, error bars: SEM estimates; 15–40 cells from 2 independent replicates analyzed for each condition). Scale bar: 5 μm. See also Additional file 1: Tables S1 and S2
Fig. 3
Fig. 3
Non-specific adhesion of CoA-dye to cells and glass in the labeling reaction. A Left: representative TIRF images of cells incubated with a reaction mix including different CoA-Atto 565 concentrations (20-min reactions, 5 μM Sfp). Each field of view shows a single transfected labeled cell surrounded by dyes non-specifically adsorbed to glass or other non-transfected cells (see the “Methods” section). Scale bar: 5 μm. Right: quantification of spot density for non-specifically adsorbed dyes using different CoA-Atto 565 concentrations in the reaction, at 1 and 5 μM of Sfp (mean ± SEM from 12–38 fields of view analyzed in two independent replicates). Spot density is measured after 20 min of reaction and extensive sample washing (see the “Methods” section). B Non-specific dye adhesion varying Sfp concentration, at different fixed CoA-Atto 565 concentrations (box: mean ± SEM, whiskers: standard deviation, empty circles: averages, horizontal lines: medians, diamonds: individual data from two independent replicates). ***P < 0.001, **P < 0.01, 1-way ANOVA, Bonferroni multiple comparisons; no significant difference if nothing is shown
Fig. 4
Fig. 4
Labeling efficiency and nonspecific adhesion as functions of time. Conditions for single-molecule imaging at high labeling efficiency. A Labeling efficiency as a function of time measured at 1 (orange) and 10 (Bordeaux) µM of Sfp at CoA-Atto 565 concentration of 100 nM (left) and 200 nM (right). B Density of spots non-specifically adsorbed to cells and glass as a function of time measured in the same conditions of A. Dots are means, error bars are SEM estimates, and continuous lines are mono-exponential fitting curves (with obtained lifetime τ in minutes). Fifteen to 30 cells from 2 independent replicates were analyzed for each condition. C Single-molecule imaging in live cells and application of single-particle tracking analysis at found optimal labeling conditions (100 nM CoA-Atto 565, 10 µM Sfp, 10 mM MgCl2, 20 min: efficiency 82 ± 3%). A representative cell is shown. Gray scale: TIRF images; left: first frame of the acquired 100-frame movie; right: in yellow, tracks obtained from a single-particle tracking analysis on frames 1–50, superimposed on the 50th frame (see also Additional file 2: Video S1, Additional file 3: Video S2). Scale bars: 5 μm
Fig. 5
Fig. 5
Comparison of different fluorescent dyes in the labeling reaction. A Sketch of labeling with different fluorescent dyes, emitting in wavelength bands represented by the used colors. Created with BioRender.com. B Labeling efficiency of Atto 565 and Abberior STAR 635p at two different couples of dyes-Sfp concentrations (reaction time: 20 min). C Efficiency for Atto 565 compared with Atto 488, Alexa 488, and Abberior STAR 488 for 20-min reactions in fixed reaction conditions. ***P < 0.001, **P < 0.01, 1-way ANOVA, Bonferroni multiple comparisons. D Experiments for measurement of Atto 488 efficiency in variable conditions. The first labeling is performed with the test probe Atto 488, the second labeling is performed with the control probe Atto 565, the latter in conditions of known efficiency. Each image column shows a single cell: DIC image (top), TIRF image of Atto 488 channel (middle, green), TIRF image of Atto 565 channel (bottom, orange). Eff.: estimated efficiency. Scale bar: 5 μm. E Efficiency comparison between Atto 488 and Atto 565. Left: comparison at different dye concentrations ([Sfp]: 10 µM, time: 20 min). ***P < 0.001, **P < 0.01, Welch test. Right: comparison at different reaction times at the indicated dyes concentrations ([Sfp]: 10 µM). F Comparison of non-specifically adsorbed spot density for Atto 488 and Atto 565, using the same conditions as in E. Results on Atto 565, already shown in previous Figs. 2, 3, and 4, are here reported for direct comparison. ***P < 0.001, **P < 0.01, Welch test. In B, C, E, and F, data are mean ± SEM and are obtained from 13 to 30 analyzed cells from two independent replicates
Fig. 6
Fig. 6
Conditions for simultaneous two-color labeling. A Sketch of the experiment for efficiency measurement in simultaneous two-color labeling. The test probe is a mix of Atto 565 and Atto 488; the control probe is Abberior STAR 635p. Created with BioRender.com. B Experimental TIRF images acquired after the two labeling reactions. For each of the two representative shown cells, we reported at the top the Atto 488 (green) and Atto 565 (orange) channels, with estimated total efficiency for the two-color labeling; at the bottom the Abberior STAR 635p channel (red); scale bar: 5 μm. C Results in different reaction conditions as described above the graphs for each column; top: measurement of two-color labeling efficiency (mean ± SEM), bottom: ratio between the number of molecules labeled with Atto 488 and with Atto 565 (box: mean ± SEM, whiskers: standard deviation, dots: averages, diamonds: individual data from two independent repetitions). ***P < 0.001, **P < 0.01, 1-way ANOVA, Bonferroni multiple comparisons. ###P < 0.001, Welch test. D Example of simultaneous two-color single-molecule imaging and single-particle tracking analysis at high labeling efficiency in the optimized conditions. Left: first TIRF image of the acquired movie where the same cell is simultaneously detected in the Atto 488 channel (left) and the Atto 565 channel (right). Right: superimposed yellow tracks as obtained with single-particle tracking after splitting and analyzing each channel (shown is the 50th frame with tracks reconstructed until that frame from a 100-frame movie; see also Additional file 4: Video S3, Additional file 5: Video S4, Additional file 6: Video S5). Scale bars: 5 μm

References

    1. Sanderson MJ, Smith I, Parker I, Bootman MD. Fluorescence microscopy. Cold Spring Harb Protoc. 2014;2014:1042–1065. doi: 10.1101/pdb.top071795. - DOI - PMC - PubMed
    1. Zhao ZW, White MD, Bissiere S, Levi V, Plachta N. Quantitative imaging of mammalian transcriptional dynamics: from single cells to whole embryos. BMC Biol. 2016;14(1):115. doi: 10.1186/s12915-016-0331-9. - DOI - PMC - PubMed
    1. Ray S, Widom JR, Walter NG. Life under the microscope: single-molecule fluorescence highlights the RNA world. Chem Rev. 2018;118:4120–4155. doi: 10.1021/acs.chemrev.7b00519. - DOI - PMC - PubMed
    1. Reina F, Eggeling C, Lagerholm BC. Single particle tracking on cells reveals new insights into membrane compartmentalization and lipid dynamics. Biophys J. 2022;121:302a. doi: 10.1016/j.bpj.2021.11.1248. - DOI
    1. Calebiro D, Grimes J. G protein–coupled receptor pharmacology at the single-molecule level. Annu Rev Pharmacol Toxicol. 2020;60:73–87. doi: 10.1146/annurev-pharmtox-010919-023348. - DOI - PubMed

Publication types

Substances