. 2023 Sep 11;16(1):210.
doi: 10.1186/s13104-023-06497-7.

Correlation of SARS-CoV-2 RNA and nucleocapsid concentrations in samples used in INSTAND external quality assessment schemes

Affiliations

Correlation of SARS-CoV-2 RNA and nucleocapsid concentrations in samples used in INSTAND external quality assessment schemes

Esmeralda Valiente et al. BMC Res Notes. .

Abstract

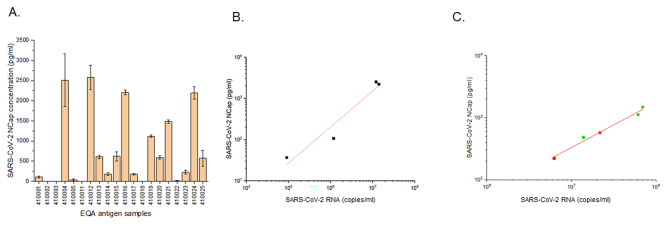
Objective: In routine clinical laboratories, severe acute respiratory syndrome coronavirus (SARS-CoV-2) infection is determined by reverse-transcription PCR (RT-PCR). In the COVID pandemic, a wide range of antigen detection tests were also in high demand. We investigated the correlation between SARS-CoV-2 NCap antigen and N gene concentration by analyzing samples from several INSTAND external quality assessment (EQA) schemes starting in March 2021. The absolute N gene concentration was measured using reverse transcriptase digital PCR (RT-dPCR) as reference value. Moreover, the performance of five commercial ELISA tests using an EQA inactivated SARS-CoV-2 sample at different concentrations was assessed on the basis of these reference values.

Results: Quantitative ELISA and RT-dPCR results showed a good correlation between SARS-CoV-2 NCap antigen and RNA concentration, but this correlation varies among SARS-CoV-2 isolates. A direct correlation between SARS-CoV-2 NCap antigen concentration and genome concentration should not be generally assumed.

Conclusion: Further correlation studies between SARS-CoV-2 RNA and NCap antigen concentrations are needed, particularly in clinical samples and for emerging SARS-CoV-2 variants, to support the monitoring and improvement of antigen testing.

Keywords: ELISA; Nucleocapsid (NCap) antigen; Quantification; RNA; RT-dPCR; SARS-CoV-2.


Conflict of interest statement

Prof. Heinz Zeichhardt declares that he is majority owner and managing director of GBD Gesellschaft fuer Biotechnologische Diagnostik mbH, Berlin, and owner and managing director of IQVD GmbH - Institut fuer Qualitaetssicherung, Berlin. All other authors declared no competing interests.

Figures

Fig. 1
Fig. 1
Dilution linearity comparison of the nucleocapsid concentration of the three quantitative commercial ELISA kits (Abcam, ab274341; ProteinTech, KE30007; GeneTex, GTX535824) using serial dilutions (2x, 4x, 8x,16x and 32x) of EQA SARS-CoV-2 sample (ID 410,004, Table 1). Mean optical density (OD) values were obtained according to the kit’s specifications and the measurements were obtained using a BioTek Synergy H4 plate reader (Biotek GmbH). Linear regression analysis was performed using Gen5 analysis software. The LOD and LOQ of the different kits were 79 pg/ml and 130 pg/ml, respectively, for the Abcam assay, and 90 pg/ml and 172 pg/ml for the Proteintech assay. For the GeneTex assay, LOD was > 200 pg/mL, so the LOQ was not calculated in more detail. The Roche-Elecsys and EU SARS-CoV-2 antigen tests had a good correlation (R2 = 1) (data not shown)
Fig. 2
Fig. 2
A. SARS-CoV-2 nucleocapsid quantification of EQA samples from Table 1 (mean ± SD); B. Correlation analysis of nucleocapsid with RNA concentration using different dilutions of SARS-CoV-2 Non-VOC, BetaCoV/Munich/ChVir984/2020_IsolatBER (ID. 410,001 410,004, 410,005 and 410,024 (black dots), R2 = 0.93. Intercept: -2.94 ± 1.04 (pg/ml); Slope: 0.87 ± 0.16 (pg/copies); C. Correlation of nucleocapsid with RNA concentration using different dilutions of two VOC SARS-CoV-2 variants: SARS-CoV-2 Delta VOC, B.1.617.2, hCoV-19/Germany/SH-CHVir25702_4/2021 (EQA 410,015, 410,019 and 410,021) (green dots) and Omicron VOC, hCoV-19/Germany/SH-ChVir26373/2021, Accession ID: EPI_ISL_7495250 (EQA410023 and 410,025) (red dots). R2 = 0.98. Intercept: -2.56 ± 0.43 (pg/ml); Slope: 0.73 ± 0.06 (pg/copies). NOTE: Fig. 2B and C have different scales in the “x“ axis

References

    1. Zhu N, Zhang W, Wang W, Li X, Yang B, Song J, et al. China Novel Coronavirus investigating and Research Team. A novel coronavirus from patients with Pneumonia in China, 2019. N Engl J Med. 2020;382(8):727–33. doi: 10.1056/NEJMoa2001017. - DOI - PMC - PubMed
    1. Abubakar L, Salerncity AJ, Abass OK, Olajuyin AM. The impacts of COVID-19 on environmental sustainability: a brief study in world context. Bioresource Tech Reports. 2021;15:100713. doi: 10.1016/j.biteb.2021.100713. - DOI - PMC - PubMed
    1. Zheng JX, Lv S, Tian LG, Guo ZY, Zheng PY, Chen YL, et al. The rapid and efficient strategy for SARS-CoV-2 Omicron transmission control: analysis of outbreaks at the city level. Infect Dis Poverty. 2022;11(1):114. doi: 10.1186/s40249-022-01043-2. - DOI - PMC - PubMed
    1. Kevadiya BD, Machhi J, Herskovitz J, Oleynikov MD, Blomberg WR, Bajwa N, et al. Diagnostics for SARS-CoV-2 infections. Nat Mater. 2021;20(5):593–605. doi: 10.1038/s41563-020-00906-z. - DOI - PMC - PubMed
    1. WHO, Antigen-detection in the diagnosis of SARS-CoV-2 infection using rapid immunoassays, Interim guidance., 2020. https://www.who.int/publications/i/item/antigen-detection-in-the-diagnos.... Aaccessed 26 March 2021.

Supplementary concepts