. 2023 Sep 11;42(1):238.
doi: 10.1186/s13046-023-02814-x.

Combination of RUNX1 inhibitor and gemcitabine mitigates chemo-resistance in pancreatic ductal adenocarcinoma by modulating BiP/PERK/eIF2α-axis-mediated endoplasmic reticulum stress

Affiliations

Combination of RUNX1 inhibitor and gemcitabine mitigates chemo-resistance in pancreatic ductal adenocarcinoma by modulating BiP/PERK/eIF2α-axis-mediated endoplasmic reticulum stress

Chunhua She et al. J Exp Clin Cancer Res. .

Abstract

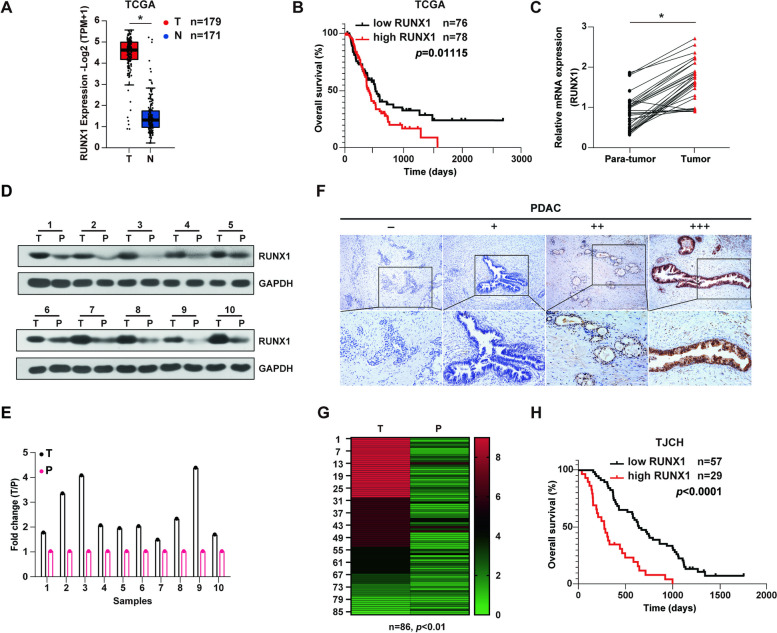
Background: Gemcitabine (GEM)-based chemotherapy is the first-line option for pancreatic ductal adenocarcinoma (PDAC). However, the development of drug resistance limits its efficacy, and the specific mechanisms remain largely unknown. RUNX1, a key transcription factor in hematopoiesis, also involved in the malignant progression of PDAC, but was unclear in the chemoresistance of PDAC.

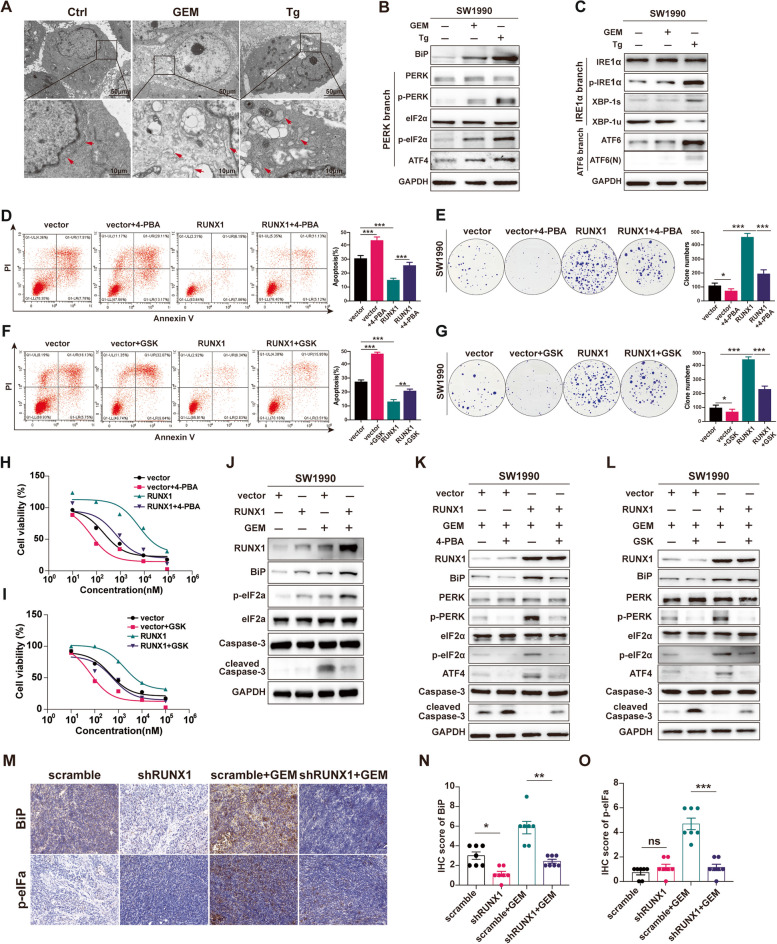
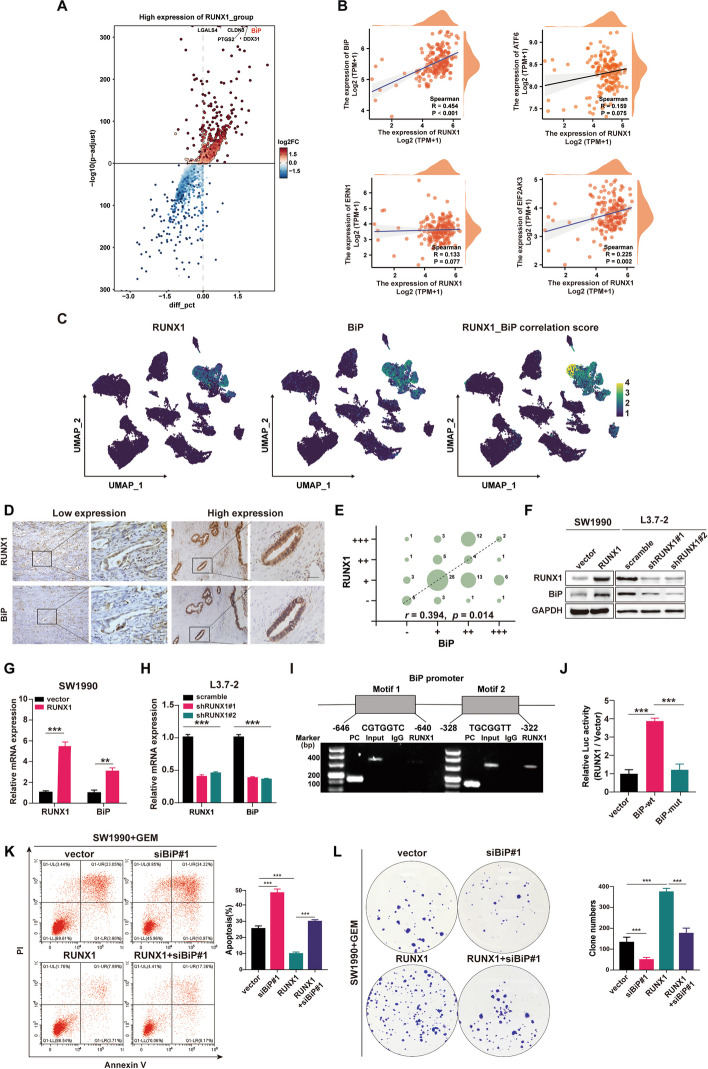
Methods: Comparative analysis was performed to screen GEM-resistance related genes using our single-cell RNA sequencing(scRNA-seq) data and two public RNA-sequencing datasets (GSE223463, GSE183795) for PDAC. The expression of RUNX1 in PDAC tissues was detected by qRT-PCR, immunohistochemistry (IHC) and western blot. The clinical significance of RUNX1 in PDAC was determined by single-or multivariate analysis and survival analysis. We constructed the stably expressing cell lines with shRUNX1 and RUNX1, and successfully established GEM-resistant cell line. The role of RUNX1 in GEM resistance was determined by CCK8 assay, plate colony formation assay and apoptosis analysis in vitro and in vivo. To explore the mechanism, we performed bioinformatic analysis using the scRNA-seq data to screen for the endoplasm reticulum (ER) stress signaling that was indispensable for RUNX1 in GEM resistance. We observed the cell morphology in ER stress by transmission electron microscopy and validated RUNX1 in gemcitabine resistance depended on the BiP/PERK/eIF2α pathway by in vitro and in vivo oncogenic experiments, using ER stress inhibitor(4-PBA) and PERK inhibitor (GSK2606414). The correlation between RUNX1 and BiP expression was assessed using the scRNA-seq data and TCGA dataset, and validated by RT-PCR, immunostaining and western blot. The mechanism of RUNX1 regulation of BiP was confirmed by ChIP-PCR and dual luciferase assay. Finally, the effect of RUNX1 inhibitor on PDAC was conducted in vivo mouse models, including subcutaneous xenograft and patient-derived xenograft (PDX) mouse models.

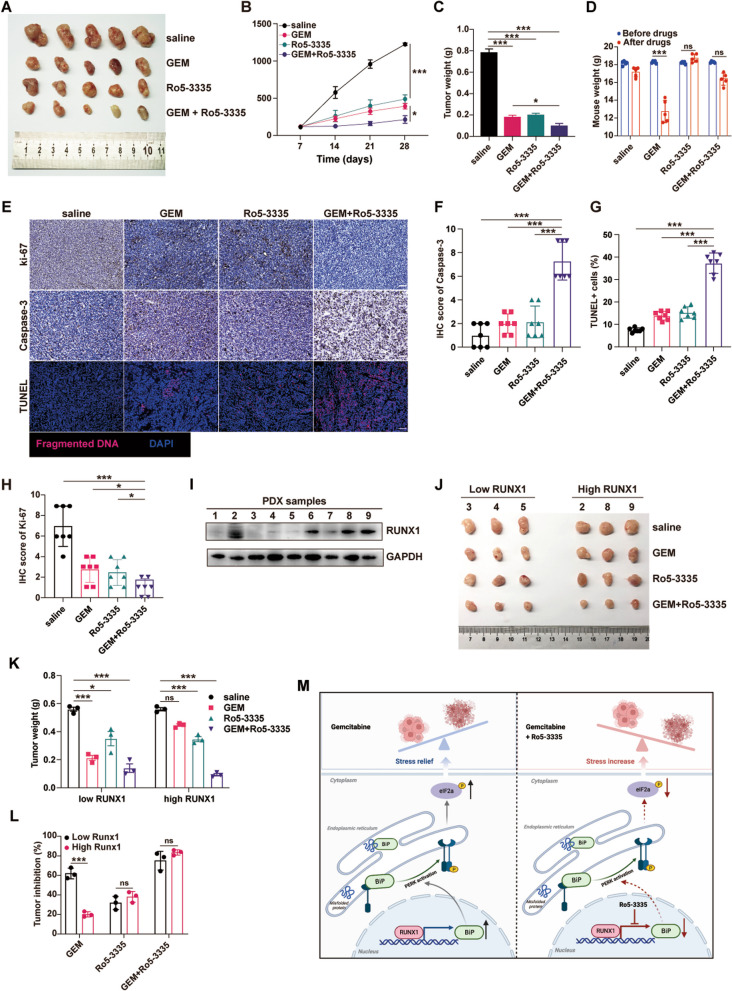
Results: RUNX1 was aberrant high expressed in PDAC and closely associated with GEM resistance. Silencing of RUNX1 could attenuate resistance in GEM-resistant cell line, and its inhibitor Ro5-3335 displayed an enhanced effect in inhibiting tumor growth, combined with GEM treatment, in PDX mouse models and GEM-resistant xenografts. In detail, forced expression of RUNX1 in PDAC cells suppressed apoptosis induced by GEM exposure, which was reversed by the ER stress inhibitor 4-PBA and PERK phosphorylation inhibitor GSK2606414. RUNX1 modulation of ER stress signaling mediated GEM resistance was supported by the analysis of scRNA-seq data. Consistently, silencing of RUNX1 strongly inhibited the GEM-induced activation of BiP and PERK/eIF2α signaling, one of the major pathways involved in ER stress. It was identified that RUNX1 directly bound to the promoter region of BiP, a primary ER stress sensor, and stimulated BiP expression to enhance the reserve capacity for cell adaptation, which in turn facilitated GEM resistance in PDAC cells.

Conclusions: This study identifies RUNX1 as a predictive biomarker for response to GEM-based chemotherapy. RUNX1 inhibition may represent an effective strategy for overcoming GEM resistance in PDAC cells.

Keywords: BiP; ER stress; Gemcitabine resistance; PDAC; RUNX1.


Conflict of interest statement

The authors have declared no potential conflicts of interest.

Figures

Fig. 1
Fig. 1
Aberrant RUNX1 expression in pancreatic adenocarcinoma correlates with disease progression. A mRNA expression analysis of RUNX1 in PDAC(T) tissues and normal pancreatic tissues(N) based on the TCGA dataset. B Survival analysis of PDAC patients with low and high RUNX1 expression based on the TCGA dataset. C mRNA expression of RUNX1 in PDAC tissues and matching para-tumor tissues by qRT-PCR assay. D-E RUNX1 expression in PDAC and matching para-tumor tissues by western blot (D), and the column diagram of RUNX1 expression generated by the grey value measured using Image J software (E). F Representative IHC images showing RUNX1 expression (-, + , +  + , +  + +) in PDAC tissues. Scale bar of the above, 100 µm; Scale bar of the below, 200 µm. G The comparative heatmap showing RUNX1 expression in 86 cases of PDAC tissues and matching para-tumor tissues ranging from green (low expression) to red (high expression). The column clustering generated by the IHC scores of the RUNX1 staining. H Survival analysis of PDAC patients with low and high RUNX1 expression based on the dataset of Tianjin Cancer Hospital (TJCH). Student's t-test were used in the column diagram; *, p < 0.05
Fig. 2
Fig. 2
RUNX1 in vitro facilitates the gemcitabine resistance in PDAC. A Venn diagram showing the top 5 gemcitabine-resistance related genes. The diagram was generated by the overlap of differential expression genes from scRNA-seq data (HRA000433) and GEO datasets (GSE223463, GSE183795). B-C mRNA expression of RUNX1 in gemcitabine-treated all-stage (B) and Stage II (C) PDAC patients with complete relief (CR) or clinical progressive disease (PD). D IC50 value of gemcitabine in BxPC3 and BxPC3-GR cell lines by the cell counting kit-8 assay. E The mRNA expression of RUNX1 in BxPC3 and BxPC3-GR cell lines as determined by qRT-PCR. F Immunoblot of RUNX1 in BxPC3 and BxPC3-GR cell lines. G IC50 value of gemcitabine in BxPC3-GR cells transfected with siRNA targeting RUNX1 (siRUNX1#1, siRUNX1#2) by the cell counting kit-8 assay. H Apoptosis of BxPC3-GR cells transfected with siRUNX1#1 was assessed by flow cytometry after gemcitabine treatment. The column diagram represents the average cell apoptosis rates of BxPC3-GR cells transfected with siRUNX1 under gemcitabine treatment compared with the control (NC). I-J Clonogenic assay of BxPC3-GR cells transfected with siRUNX1#1, seeded at 1000cells/ well, then treated with gemcitabine (200 nM). Colonies were stained with crystal violet (0.5%) after 14 days and counted using ImageJ software. K-L Cell viability of L3.7–2-shRUNX1 (#1,#2) cell line or SW1990-RUNX1 cells treated with different concentration of gemcitabine for 72 h, compared with the control (scramble or vector). IC50 values were calculated and shown in the Figure. M Cell apoptosis of L3.7–2 cells with shRUNX1#1 or SW1990 cells with RUNX1 overexpression (SW1990-RUNX1) by flowcytometry, under gemcitabine treatment (2 µM, 48 h). The average cell apoptosis rate of each group was shown in the column diagram. N Clonogenic assay of L3.7–2-shRUNX1#1 or SW1990-RUNX1 cells seeded at 1000 cells/well, under gemcitabine treatment (200 nM). Colonies were stained with crystal violet (0.5%) after 14 days and counted using the ImageJ software. Student’s t-test was used in the column diagram; *, p < 0.05; **, p < 0.01; ***, p < 0.001; ns, no significance
Fig. 3
Fig. 3
RUNX1 impedes the gemcitabine response to PDAC in vivo. A Diagram of a mouse xenograft treated with gemcitabine. B-C Images of the tumor tissues and the tumor growth curve of the shRUNX1 group compared to the control (scrambled) under gemcitabine treatment. D Comparison of tumor weights of the shRUNX1 group compared to the control (scramble), with or without gemcitabine treatment. E Representative images of Ki-67, Caspase3 staining and TUNEL staining of the tumor tissues of the scrambled and shRUNX1 groups with or without gemcitabine treatment. FH Analysis of Ki-67, Caspase3 staining, and the average number of apoptotic cells in the scrambled and shRUNX1 groups, with or without gemcitabine treatment, are displayed. I Representative images of enhanced abdominal computed tomography (CT) scans of PDAC patients (#1, #2) before and after two cycles of gemcitabine-based chemotherapy. The orange arrow indicates the lesion. Representative IHC images of RUNX1 staining in patients #1 and #2 are shown on the right. The violin plots showing the RUNX1 expression in response group (including stable or decreased tumor) and no-response group (progressed disease). Student’s t-test was used in the column diagram; scale bar, 100 µm. *, p < 0.05; **, p < 0.01; ***, p < 0.001; ns, no significance
Fig. 4
Fig. 4
RUNX1 is associated with ER stress pathway in PDAC at the single-cell level. A GO Enrichment analysis (biological process) of RUNX1 based on TCGA dataset. The color ranges from red (strong significance) to yellow (weak significance). B Correlation analysis of RUNX1 and ER stress signatures based on public datasets (TCGA, GSE62452, GSE78229, GSE28735). C Differential gene expression analysis between high and low RUNX1-expressing malignant ductal epithelial cells. Gene Set Enrichment Analysis (GSEA) was performed with adjusted p value < 0.05 and FDR < 0.25 considered significant. D Single-cell RNA sequencing (scRNA-seq) analysis of 14 PDAC samples. The cells were sorted by EPCAM+ and clustered using the R software Seurat, with patient ID as the marker. E Feature plot analysis of KRT19, FXYD3, and MUC1 expression in ductal and malignant epithelial cells isolated from 14 PDAC tissue samples. Higher expression levels are indicated by brighter green shading. RUNX1 and the core molecules of the ER stress pathway, including BiP, EIF2ΑK3(PERK), EIF2Α(eIF2α), ERN1(IRE1α), and ATF6 were identified and visualized based on their expression levels. F Correlation between RUNX1 and ER stress pathway-related genes, including BiP, EIF2ΑK3, EIF2Α, ERN1, and ATF6, was analyzed using bulk RNA-seq data from 171 patients with PDAC obtained from TCGA. Co-expression heat maps were generated using the R software package heatmap, with red indicating high expression and blue indicating low expression. G Correlations between RUNX1 and the three UPR pathways were further analyzed. Correlation gene set enrichment analysis (GSEA) plots were generated and visualized using the R software package, GSEA
Fig. 5
Fig. 5
RUNX1 imparts gemcitabine resistance in PDAC through ER stress. A Representative morphological images of the ER structure using transmission electron microscopy. SW1990 cells were treated with 2 µM gemcitabine for 48 h, or with 300 nM thapsigargin (Tg) for 6 h as the positive control, or normal media for 12 h as the negative control. The red arrow indicates ER structure. Scale bar of the above is 50 µm, scale bar of the below is 10 µm. B-C The immunoblot analysis of BiP expression and three UPR branches: PERK branch, IRE1α branch and ATF6 branch on SW1990 cell lines treated with gemcitabine (2 µM, 24 h), Tg(100 nM, 6 h) and normal media. D and F The cell apoptosis of SW1990-RUNX1 cell lines treated with combination of gemcitabine (2 µM) and 10 nM 4-PBA (D) or 10 µM GSK2606414 (F) for 48 h. The average cell apoptosis rate in each group is shown in the right column. E and G Clonogenic assay of SW1990-RUNX1 cells, which were seeded at 1000 cells/well, in gemcitabine (200 nM), and then 4-PBA (E) or GSK2606414 (G) was added. Colonies were stained with crystal violet (0.5%) after 14 d and counted using ImageJ software. H-Cell viability of SW1990-RUNX1 cells treated with a combination of gemcitabine and 10 nM 4-PBA (H) or 10 µM GSK2606414 (I) for 72 h. JThe immunoblot analysis of ER stress related markers (BiP, p-eIF2α) and cell apoptosis marker (cleaved Caspase 3) on SW1990-RUNX1 cell line treated with gemcitabine (2 µM, 48 h).K-L The immunoblot analysis of the BiP/PERK/eIF2α axis and cell apoptosis marker(cleaved Caspase 3) on SW1990-RUNX1 cell line treated with combination of gemcitabine and 10 nM 4-PBA (K) or 10 µM GSK2606414 (L) for 48 h. MO Representative images of BiP and p-eIF2α staining in subcutaneous xenograft tissues of the scramble and shRUNX1 groups with or without gemcitabine (M, tissues are shown in Fig. 3). The IHC scores for BiP (N) and p-eIF2α (O) staining in each group were evaluated and are shown in the right column of the diagram. Student’s t-test were used in the column diagram; *, p < 0.05; **, p < 0.01; ***, p < 0.001; ns, no significance. GSK, GSK2606414
Fig. 6
Fig. 6
RUNX1 positively transcriptional regulates the expression of BiP in PDAC cells. A Volcano diagram showing the differential genes by RUNX1 alteration based on TCGA dataset. B Spearman correlation analysis of RUNX1 and ER stress related markers: BiP, EIF2ΑK3(PERK), ERN1(IRE1α), and ATF6), based on the TCGA dataset. C Feature plot showing the co-expression relationship of RUNX1 and BiP expression in malignant ductal epithelial cells in the downloaded single-cell dataset (CRA001160), color ranges blue (low) to yellow (high)represents correlation score. D-E Representative images of BiP and RUNX1 staining (low and high) on successive slides of human PDAC tissues (D). The bubble diagram (E) showing expression of RUNX1 and BiP in each sample. The bubble size represents the number of cases. F Immunoblot analysis of RUNX1 and BiP expression in SW1990-RUNX1 and L3.7-shRUNX1 cells. G-H mRNA levels of RUNX1 and BiP in SW1990-RUNX1 and L3.7-shRUNX1cell lines by RT-qPCR. I ChIP analysis of SW1990-RUNX1 cells. Chromatin was immunoprecipitated using an anti-RUNX1 antibody and subjected to PCR. J SW1990-RUNX1 cells were transfected with a pGL3-BiP-widetype (wt), pGL3-BiP-mutation or pGL3-control vector. The results are presented as a fold-change Firefly activity relative to cells transfected with the control vector after normalization to Renilla activity. K The cell apoptosis of SW1990-RUNX1 cells transfected with siRNA targeting BiP(siBiP#1) by flowcytometry, under gemcitabine treatment (2 µM, 48 h). The average apoptosis rate in each group is shown in the column diagram. J Clonogenic assay of SW1990-RUNX1 cells and SW1990-vector cells transfected with siBiP#1, under gemcitabine treatment (200 nM). Colonies were stained with crystal violet (0.5%) after 14 d and counted using ImageJ software. Student’s t-test was used in the column diagram; scale bar, 200 µm; *, p < 0.05; **, p < 0.01; ***, p < 0.001
Fig. 7
Fig. 7
Targeting RUNX1 could reverse gemcitabine resistance and sensitize PDAC to gemcitabine. A-D Human pancreatic cancer cell line L3.7–2 was subcutaneously transplanted into nude mice, and the other three groups of mice were administered gemcitabine alone, Ro5-3335 alone, or a combination of gemcitabine and Ro5-3335. The tumors were obtained at the end of the experiment. Tumor volumes (A, B), tumor weight (C), and mouse weight (D) were analyzed. EH The tumors were sliced and stained with Ki-67 and Caspases3. TUNEL kit was used to determine the cell mortality rate. Representative images of Ki-67, Caspases3 staining and TUNEL staining are shown. The IHC scores of BiP, p-eIF2α staining and apoptotic cells rates of each group were evaluated and showed in the column diagram respectively. IJ Protein levels of RUNX1 in nine PDX were detected by western blotting (I). Three cases with high RUNX1 expression and three cases with low RUNX1 expression were used to develop PDX models in NSG mice (n = 4 for each case). The mice were treated with saline, gemcitabine alone, Ro5-3335 alone, or a combination of gemcitabine and Ro5-3335. After two weeks, the tumor was removed, and the tumor weight was analyzed. The representative images are shown in (J). K-L Tumor weight and tumor inhibition of the high RUNX1 expression group and low RUNX1 expression group with different treatment are shown. M Diagram of RUNX1 facilitates ER stress-mediated GEM-resistance. RUNX1 inhibitor Ro5-3335 displayed an enhanced effect to overcome the GEM-resistance in PDAC. Student’s t-test and ANOVA test were used in the column diagram; scale bar, 100 µm. *, p < 0.05; **, p < 0.01; ***, p < 0.001; ns, no significance

References

    1. Siegel RL, Miller KD, Fuchs HE, Jemal A. Cancer statistics, 2022. CA Cancer J Clin. 2022;72(1):7–33. doi: 10.3322/caac.21708. - DOI - PubMed
    1. Soreide K, Rangelova E, Dopazo C, Mieog S, Stattner S. Pancreatic cancer. Eur J Surg Oncol. 2023;49(2):521–525. - PubMed
    1. Zeng S, Pottler M, Lan B, Grutzmann R, Pilarsky C, Yang H. Chemoresistance in pancreatic cancer. Int J Mol Sci. 2019;20(18):4504. - PMC - PubMed
    1. Amrutkar M, Gladhaug IP. Pancreatic cancer chemoresistance to gemcitabine. Cancers (Basel) 2017;9(11):157. - PMC - PubMed
    1. Garcia-Carbonero N, Li W, Cabeza-Morales M, Martinez-Useros J, Garcia-Foncillas J. New hope for pancreatic ductal adenocarcinoma treatment targeting endoplasmic reticulum stress response: a systematic review. Int J Mol Sci. 2018;19(9):2468. - PMC - PubMed