. 2023 Sep 12;21(1):193.
doi: 10.1186/s12915-023-01695-y.

Prefoldin 2 contributes to mitochondrial morphology and function

Affiliations

Prefoldin 2 contributes to mitochondrial morphology and function

Ismail Tahmaz et al. BMC Biol. .

Abstract

Background: Prefoldin is an evolutionarily conserved co-chaperone of the tailless complex polypeptide 1 ring complex (TRiC)/chaperonin containing tailless complex 1 (CCT). The prefoldin complex consists of six subunits that are known to transfer newly produced cytoskeletal proteins to TRiC/CCT for folding polypeptides. Prefoldin function was recently linked to the maintenance of protein homeostasis, suggesting a more general function of the co-chaperone during cellular stress conditions. Prefoldin acts in an adenosine triphosphate (ATP)-independent manner, making it a suitable candidate to operate during stress conditions, such as mitochondrial dysfunction. Mitochondrial function depends on the production of mitochondrial proteins in the cytosol. Mechanisms that sustain cytosolic protein homeostasis are vital for the quality control of proteins destined for the organelle and such mechanisms among others include chaperones.

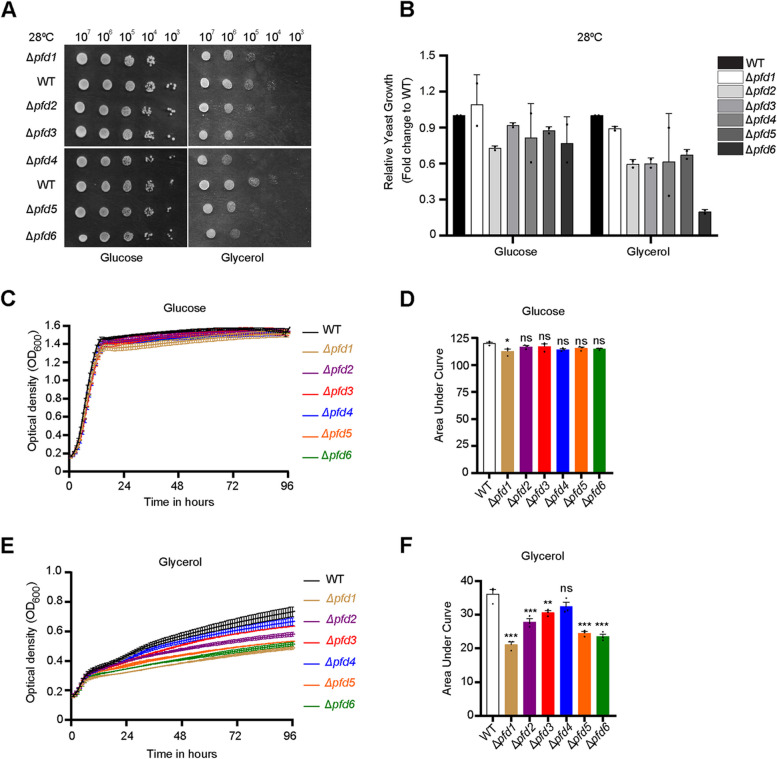
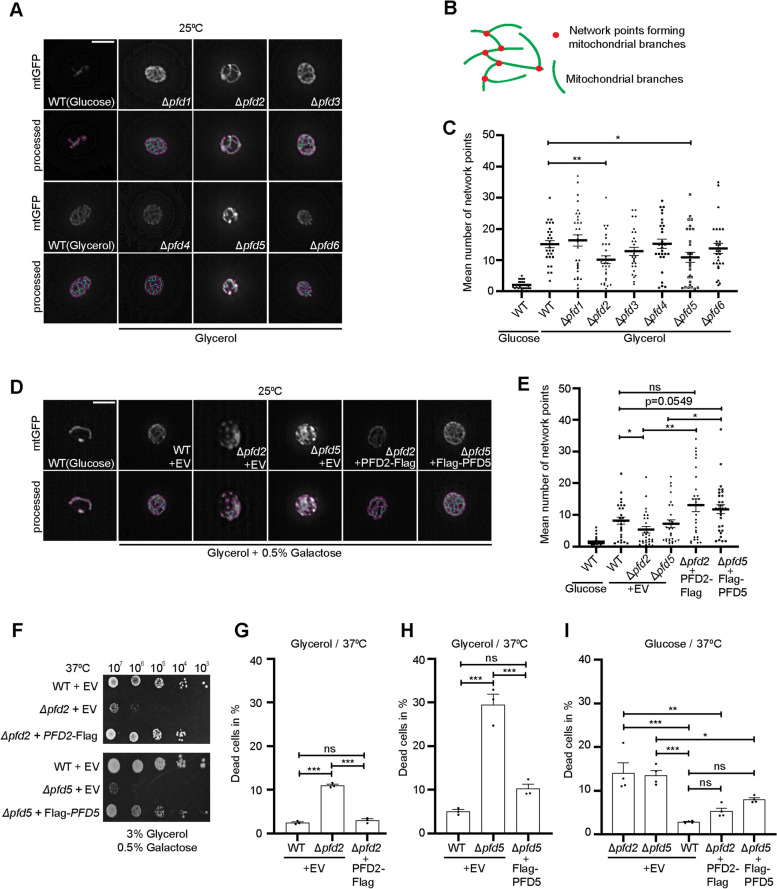
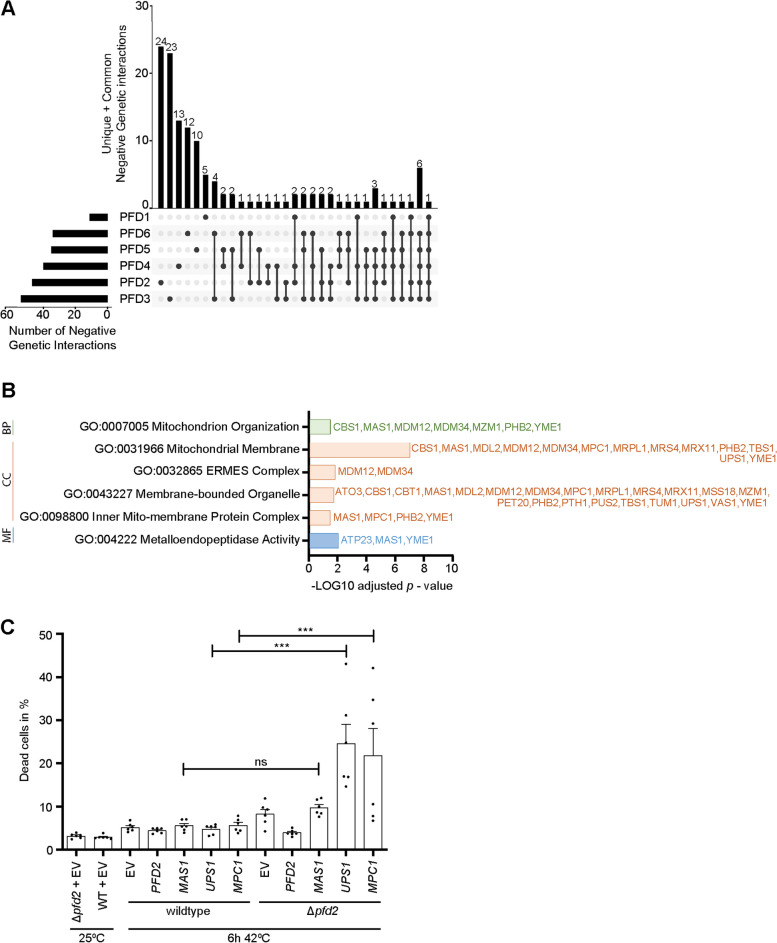
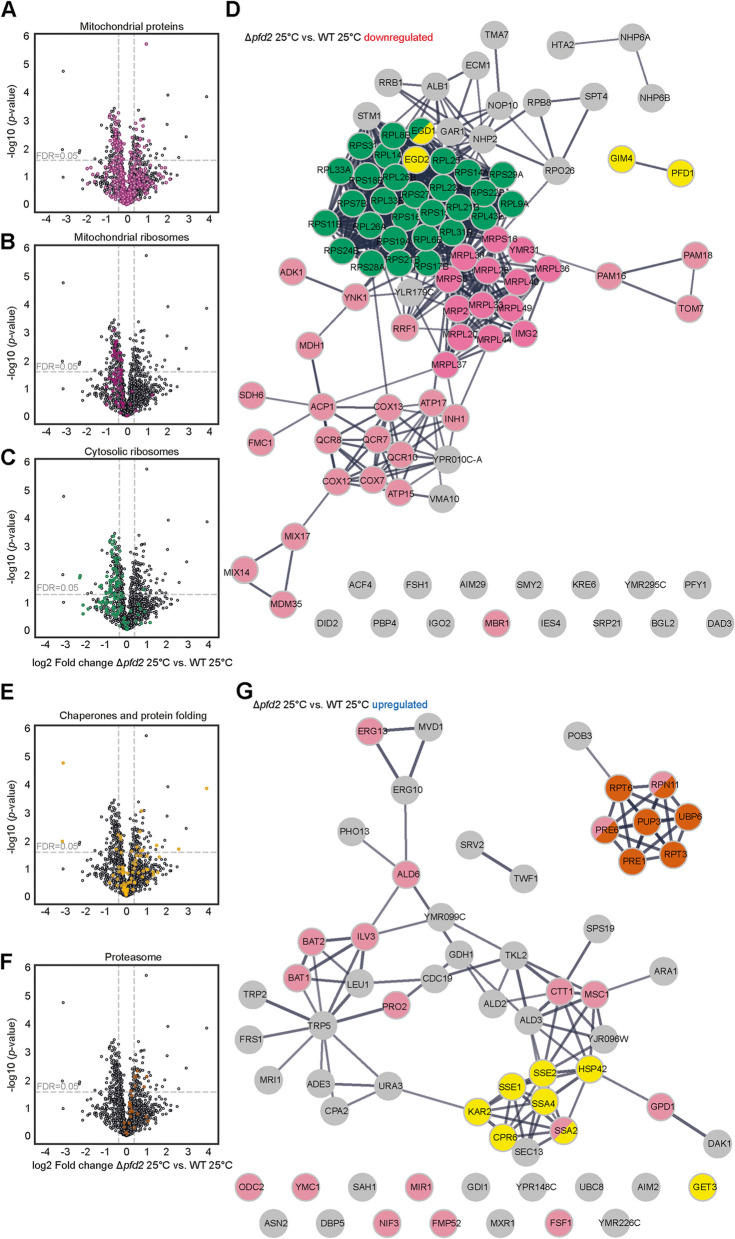
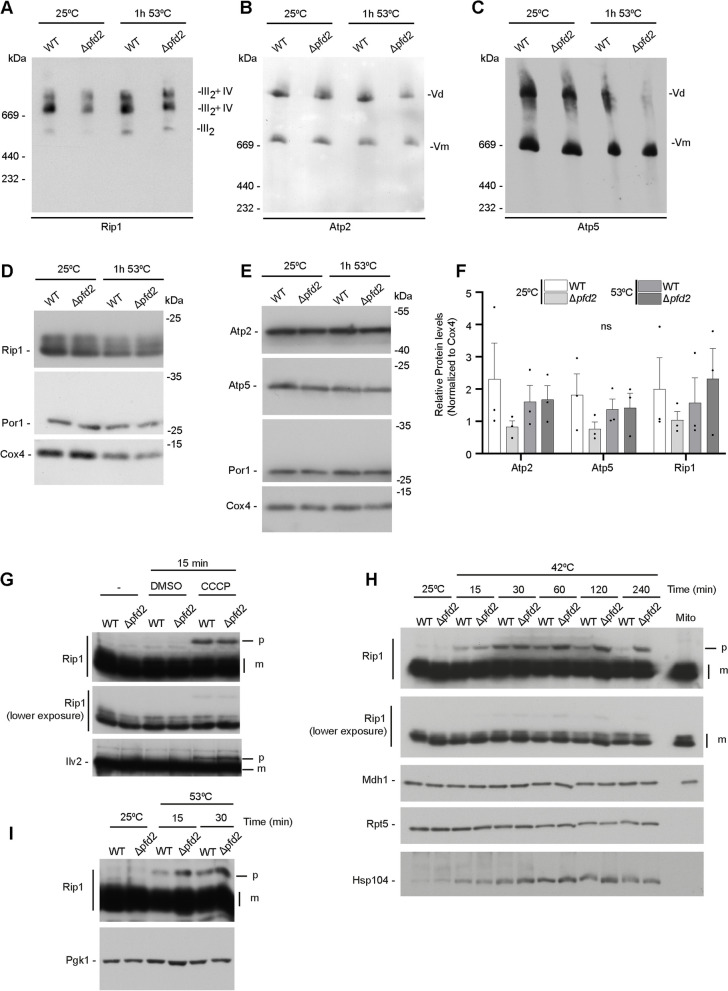
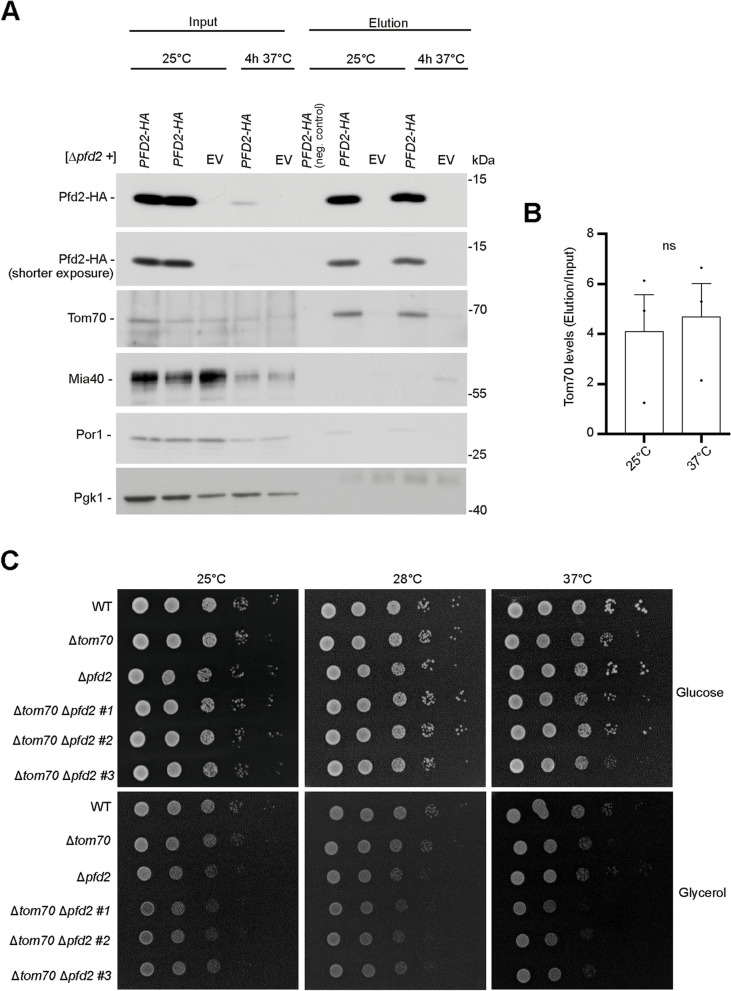
Results: We analyzed consequences of the loss of prefoldin subunits on the cell proliferation and survival of Saccharomyces cerevisiae upon exposure to various cellular stress conditions. We found that prefoldin subunits support cell growth under heat stress. Moreover, prefoldin facilitates the growth of cells under respiratory growth conditions. We showed that mitochondrial morphology and abundance of some respiratory chain complexes was supported by the prefoldin 2 (Pfd2/Gim4) subunit. We also found that Pfd2 interacts with Tom70, a receptor of mitochondrial precursor proteins that are targeted into mitochondria.

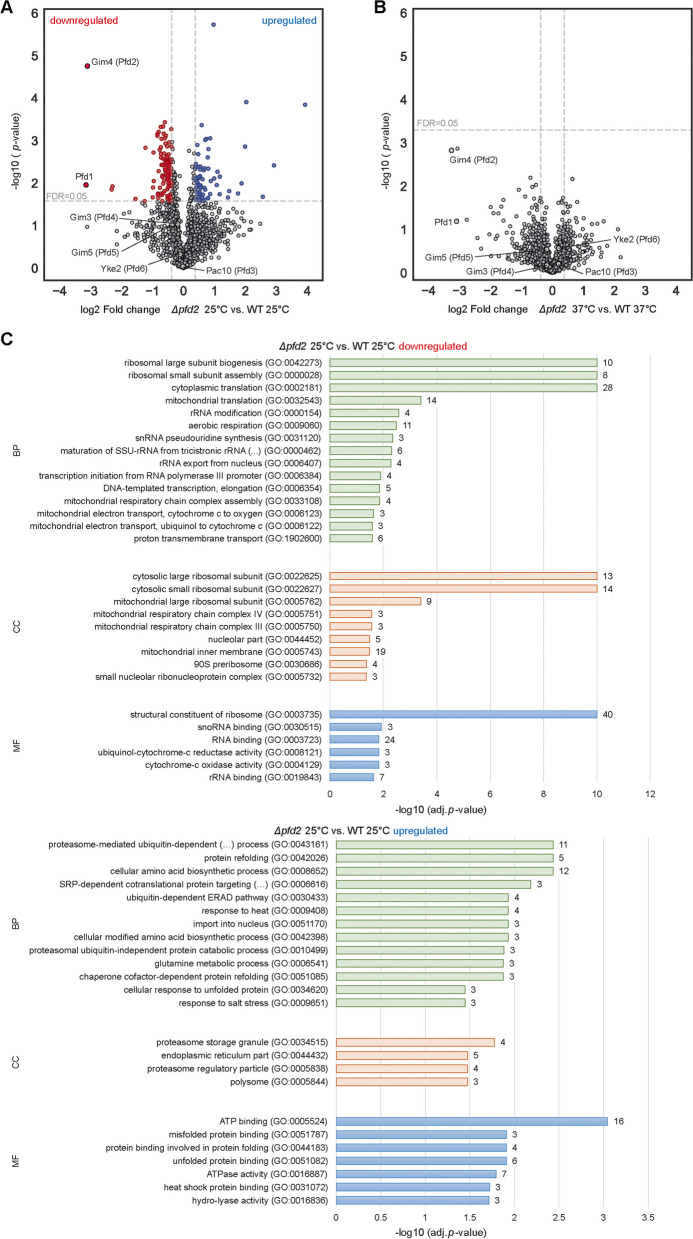
Conclusions: Our findings link the cytosolic prefoldin complex to mitochondrial function. Loss of the prefoldin complex subunit Pfd2 results in adaptive cellular responses on the proteome level under physiological conditions suggesting a continuous need of Pfd2 for maintenance of cellular homeostasis. Within this framework, Pfd2 might support mitochondrial function directly as part of the cytosolic quality control system of mitochondrial proteins or indirectly as a component of the protein homeostasis network.

Keywords: Chaperone; Mitochondria; Pfd2/Gim4; Prefoldin; Proteostasis; Tom70.


Conflict of interest statement

The authors declare that they have no competing interests.

Figures

Fig. 1
Fig. 1
Loss of prefoldin subunits leads to a decrease in growth under respiratory conditions. A Ten-fold dilutions of yeast cells of the indicated strains were spotted on solid agar plates with complete synthetic medium that contained glucose or glycerol. Cells were grown at 28 °C for 3 days. Experiments were performed in two biological repetitions. B Quantification of spot test shown in A. The data are expressed as the mean ± SD. n = 2. C, E Wildtype cells and yeast cells that lacked single prefoldin subunits were grown on complete synthetic medium that contained glucose (C) or glycerol (E). The growth of yeast cells was monitored over time. Each experiment was performed in three biological repetitions. The data are expressed as the mean ± SEM. D, F Quantification of growth shown in C and E, respectively, by calculating the area under the curve using GraphPad Prism 8.3.0 software. The data are expressed as the mean ± SEM. n = 3. ***p < 0.001, **p < 0.01, *p < 0.05. ns, not significant. WT, wild type
Fig. 2
Fig. 2
Loss of PFD2 and PFD5 results in defective mitochondria network. A, D Yeast cells that were transformed with a plasmid that harbored mitochondrial-targeted GFP (mtGFP) were grown at 25 °C on selective synthetic medium that contained glycerol or glucose as indicated. Representative images are shown for the expression of mitochondrial GFP and images processed with the MINA plugin tool in ImageJ (see “Methods” section) of the same cell are shown below. Pink lines represent mitochondrial footprint generated by MINA plugin tool. Scale bar = 5 µm. B Schematic representation of features taken into account to quantify the number of mitochondrial networks shown in C and E. C, E Analysis of mitochondrial morphology, expressed as the number of network points. The data are expressed as the mean ± SEM. n = 3. ***p < 0.001, **p < 0.01, *p < 0.05. D–I Wildtype cells or cells that lacked PFD2 or PFD5 were transformed with an empty vector or a plasmid that harbored PFD2-Flag or Flag-PFD5, respectively. F Ten-fold dilutions of yeast cells of the indicated strains were spotted on selective medium plates that contained glycerol and 0.5% galactose. Cells were grown at 37 °C for 6 days. Experiments were performed in at least two biological repetitions. GH Transformed yeast cells were grown in selective G, H glycerol- or I glucose-containing liquid medium to the logarithmic growth phase at 25 °C. Galactose (0.5%) was added to the cultures to induce expression from the plasmid, and cells were shifted to 37 °C for 4 h. Cell viability was assessed by staining with propidium iodide and analyzed by flow cytometry. The data are expressed as the mean ± SEM. n = 3. ***p < 0.001; ns, not significant. WT, wild type; EV, empty vector
Fig. 3
Fig. 3
Prefoldin subunits genetically interact with genes that encode mitochondrial proteins. A UpSet plot illustrating the number of common and unique mitochondrial genes that showed a negative genetic interaction with single deletions of prefoldin subunits. B Gene ontology analysis of mitochondrial genes that showed a negative genetic interaction with Δpfd2. C Wildtype cells and Δpfd2 cells were transformed with an empty vector or a plasmid that harbored mitochondrial genes that were identified as negative genetic interactors with Δpfd2. Gene expression was under control of the constitutive TEF1 promoter. Transformed strains were grown on selective minimal medium that contained glycerol at 25 °C to the logarithmic growth phase and shifted to 42 °C for 6 h. Cell viability was assessed by propidium iodide staining and analyzed by flow cytometry. The data are expressed as the mean ± SEM. n = 4. ***p < 0.001. ns, not significant. WT, wild type
Fig. 4
Fig. 4
Loss of PFD2 leads to changes in proteins abundance involved in protein homeostasis. A, B Wildtype and Δpfd2 cells were grown at 25 °C (A) and shifted to 37 °C for 4 h (B). Volcano plots showing proteins with significantly increased (blue circles) and decreased (red circles) protein abundance in Δpfd2 versus wildtype cells. Adj. P-value of < 0.05 (FDR = 0.05) and fold change of 1.3 was considered as statistical significant change. Non-significant proteins are shown in gray circles. C Gene ontology enrichment of proteins with significantly downregulated (upper panel) or upregulated (lower panel) protein abundance in Δpfd2 cells compared with wildtype grown at 25 °C. Values next to the right side of the bars indicate the numbers of proteins with the certain GO term. WT, wild type
Fig. 5
Fig. 5
Loss of PFD2 leads to decreased abundance of mitochondrial proteins at permissive growth temperature. A–C, E, F Volcano plots showing all identified proteins that localize to mitochondria (light pink circles in A), mitochondrial ribosome (dark pink circle in B), cytosolic ribosome (green circle in C), chaperones and protein folding (yellow circle in E), and proteasome (brown circle in F). D Interaction network of all proteins significantly downregulated. In yellow are proteins identified as chaperones and in pink are proteins localized to mitochondria including mitochondrial ribosomes and in green are proteins of the cytosolic ribosome marked. G Interaction network of all proteins significantly upregulated. In pink are proteins with mitochondrial localization, in yellow are proteins identified as chaperones and in brown are proteins of the proteasome system marked. WT, wild type
Fig. 6
Fig. 6
Loss of PFD2 results in mild deficiencies in respiratory chain complexes. A–E Yeast cells were grown in complete synthetic medium that contained glycerol at 25 °C and shifted to 53 °C for 1 h where indicated. Mitochondria were isolated for both growth conditions. A–C Mitochondrial extracts were separated on native gel and analyzed by Western blot using specific antibodies. Experiments were performed in three biological repetitions. D, E Mitochondrial extracts were separated on SDS-PAGE and analyzed by Western blot using specific antibodies. Blots shown in D serve as loading control for native gel shown in A. Blots shown in E serve as loading control for native gels shown in B and C. F Quantification of mitochondrial protein levels. The data are expressed as the mean ± SEM. n = 3. G–I Yeast cells were grown in galactose-containing medium at 25 °C and shifted to higher temperature as indicated. Total protein extracts were separated on SDS-PAGE and analyzed by Western blot using specific antibodies. G Yeast cells were treated with 40 µM CCCP or an equivalent volume of DMSO (solvent) for 15 min. Cells were harvested before treatment (-) or after treatment (DMSO or CCCP). WT, wild type. Uncropped blots are presented as source data in the Additional file 13
Fig. 7
Fig. 7
Pfd2 physically interacts with Tom70. A Cells that lacked PFD2 were transformed with a plasmid that expressed PFD2-HA or an empty vector. Cells were grown on selective minimal medium that contained glycerol at 25 °C to the logarithmic growth phase and shifted to 37 °C for 4 h. Equal volume of the input and elution fractions of the immunoprecipitation experiment was separated on SDS-PAGE and analyzed by Western blot against specific antibodies. The experiment was repeated three times. “neg. control” (negative control) in the elution fraction indicates that the lysate was incubated with beads not coupled with antibodies. Uncropped blots are presented as source data in the Additional file 13. B Quantification of signal for Tom70 in the elution fraction. The data are expressed as the mean ± SEM. n = 3. C Ten-fold dilutions of wildtype cells, Δtom70, Δpfd2 and double deletion of Δtom70 Δpfd2 were spotted on minimal medium plates containing glycerol or glucose. Cells were grown at indicated temperatures for 2–5 days. For the double deletion three different strains (#1, #2, #3) are shown that were maintained after genetic manipulation. Experiment was performed twice with each two technical repetitions with consistent results. WT, wild type

Similar articles

Cited by

References

    1. Hartl FU, Hayer-Hartl M. Molecular chaperones in the cytosol: from nascent chain to folded protein. Science. 2002;295(5561):1852–1858. - PubMed
    1. Jones RD, Gardner RG. Protein quality control in the nucleus. Curr Opin Cell Biol. 2016;40:81–89. - PMC - PubMed
    1. Thulasiraman V, Yang CF, Frydman J. In vivo newly translated polypeptides are sequestered in a protected folding environment. EMBO J. 1999;18(1):85–95. - PMC - PubMed
    1. Yam AY, Xia Y, Lin HT, Burlingame A, Gerstein M, Frydman J. Defining the TRiC/CCT interactome links chaperonin function to stabilization of newly made proteins with complex topologies. Nat Struct Mol Biol. 2008;15(12):1255–1262. - PMC - PubMed
    1. Sahlan M, Zako T, Yohda M. Prefoldin, a jellyfish-like molecular chaperone: functional cooperation with a group II chaperonin and beyond. Biophys Rev. 2018;10(2):339–345. - PMC - PubMed

Publication types

LinkOut - more resources