. 2023 Nov;9(6):449-463.
doi: 10.1002/cjp2.342. Epub 2023 Sep 11.

Accounting for intensity variation in image analysis of large-scale multiplexed clinical trial datasets

Affiliations

Accounting for intensity variation in image analysis of large-scale multiplexed clinical trial datasets

Anja L Frei et al. J Pathol Clin Res. 2023 Nov.

Abstract

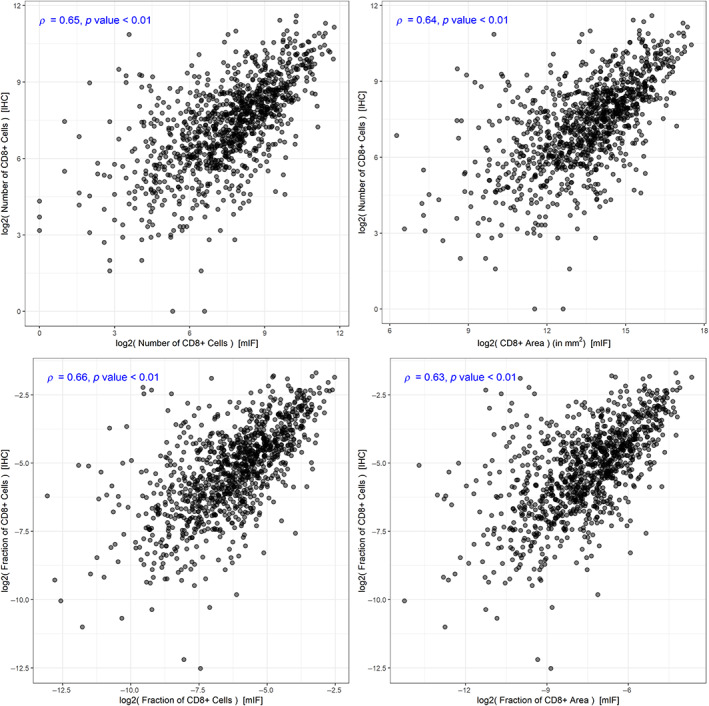
Multiplex immunofluorescence (mIF) imaging can provide comprehensive quantitative and spatial information for multiple immune markers for tumour immunoprofiling. However, application at scale to clinical trial samples sourced from multiple institutions is challenging due to pre-analytical heterogeneity. This study reports an analytical approach to the largest multi-parameter immunoprofiling study of clinical trial samples to date. We analysed 12,592 tissue microarray (TMA) spots from 3,545 colorectal cancers sourced from more than 240 institutions in two clinical trials (QUASAR 2 and SCOT) stained for CD4, CD8, CD20, CD68, FoxP3, pan-cytokeratin, and DAPI by mIF. TMA slides were multi-spectrally imaged and analysed by cell-based and pixel-based marker analysis. We developed an adaptive thresholding method to account for inter- and intra-slide intensity variation in TMA analysis. Applying this method effectively ameliorated inter- and intra-slide intensity variation improving the image analysis results compared with methods using a single global threshold. Correlation of CD8 data derived by our mIF analysis approach with single-plex chromogenic immunohistochemistry CD8 data derived from subsequent sections indicates the validity of our method (Spearman's rank correlation coefficients ρ between 0.63 and 0.66, p ≪ 0.01) as compared with the current gold standard analysis approach. Evaluation of correlation between cell-based and pixel-based analysis results confirms equivalency (ρ > 0.8, p ≪ 0.01, except for CD20 in the epithelial region) of both analytical approaches. These data suggest that our adaptive thresholding approach can enable analysis of mIF-stained clinical trial TMA datasets by digital pathology at scale for precision immunoprofiling.

Keywords: digital pathology; fluorescence microscopy; image analysis.


Figures

Figure 1
Figure 1
Example of 7‐plex colorectal cancer TMA spot image from Q2 cohort. (A) All channels combined. (B–H) Individual marker channels (pCK, pan‐cytokeratin). (I) Autofluorescence.
Figure 2
Figure 2
Intensity variation across the dataset. (A) Average intensities per slide and marker across the dataset. (B) Examples of CD8 staining (Opal™ 570) of different slides from the Q2 cohort illustrating inter‐slide variation of single marker channels. Both images were taken with the same view settings. (C) Example of CD20 staining (Opal™ 540) of a slide from the SCOT cohort illustrating intra‐slide variation of single marker channels. (D) Spot with distortion of nuclear signal (bottom row) compared with spot without distortion of nuclear signal (top row). Left: all channels except DAPI; right: DAPI channel. All images were taken with the same view settings.
Figure 3
Figure 3
Schematic analysis workflow. Schematic visualisation of the analysis workflow and corresponding numbers of included/excluded spots and cases based on manual quality control (QC).
Figure 4
Figure 4
Visual comparison of image analysis with and without adaptive thresholding. (A) Example from the Q2 cohort for cell‐based marker analysis (CD8) with and without slide‐specific thresholding. The two spots are sourced from different slides. Left: original image (blue, DAPI channel; orange, CD8 channel; magenta, pan‐cytokeratin channel); middle: cell‐level markup using suggested slide‐specific threshold; right: cell‐level analysis markup using slide‐specific threshold suggested for the other spot, simulating global thresholding. Cells marked as marker positive are indicated by orange cytoplasm in the analysis markup. (B) Example from the SCOT cohort for pixel‐based marker analysis (CD68) with and without spot‐specific thresholding. Both spots are from the same slide. Left: original image (turquoise, CD68 channel; magenta, pan‐cytokeratin channel); middle: pixel‐level markup using suggested spot‐specific threshold; right: pixel‐level analysis markup using spot‐specific threshold suggested for the other spot, simulating global thresholding. Pixels marked as CD68 positive are indicated by turquoise colour in the analysis markup.
Figure 5
Figure 5
Pixel‐based analysis: density distribution and comparison with cell‐based analysis. (A) Comparison of the density distribution across the Q2 and the SCOT cohort. (B) Comparison of absolute measurements: number of positive cells versus the amount of positive area, separated per marker and stromal/epithelial compartment, in the Q2 cohort. (C) Comparison of density measurements: number of positive cells per area versus the amount of positive area in relation to the total area, separated per marker and stromal/epithelial compartment, in the Q2 cohort.
Figure 6
Figure 6
Comparison of multiplex analysis with orthogonal method in Q2 cohort. Comparison of mIF‐derived with IHC‐derived data for CD8 positivity. Top row: comparison of absolute measurements. Bottom row: comparison of density measurements. Left column: comparison with cell‐level mIF data. Right column: comparison with pixel‐level mIF data.

References

    1. Koelzer VH, Sirinukunwattana K, Rittscher J, et al. Precision immunoprofiling by image analysis and artificial intelligence. Virchows Arch 2019; 474: 511–522. - PMC - PubMed
    1. Sobottka B, Nowak M, Frei AL, et al. Establishing standardized immune phenotyping of metastatic melanoma by digital pathology. Lab Invest 2021; 101: 1561–1570. - PMC - PubMed
    1. Gorris MAJ, Halilovic A, Rabold K, et al. Eight‐color multiplex immunohistochemistry for simultaneous detection of multiple immune checkpoint molecules within the tumor microenvironment. J Immunol 2018; 200: 347–354. - PubMed
    1. Koelzer VH, Rothschild SI, Zihler D, et al. Systemic inflammation in a melanoma patient treated with immune checkpoint inhibitors – an autopsy study. J Immunother Cancer 2016; 4: 13. - PMC - PubMed
    1. Parra ER, Uraoka N, Jiang M, et al. Validation of multiplex immunofluorescence panels using multispectral microscopy for immune‐profiling of formalin‐fixed and paraffin‐embedded human tumor tissues. Sci Rep 2017; 7: 13380. - PMC - PubMed

Publication types

Substances