Meta-Analysis
. 2023 Sep 12:12:e85867.
doi: 10.7554/eLife.85867.

Global diversity and antimicrobial resistance of typhoid fever pathogens: Insights from a meta-analysis of 13,000 Salmonella Typhi genomes

Megan E Carey  1   2   3 Zoe A Dyson  2   4   5 Danielle J Ingle  6 Afreenish Amir  7 Mabel K Aworh  8   9 Marie Anne Chattaway  10 Ka Lip Chew  11 John A Crump  12 Nicholas A Feasey  13   14 Benjamin P Howden  15   16 Karen H Keddy  17 Mailis Maes  1 Christopher M Parry  13 Sandra Van Puyvelde  1   18 Hattie E Webb  19 Ayorinde Oluwatobiloba Afolayan  20 Anna P Alexander  21 Shalini Anandan  22 Jason R Andrews  23 Philip M Ashton  24   25 Buddha Basnyat  26 Ashish Bavdekar  27 Isaac I Bogoch  28 John D Clemens  29   30   31   32 Kesia Esther da Silva  23 Anuradha De  33 Joep de Ligt  34 Paula Lucia Diaz Guevara  35 Christiane Dolecek  36   37 Shanta Dutta  38 Marthie M Ehlers  39   40 Louise Francois Watkins  19 Denise O Garrett  41 Gauri Godbole  10 Melita A Gordon  25 Andrew R Greenhill  42   43 Chelsey Griffin  19 Madhu Gupta  44 Rene S Hendriksen  45 Robert S Heyderman  46 Yogesh Hooda  47 Juan Carlos Hormazabal  48 Odion O Ikhimiukor  20 Junaid Iqbal  49 Jobin John Jacob  22 Claire Jenkins  10 Dasaratha Ramaiah Jinka  50 Jacob John  51 Gagandeep Kang  51 Abdoulie Kanteh  52 Arti Kapil  53 Abhilasha Karkey  26 Samuel Kariuki  54 Robert A Kingsley  55 Roshine Mary Koshy  56 A C Lauer  19 Myron M Levine  57 Ravikumar Kadahalli Lingegowda  58 Stephen P Luby  23 Grant Austin Mackenzie  52 Tapfumanei Mashe  59   60 Chisomo Msefula  61 Ankur Mutreja  1 Geetha Nagaraj  58 Savitha Nagaraj  62 Satheesh Nair  10 Take K Naseri  63 Susana Nimarota-Brown  63 Elisabeth Njamkepo  64 Iruka N Okeke  20 Sulochana Putli Bai Perumal  65 Andrew J Pollard  66   67 Agila Kumari Pragasam  22 Firdausi Qadri  30 Farah N Qamar  49 Sadia Isfat Ara Rahman  30 Savitra Devi Rambocus  16 David A Rasko  68   69 Pallab Ray  44 Roy Robins-Browne  6   70 Temsunaro Rongsen-Chandola  71 Jean Pierre Rutanga  72 Samir K Saha  47 Senjuti Saha  47 Karnika Saigal  73 Mohammad Saiful Islam Sajib  47   74 Jessica C Seidman  41 Jivan Shakya  75   76 Varun Shamanna  58 Jayanthi Shastri  33   77 Rajeev Shrestha  78 Sonia Sia  79 Michael J Sikorski  57   68   69 Ashita Singh  80 Anthony M Smith  81 Kaitlin A Tagg  19 Dipesh Tamrakar  78 Arif Mohammed Tanmoy  47 Maria Thomas  82 Mathew S Thomas  83 Robert Thomsen  63 Nicholas R Thomson  5 Siaosi Tupua  63 Krista Vaidya  84 Mary Valcanis  16 Balaji Veeraraghavan  22 François-Xavier Weill  64 Jackie Wright  34 Gordon Dougan  1 Silvia Argimón  85 Jacqueline A Keane  1 David M Aanensen  85 Stephen Baker  1   3 Kathryn E Holt  2   4 Global Typhoid Genomics Consortium Group Authorship
Collaborators, Affiliations
Meta-Analysis

Global diversity and antimicrobial resistance of typhoid fever pathogens: Insights from a meta-analysis of 13,000 Salmonella Typhi genomes

Megan E Carey et al. Elife. .

Abstract

Background: The Global Typhoid Genomics Consortium was established to bring together the typhoid research community to aggregate and analyse Salmonella enterica serovar Typhi (Typhi) genomic data to inform public health action. This analysis, which marks 22 years since the publication of the first Typhi genome, represents the largest Typhi genome sequence collection to date (n=13,000).

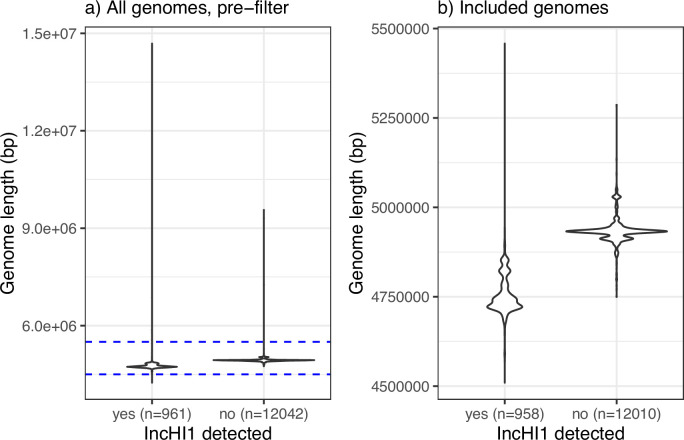
Methods: This is a meta-analysis of global genotype and antimicrobial resistance (AMR) determinants extracted from previously sequenced genome data and analysed using consistent methods implemented in open analysis platforms GenoTyphi and Pathogenwatch.

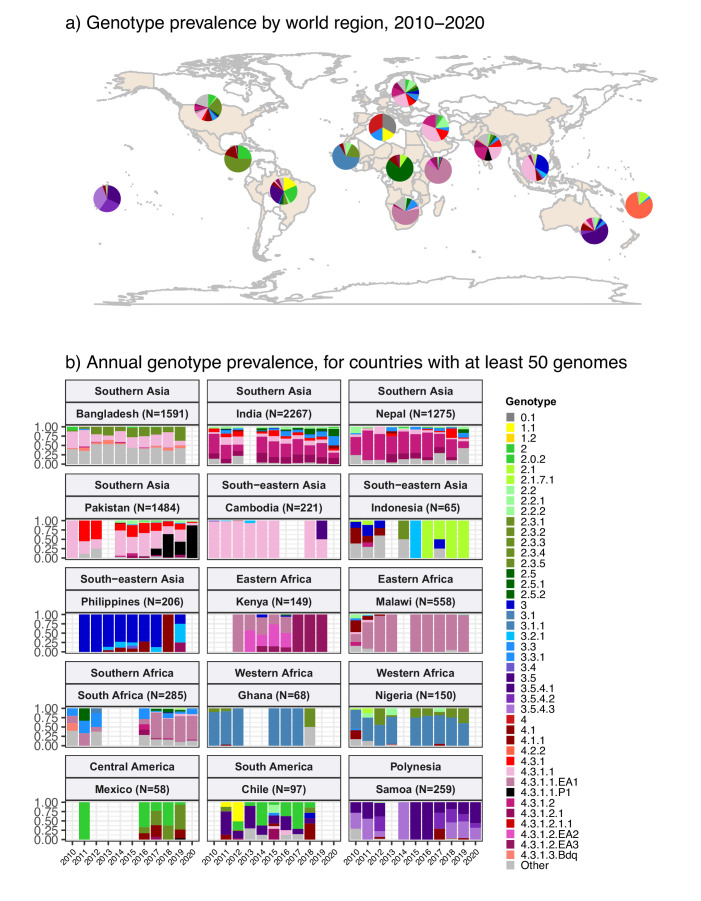
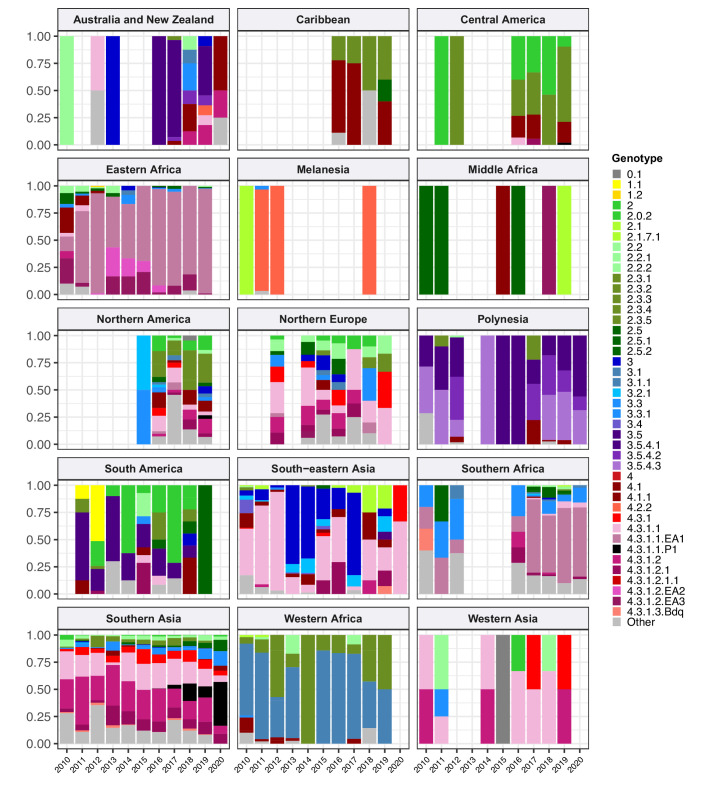
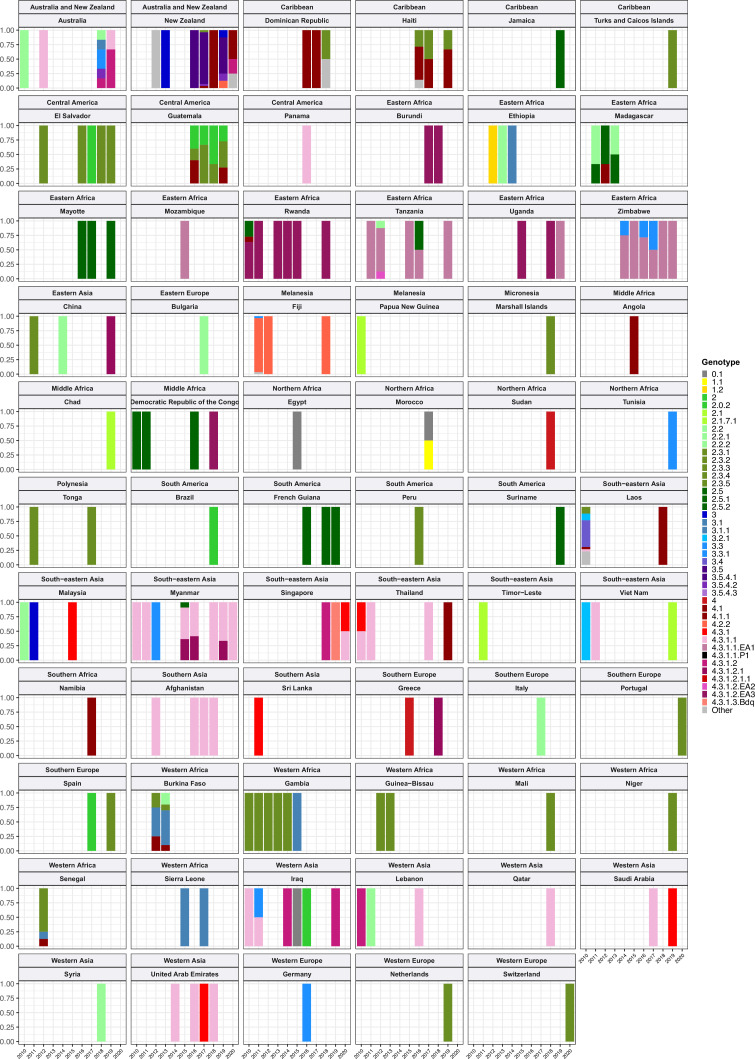
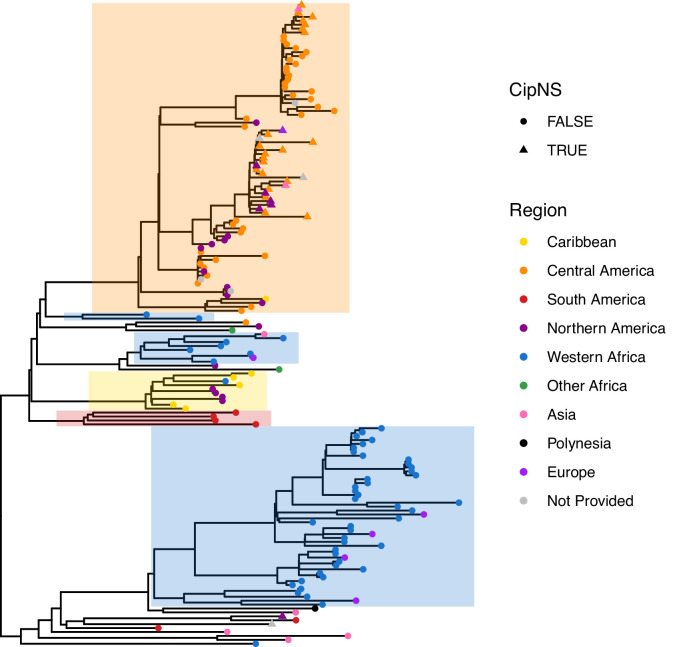
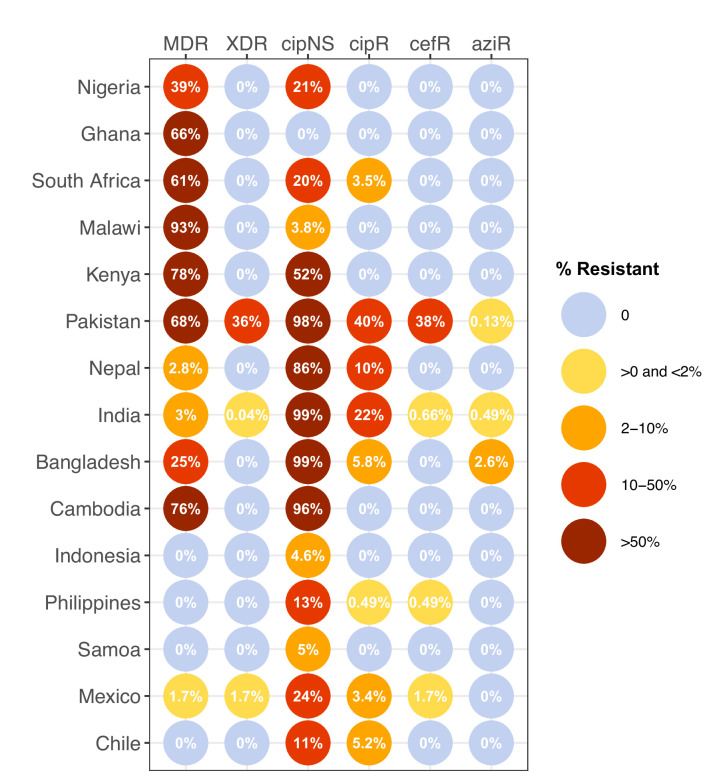
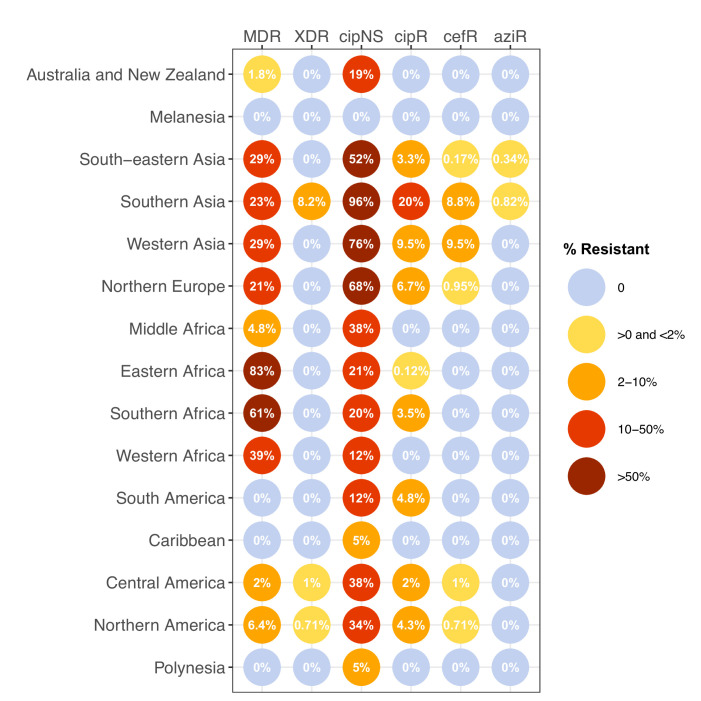
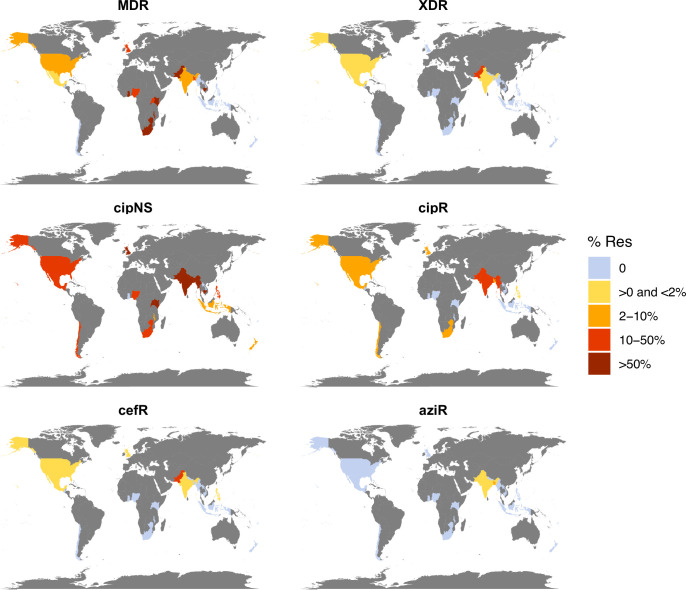
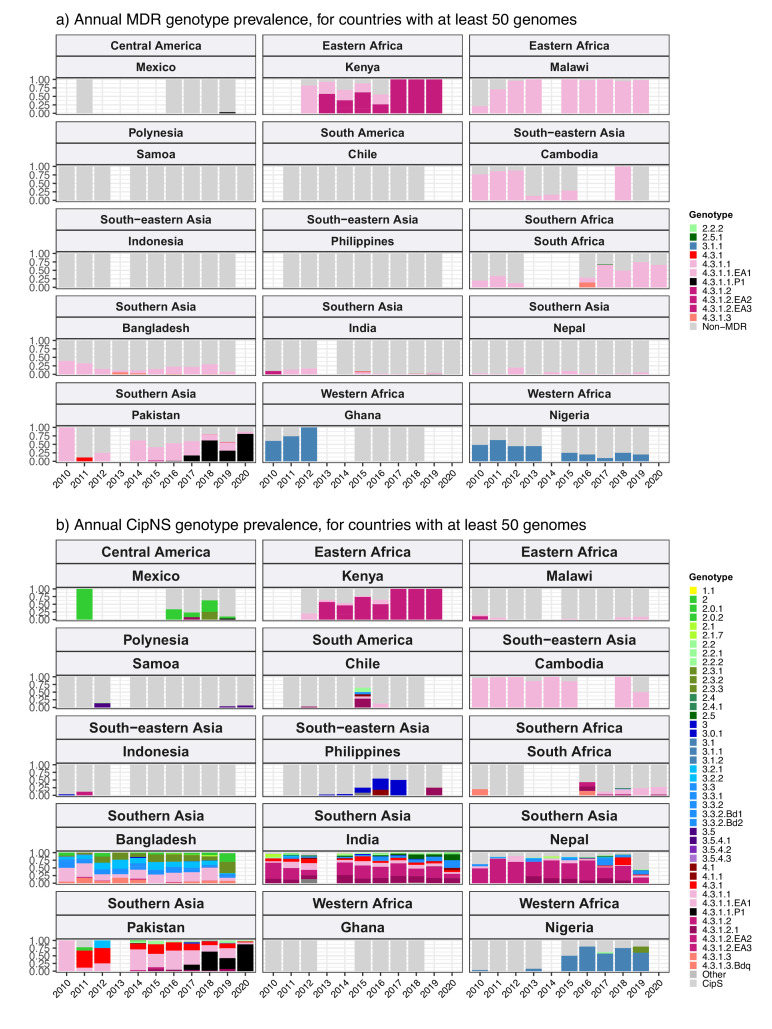
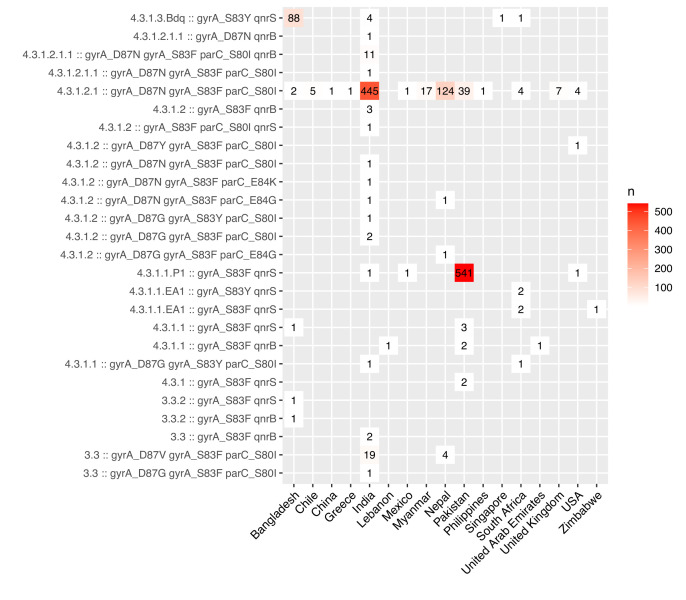
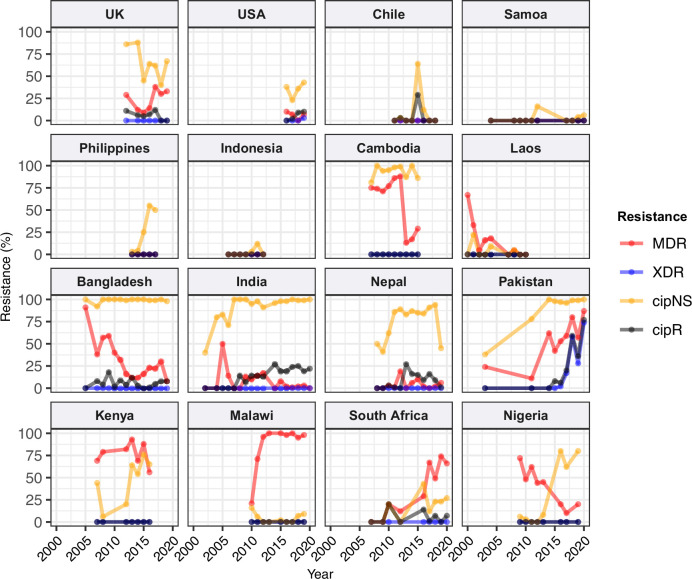
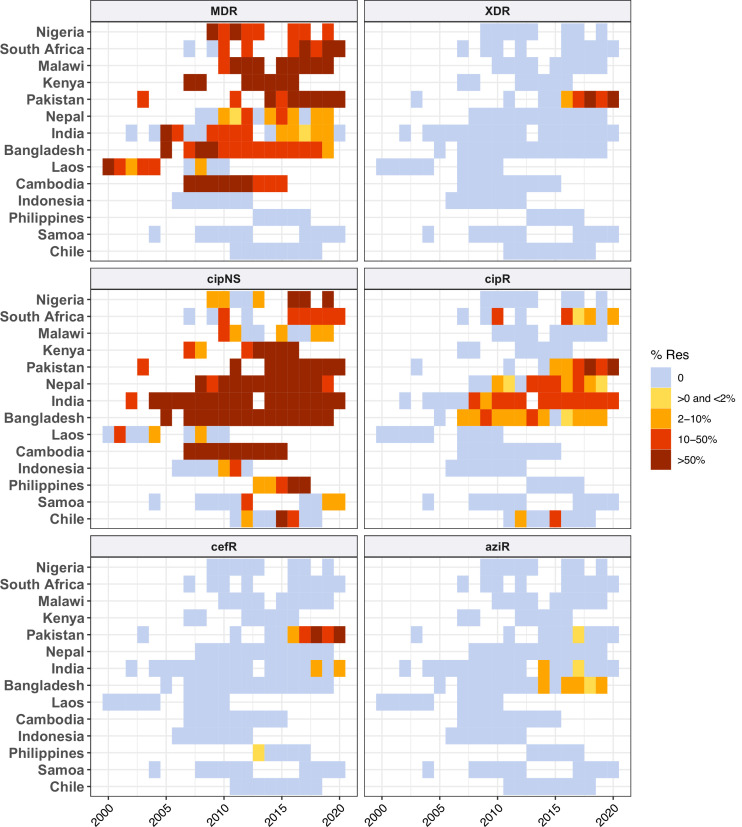
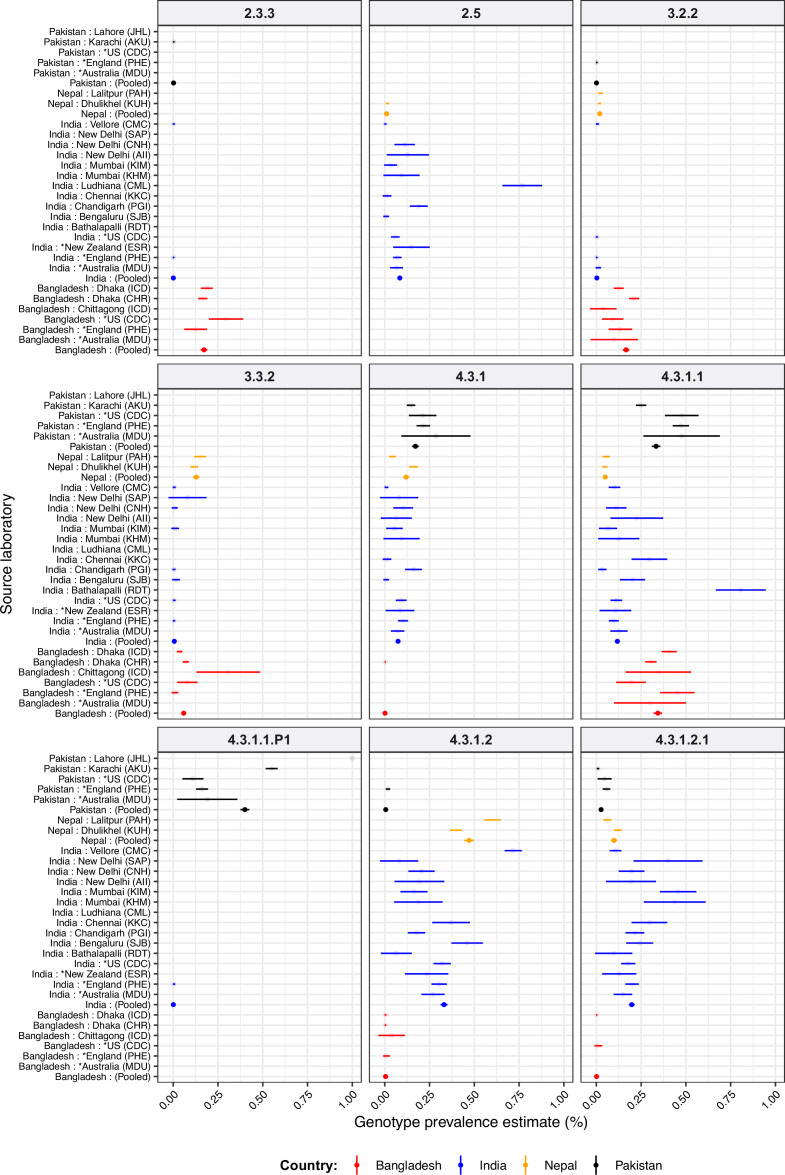
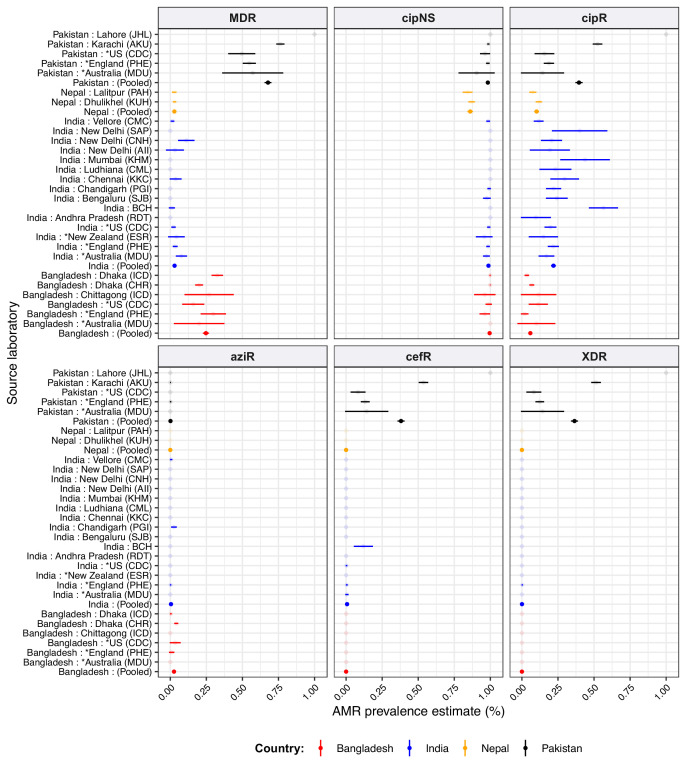
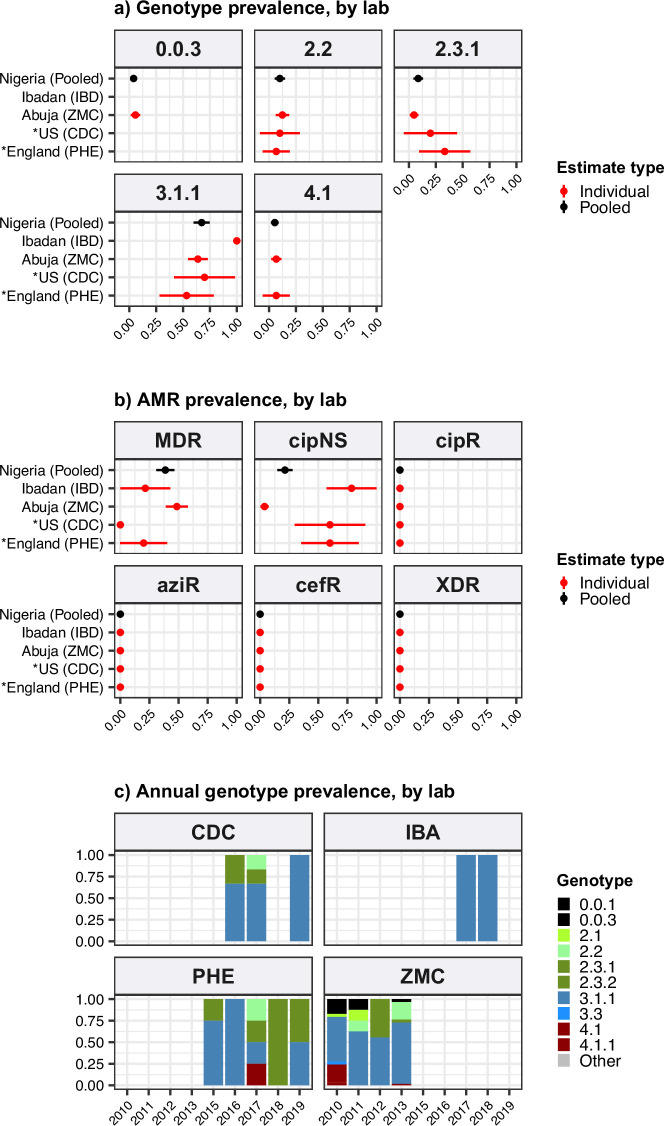
Results: Compared with previous global snapshots, the data highlight that genotype 4.3.1 (H58) has not spread beyond Asia and Eastern/Southern Africa; in other regions, distinct genotypes dominate and have independently evolved AMR. Data gaps remain in many parts of the world, and we show the potential of travel-associated sequences to provide informal 'sentinel' surveillance for such locations. The data indicate that ciprofloxacin non-susceptibility (>1 resistance determinant) is widespread across geographies and genotypes, with high-level ciprofloxacin resistance (≥3 determinants) reaching 20% prevalence in South Asia. Extensively drug-resistant (XDR) typhoid has become dominant in Pakistan (70% in 2020) but has not yet become established elsewhere. Ceftriaxone resistance has emerged in eight non-XDR genotypes, including a ciprofloxacin-resistant lineage (4.3.1.2.1) in India. Azithromycin resistance mutations were detected at low prevalence in South Asia, including in two common ciprofloxacin-resistant genotypes.

Conclusions: The consortium's aim is to encourage continued data sharing and collaboration to monitor the emergence and global spread of AMR Typhi, and to inform decision-making around the introduction of typhoid conjugate vaccines (TCVs) and other prevention and control strategies.

Funding: No specific funding was awarded for this meta-analysis. Coordinators were supported by fellowships from the European Union (ZAD received funding from the European Union's Horizon 2020 research and innovation programme under the Marie Sklodowska-Curie grant agreement No 845681), the Wellcome Trust (SB, Wellcome Trust Senior Fellowship), and the National Health and Medical Research Council (DJI is supported by an NHMRC Investigator Grant [GNT1195210]).

Keywords: S. enterica serovar typhi; antimicrobial resistance; epidemiology; genomics; global health; infectious disease; microbiology; typhoid conjugate vaccine; typhoid fever.

Plain language summary

Salmonella Typhi (Typhi) is a type of bacteria that causes typhoid fever. More than 110,000 people die from this disease each year, predominantly in areas of sub-Saharan Africa and South Asia with limited access to safe water and sanitation. Clinicians use antibiotics to treat typhoid fever, but scientists worry that the spread of antimicrobial-resistant Typhi could render the drugs ineffective, leading to increased typhoid fever mortality. The World Health Organization has prequalified two vaccines that are highly effective in preventing typhoid fever and may also help limit the emergence and spread of resistant Typhi. In low resource settings, public health officials must make difficult trade-off decisions about which new vaccines to introduce into already crowded immunization schedules. Understanding the local burden of antimicrobial-resistant Typhi and how it is spreading could help inform their actions. The Global Typhoid Genomics Consortium analyzed 13,000 Typhi genomes from 110 countries to provide a global overview of genetic diversity and antimicrobial-resistant patterns. The analysis showed great genetic diversity of the different strains between countries and regions. For example, the H58 Typhi variant, which is often drug-resistant, has spread rapidly through Asia and Eastern and Southern Africa, but is less common in other regions. However, distinct strains of other drug-resistant Typhi have emerged in other parts of the world. Resistance to the antibiotic ciprofloxacin was widespread and accounted for over 85% of cases in South Africa. Around 70% of Typhi from Pakistan were extensively drug-resistant in 2020, but these hard-to-treat variants have not yet become established elsewhere. Variants that are resistant to both ciprofloxacin and ceftriaxone have been identified, and azithromycin resistance has also appeared in several different variants across South Asia. The Consortium’s analyses provide valuable insights into the global distribution and transmission patterns of drug-resistant Typhi. Limited genetic data were available fromseveral regions, but data from travel-associated cases helped fill some regional gaps. These findings may help serve as a starting point for collective sharing and analyses of genetic data to inform local public health action. Funders need to provide ongoing supportto help fill global surveillance data gaps.


Conflict of interest statement

MC, ZD, DI, AA, MA, MC, KC, JC, BH, KK, MM, CP, SV, HW, AA, AA, SA, JA, PA, BB, AB, JC, Kd, AD, Jd, PD, CD, SD, ME, LF, DG, GG, MG, AG, CG, MG, RH, RH, YH, JH, OI, JI, JJ, CJ, DJ, JJ, GK, AK, AK, AK, SK, RK, RK, AL, ML, RL, SL, GM, TM, CM, AM, GN, SN, SN, TN, SN, EN, IO, SP, AP, FQ, FQ, SR, SR, DR, PR, RR, TR, JR, SS, SS, KS, MS, JS, JS, VS, JS, RS, SS, MS, AS, AS, KT, DT, AT, MT, MT, RT, NT, ST, KV, MV, BV, FW, JW, GD, SA, JK, DA, SB, KH No competing interests declared, NF NAF chairs the Wellcome Surveillance and Epidemiology of Drug Resistant Infections (SEDRIC) group, which has a focus on antimicrobial resistance. This could be perceived as relevant although not a direct conflict, IB IB has consulted to BlueDot and the NHL Players' Association, AP AJP is chair of the UK Department of Health and Social Care's (DHSC) Joint Committee on Vaccination and Immunisation (JCVI) but does not take part in the JCVI COVID-19 committee. He was a member of WHO SAGE until 2022. AJPs employer, Oxford University has entered into a partnership with AstraZeneca for development of a COVID-19 vaccine. AJP has provided advice to Shionogi & Co., Ltd on development of a COVID19 vaccine

Figures

Figure 1.
Figure 1.. Global genotype prevalence estimates.
Based on assumed acute cases isolated from untargeted sampling frames from 2010 onwards, with known country of origin (total N=9478 genomes). (a) Genotype prevalence by world region, 2010–2020. Countries contributing data are shaded in beige, and are grouped by regions as defined by the UN statistics division. (b) Annual genotype prevalence for countries with ≥50 genomes where typhoid is endemic. In both plots, colours indicate prevalence of Typhi genotypes, as per inset legend. Genotypes not exceeding 20% frequency in at least one country are aggregated as ‘other’. Full data on regional and national genotype prevalences, including raw counts, proportions, and 95% confidence intervals, are given in Supplementary files 5 and 6, respectively.
Figure 1—figure supplement 1.
Figure 1—figure supplement 1.. Genome size pre- and post-filtering, stratified by detection of an IncHI1 plasmid replicon marker.
(a) All assemblies examined (n=13,000). (b) Assemblies of genomes included in the analysis (n=12,965), inclusion criterion being size between 4.5 and 5.5 Mbp.
Figure 1—figure supplement 2.
Figure 1—figure supplement 2.. Annual breakdown of genotypes per world region, 2010–2020, for regions with ≥20 representative genomes.
Bars show genotype prevalence rates observed per annum, coloured as per inset legend. Genotypes present at ≥20% frequency in any country are indicated separately, rare genotypes are aggregated as ‘other’. Full data, including raw counts, proportions, and 95% confidence intervals, are available in Supplementary file 5.
Figure 1—figure supplement 3.
Figure 1—figure supplement 3.. Annual breakdown of genotypes per country, for countries with <50 representative genomes between 2010 and 2020.
(Note plots for countries with ≥50 genomes are shown in Figure 1b, full data including raw counts, proportions, and 95% confidence intervals, are in Supplementary file 6). Bars show genotype prevalence rates observed per annum, coloured as per inset legend. Genotypes present at ≥20% frequency in any country are indicated separately, rare genotypes are aggregated as ‘other’.
Figure 1—figure supplement 4.
Figure 1—figure supplement 4.. Phylogenetic tree showing relationships amongst genotype 2.3.2 genomes.
The tree is a core-genome distance-based neighbour-joining tree generated from assemblies using Pathogenwatch, including n=164 genotype 2.3.2 genomes, outgroup rooted using a diverse set of genomes from Ingle et al., 2021 (n=115 genomes from 16 genotypes). Tips are coloured by world region, according to inset legend; triangles indicate genomes harbouring QRDR mutations resulting in predicted non-susceptibility to ciprofloxacin (CipNS). Clades representing putative local clonal expansions are shaded.
Figure 2.
Figure 2.. Prevalence of key antimicrobial resistance (AMR) genotype profiles by country.
For all countries with ≥50 representative genomes (untargeted, assumed acute cases) from 2010 to 2020, where typhoid is endemic. Percentage resistance values are printed for each country/drug combination, and are coloured by categorical ranges to reflect escalating levels of concern for empirical antimicrobial use: (i) 0: no resistance detected; (ii) >0 and ≤2%: resistance present but rare; (iii) 2–10%: emerging resistance; (iv) 10–50%: resistance common; (v) >50%: established resistance. Annual rates underlying these summary rates are shown in Figure 3 and Supplementary file 8. Full data including counts and confidence intervals are included in Supplementary file 8. MDR, multidrug resistant; XDR, extensively drug resistant; CipNS, ciprofloxacin non-susceptible; CipR, ciprofloxacin resistant; CefR, ceftriaxone resistant; AziR, azithromycin resistant. Countries are grouped by geographical region.
Figure 2—figure supplement 1.
Figure 2—figure supplement 1.. Prevalence of key antimicrobial resistance (AMR) genotype profiles by world region, for non-targeted samples, 2010–2020.
Percentage resistance values are printed for each region/drug combination, and are coloured by categorical ranges to reflect escalating levels of concern for empirical antimicrobial use: (i) 0: no resistance detected; (ii) >0 and ≤2%: resistance present but rare; (iii) 2–10%: emerging resistance; (iv) 10–50%: resistance common; (v) >50%: established resistance. Full data including counts and confidence intervals are in Supplementary file 7. MDR, multidrug resistant; XDR, extensively drug resistant; CipNS, ciprofloxacin non-susceptible; CipR, ciprofloxacin resistant; CefR, ceftriaxone resistant; AziR, azithromycin resistant.
Figure 2—figure supplement 2.
Figure 2—figure supplement 2.. Antimicrobial resistance (AMR) prevalence for non-targeted samples, 2010–2020.
Data are shown only for countries with N≥20 isolates (others are coloured grey). Countries are coloured by the prevalence of resistance per country, as per the inset legend. MDR, multidrug resistant; XDR, extensively drug resistant; CipNS, ciprofloxacin non-susceptible; CipR, ciprofloxacin resistant; CefR, ceftriaxone resistant; AziR, azithromycin resistant.
Figure 2—figure supplement 3.
Figure 2—figure supplement 3.. Annual genotype prevalence amongst multidrug-resistant (MDR) and ciprofloxacin non-susceptible (CipNS) genomes.
For countries with ≥50 representative genomes between 2010 and 2020 and endemic typhoid. Genotypes for (a) MDR and (b) CipNS genomes are coloured according to the inset legends; sensitive genomes of all genotypes are aggregated and coloured grey.
Figure 2—figure supplement 4.
Figure 2—figure supplement 4.. Distribution of fluoroquinolone resistance determinants by genotype.
For selected countries discussed in text. Node size indicates total number of isolates for a given combination of genotype (row) and determinant (column); nodes are coloured to indicate the frequency of the determinant within that genotype. Wt = wildtype; that is, no quinolone resistance determining mutations was detected in gyrA or parC and no plasmid-borne quinolone resistance (qnr) genes were detected.
Figure 2—figure supplement 5.
Figure 2—figure supplement 5.. Ciprofloxacin-resistant genotypes identified.
Rows show all n=24 unique combinations of Typhi genotype, quinolone-resistance determining region (QRDR) mutations (in gyrA, gyrB, parC, see Methods) and acquired plasmid-mediated quinolone resistance (PMQR) genes (qnrB, qnrD, qnrS) identified in genomes that are predicted to result in ciprofloxacin resistance (presence of ≥1 QRDR mutation+≥1 PMQR gene, or presence of ≥3 QRDR mutations).
Figure 3.
Figure 3.. Annual prevalence of key antimicrobial resistance (AMR) profiles.
For countries with ≥3 years with ≥10 representative genomes (untargeted, assumed acute cases) from 2000 to 2020. Data are shown only for country/year combinations with N≥5 isolates. MDR, multidrug resistant; XDR, extensively drug resistant; CipNS, ciprofloxacin non-susceptible; CipR, ciprofloxacin resistant.
Figure 3—figure supplement 1.
Figure 3—figure supplement 1.. Annual prevalence of key antimicrobial resistance (AMR) profiles.
For countries with ≥3 years with ≥10 representative genomes (untargeted, assumed acute cases) from 2000 to 2020 and endemic typhoid. Data are shown only for country/year combinations with N≥5 isolates. MDR, multidrug resistant; XDR, extensively drug resistant; CipNS, ciprofloxacin non-susceptible; CipR, ciprofloxacin resistant; CefR, ceftriaxone resistant; AziR, azithromycin resistant.
Figure 3—figure supplement 2.
Figure 3—figure supplement 2.. Trends in annual frequency of multidrug-resistant (MDR) genomes and proportion of MDR explained by IncHI1 plasmids.
For countries with endemic typhoid and ≥5% MDR prevalence between 2000 and 2020.
Figure 4.
Figure 4.. Phylogenetic tree showing position of 2015 Rwalpindi isolate, Rwp1-PK1, in context with other genomes from Pakistan.
Core-genome distance-based neighbour-joining tree generated in Pathogenwatch, using all genomes from Klemm et al., 2018 (the first genomic characterisation of the extensively drug-resistant [XDR] outbreak clade, including outbreak strains and local context strains from Sindh Province in 2016–2017) and Rasheed et al., 2020 (genomic report of XDR outbreak strains from Lahore in 2019). Tree tips are coloured by genotype, according to inset legend; the 2015 strain Rwp1-PK1 is labelled in the tree and indicated with a triangle. Year of isolation and presence of antimicrobial resistance (AMR) determinants are indicated in the heatmap, according to inset legend.
Figure 5.
Figure 5.. Distribution of azithromycin resistance-associated acrB mutations detected in Typhi genomes.
(a) Temporal distribution of acrB mutants. (b) Distribution of acrB mutants by genotype and mutation. The first acrB mutant appeared in Samoa in 2007. Other mutants have appeared independently across a range of genetic backgrounds, largely in South Asian countries, but remain at low prevalence levels overall (see Figure 2). Country of origin is coloured as per inset label.
Figure 6.
Figure 6.. Annual genotype and antimicrobial resistance (AMR) frequencies by isolating lab, for South Asian countries with multiple data sources.
Labs shown are those with ≥20 isolates; and years shown for each lab are those with N≥5 isolates from that year. (a) Bars are coloured to indicate annual genotype prevalence, as per inset legend. (b) Lines indicate annual frequencies of key AMR profiles, coloured by isolating laboratory as per inset legend. MDR, multidrug resistant; XDR, extensively drug resistant; CipNS, ciprofloxacin non-susceptible; CipR, ciprofloxacin resistant; CefR, ceftriaxone resistant. See Supplementary file 9 for three-letter laboratory code master list.
Figure 6—figure supplement 1.
Figure 6—figure supplement 1.. Genotype prevalence estimated from different data sources, for South Asian countries.
For source laboratories with N≥20 isolates. Lines show 95% confidence interval for each proportion (prevalence) estimate; solid circles highlight the pooled point estimate for national prevalence in each country. Lines are coloured by country as per the inset legend. See Supplementary file 9 for three-letter laboratory code master list.
Figure 6—figure supplement 2.
Figure 6—figure supplement 2.. Antimicrobial resistance (AMR) prevalence estimated from different sources, for South Asian countries.
For source laboratories with N≥20 isolates from which to estimate prevalence. Lines show 95% confidence interval for each proportion (prevalence) estimate; solid circles highlight the pooled point estimate for national prevalence in each country. Lines are coloured by country as per the inset legend. See Supplementary file 9 for three-letter laboratory code master list.
Figure 7.
Figure 7.. Genotype and antimicrobial resistance (AMR) prevalence rates estimated for Nigeria from different data sources.
Data are shown only for source labs with N≥10 isolates from which to estimate prevalence. (a) Genotype prevalence and (b) AMR prevalence, using all available isolates per lab, 2010–2020. Lines show 95% confidence interval for each proportion (prevalence) estimate. Red indicates estimates based on data from individual labs, black indicates pooled estimates (i.e. from all labs), as per inset legend. (c) Annual genotype frequencies. Bars are coloured by genotype as per inset legend. Lab abbreviations are shown in y-axis labels for panels (a–b). MDR, multidrug resistant; XDR, extensively drug resistant; CipNS, ciprofloxacin non-susceptible; CipR, ciprofloxacin resistant; CefR, ceftriaxone resistant; AziR, azithromycin resistant. See Supplementary file 9 for three-letter laboratory code master list.

Update of

  • doi: 10.1101/2022.12.28.22283969

Similar articles

Cited by

References

    1. Achtman M, Van den Broeck F, Cooper KK, Lemey P, Parker CT, Zhou Z, ATCC14028s Study Group Genomic population structure associated with repeated escape of Salmonella enterica ATCC14028s from the laboratory into nature. PLOS Genetics. 2021;17:e1009820. doi: 10.1371/journal.pgen.1009820. - DOI - PMC - PubMed
    1. Ahmad N, Hii SYF, Hashim R, Issa R. Draft Genome sequence of Salmonella enterica serovar Typhi IMR_TP298/15, a strain with intermediate susceptibility to ciprofloxacin, isolated from a Typhoid outbreak. Genome Announcements. 2017;5:e01740-16. doi: 10.1128/genomeA.01740-16. - DOI - PMC - PubMed
    1. Anderson ES. The problem and implications of chloramphenicol resistance in the typhoid bacillus. The Journal of Hygiene. 1975;74:289–299. doi: 10.1017/s0022172400024360. - DOI - PMC - PubMed
    1. Andrews JR, Qamar FN, Charles RC, Ryan ET. Extensively drug-resistant Typhoid — are conjugate vaccines arriving just in time? New England Journal of Medicine. 2018;379:1493–1495. doi: 10.1056/NEJMp1803926. - DOI - PubMed
    1. Argimón S, Nagaraj G, Shamanna V, Sravani D, Vasanth AK, Prasanna A, Poojary A, Bari AK, Underwood A, Kekre M, Baker S, Aanensen DM, Lingegowda RK. Circulation of third-generation cephalosporin resistant Salmonella Typhi in Mumbai, India. Clinical Infectious Diseases. 2021a;74:2234–2237. doi: 10.1093/cid/ciab897. - DOI - PMC - PubMed

Publication types