Review
. 2023 Aug 1;19(2):2251830.
doi: 10.1080/21645515.2023.2251830.

Predictive overfitting in immunological applications: Pitfalls and solutions

Affiliations
Review

Predictive overfitting in immunological applications: Pitfalls and solutions

Jeremy P Gygi et al. Hum Vaccin Immunother. .

Abstract

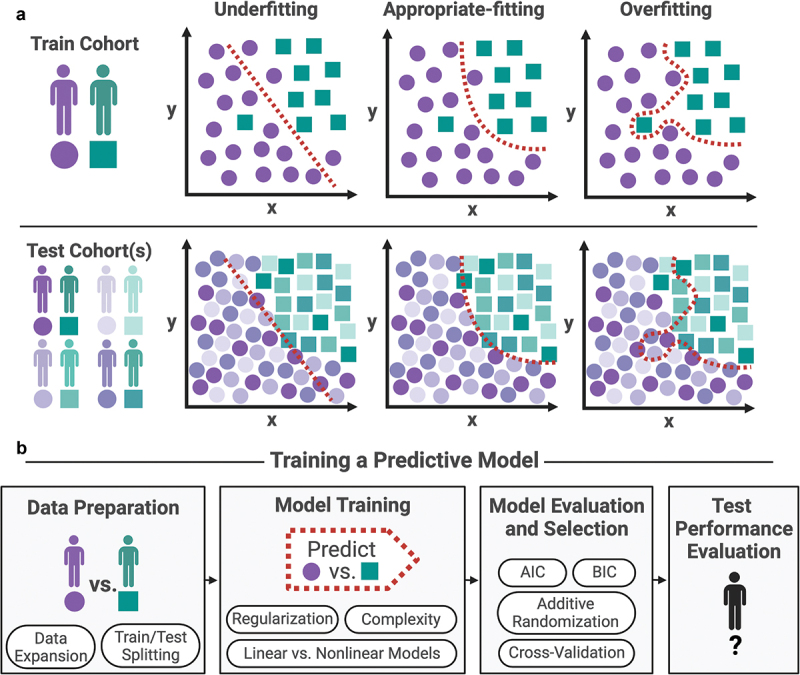
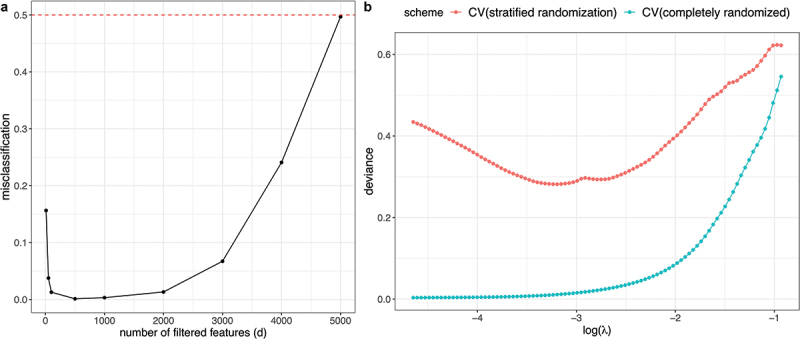
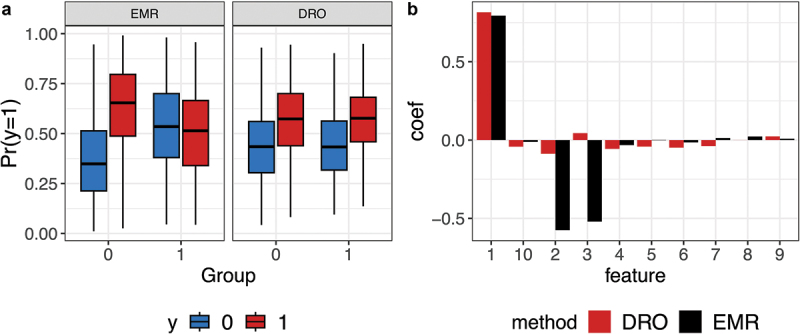
Overfitting describes the phenomenon where a highly predictive model on the training data generalizes poorly to future observations. It is a common concern when applying machine learning techniques to contemporary medical applications, such as predicting vaccination response and disease status in infectious disease or cancer studies. This review examines the causes of overfitting and offers strategies to counteract it, focusing on model complexity reduction, reliable model evaluation, and harnessing data diversity. Through discussion of the underlying mathematical models and illustrative examples using both synthetic data and published real datasets, our objective is to equip analysts and bioinformaticians with the knowledge and tools necessary to detect and mitigate overfitting in their research.

Keywords: Overfitting; data diversity; dimension reduction; distributionally robust optimization; model evaluation; regularization.


Conflict of interest statement

SHK receives consulting fees from Peraton. All other authors declare that they have no competing interests.

Figures

Figure 1.
Figure 1.
(a) Examples of underfitting, appropriate-fitting, and over-fitting a machine learning model to a training cohort. Underfitting oversimplifies the relationship between predictive features whereas over-fitting fails to generalize to novel test cohorts that were not used to train the machine learning model. (b) Schema for effective training of a predictive model, including data preparation, model training, model evaluation and selection, and finally test performance evaluation. Tools for good machine learning practice provided are further explored in the manuscript.
Figure 2.
Figure 2.
Training AUROC and validation AUROC for predicting high/low responders (y-axis) using xgboost against the training rounds (x-axis). It shows the model performances in training or cross-validation as the training rounds increased (increased model complexity) and compares the prediction performance when using trees with depth being 1 (low non-linearity) or 6 (high non-linearity).
Figure 3.
Figure 3.
An illustration workflow of multi-omics dimensionality reduction. (a) Multi-omics assays are profiled from the same cohort, resulting in multi-omics profiles for the same N samples. (b) P biological analytes are condensed via dimensionality reduction into the construction of low-dimensional factors, consisting of factor loadings and factor scores. Factor loadings are coefficients that indicate which biological analytes are contributing to construction of the each factor. (c) All N samples from the cohort are assigned a score for each of the K factors, resulting in the factor scores matrix. (d) The resulting factor scores can be used as machine learning features to predict responses of interest in a prediction model.
Figure 4.
Figure 4.
A comparison of error estimate from additive randomization (denoted as “additive”), AIC, BIC, the true prediction error (denoted as “test”), and training error (denoted as “train”) in example 2. Panels a and B shows the results for β=0 and β=1, respectively as we vary the subset size (s). The prediction performance in this example is not able to be tracked by the training error, AIC or BIC.
Figure 5.
Figure 5.
A) CV evaluation using 1NN with feature filtering as described in example 3. The x-axis shows the number of remaining features after filtering (d) with d=5000 representing no-filtering, and the y-axis shows the misclassification error using CV. The actual test error should be 0.5 (red dashed line), which is much higher than the CV error in the presence of strong filtering (small d). B) CV evaluation with different randomization schemes using the lipidomic breast cancer dataset in example 4. The x-axis shows the logarithm of lasso penalty (λ), and the y-axis is the deviance loss. The achieved deviance when using CV with the stratified randomization grouped by patient id (in red) is considerably higher than that from using CV with the completely randomized scheme (in turquoise).
Figure 6.
Figure 6.
Illustrative example comparing ERM and DRO. Data are generated using example 5 with a signal-to-noise ratio of 1 for the prediction task. There are two groups, with 90% samples from group 1 and 10% from group 2. In the underlying model, the first feature separates the two classes invariantly, but the second and third features have opposite effects on samples from the two groups. A) Boxplots of predicted probability for y=1 using the ERM and the DRO models separately for the two groups. B) Estimated model coefficients (y-axis) for both the DRO and ERM models.

References

    1. Kononenko I. Machine learning for medical diagnosis: history, state of the art and perspective. Artif Intell Med. 2001;23(1):89–11. doi:10.1016/S0933-3657(01)00077-X. - DOI - PubMed
    1. Kourou K, Exarchos TP, Exarchos KP, Karamouzis MV, Fotiadis DI.. Machine learning applications in cancer prognosis and prediction. Comput Struct Biotechnol J. 2015;13:8–17. doi:10.1016/j.csbj.2014.11.005. - DOI - PMC - PubMed
    1. Chaudhary K, Poirion OB, Lu L, Garmire LX. Deep learning–based multi-omics integration robustly predicts survival in liver CancerUsing deep learning to predict liver cancer prognosis. Clin Cancer Res. 2018;24(6):1248–59. doi:10.1158/1078-0432.CCR-17-0853. - DOI - PMC - PubMed
    1. Hagan T, Nakaya HI, Subramaniam S, Pulendran B. Systems vaccinology: enabling rational vaccine design with systems biological approaches. Vaccine. 2015;33(40):5294–301. doi:10.1016/j.vaccine.2015.03.072. - DOI - PMC - PubMed
    1. Fourati S, Tomalin LE, Mulè MP, Chawla DG, Gerritsen B, Rychkov D, Henrich E, Miller HE, Hagan T, Diray-Arce J, et al. Pan-vaccine analysis reveals innate immune endotypes predictive of antibody responses to vaccination. Nat Immunol. 2022;23(12):1777–87. doi:10.1038/s41590-022-01329-5. - DOI - PMC - PubMed

Publication types