. 2023 Nov;102(12):1366-1375.
doi: 10.1177/00220345231192381. Epub 2023 Sep 12.

Increased STAT3 Activation in Periodontitis Drives Inflammatory Bone Loss

Affiliations

Increased STAT3 Activation in Periodontitis Drives Inflammatory Bone Loss

M Arce et al. J Dent Res. 2023 Nov.

Abstract

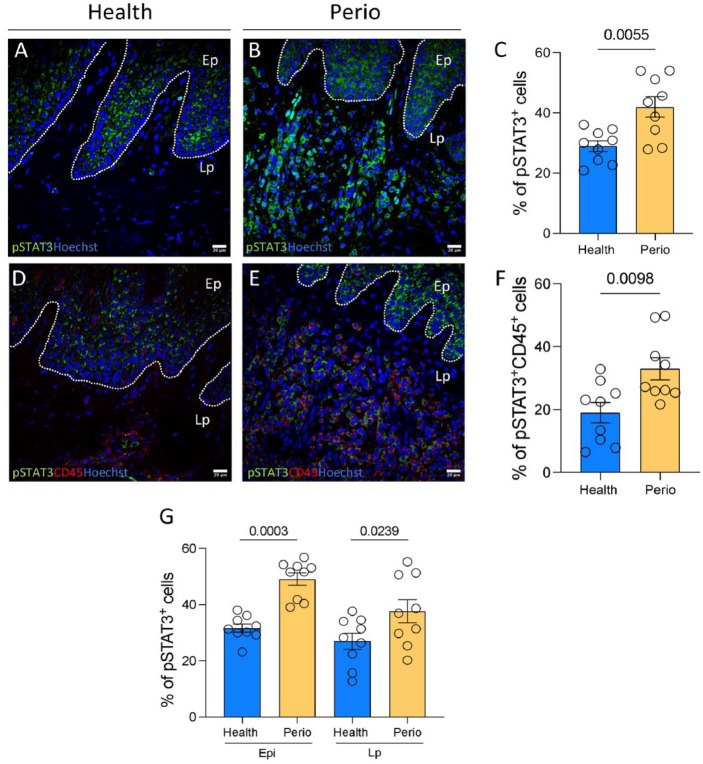
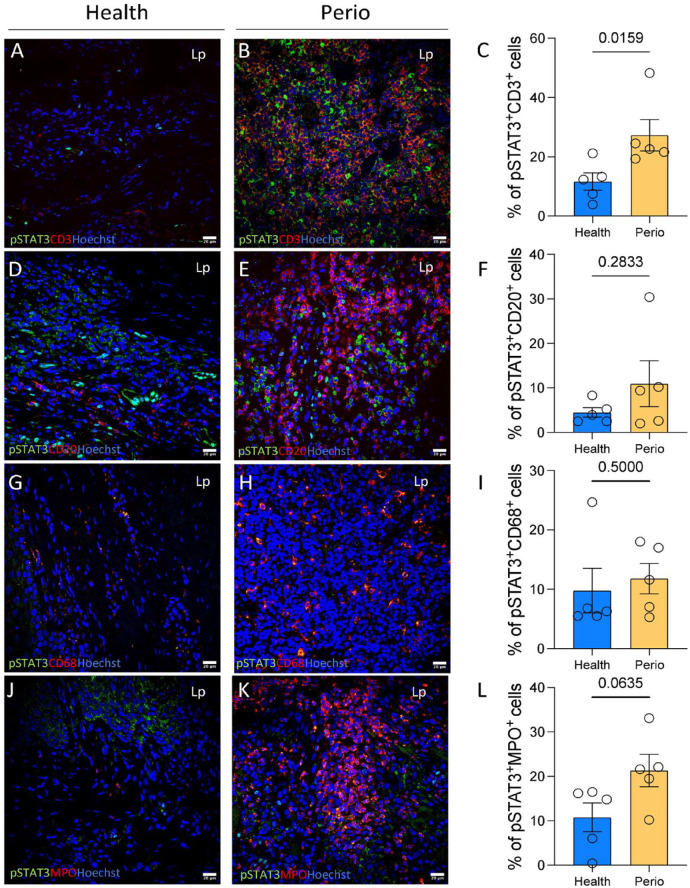
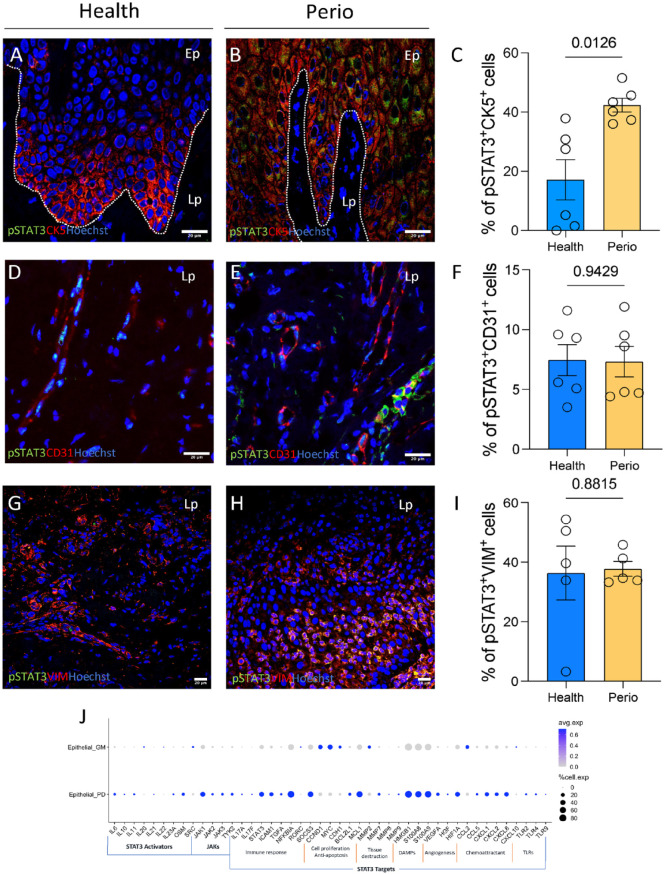
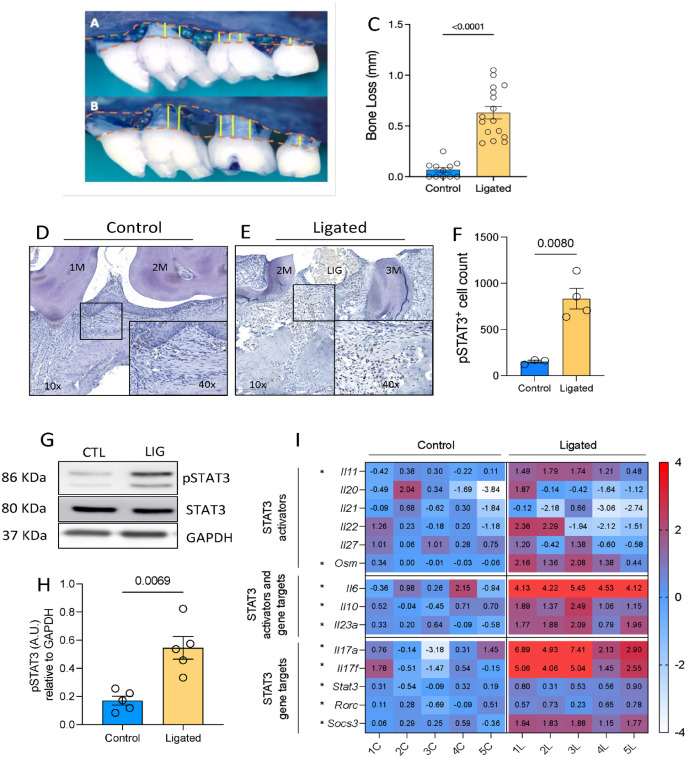
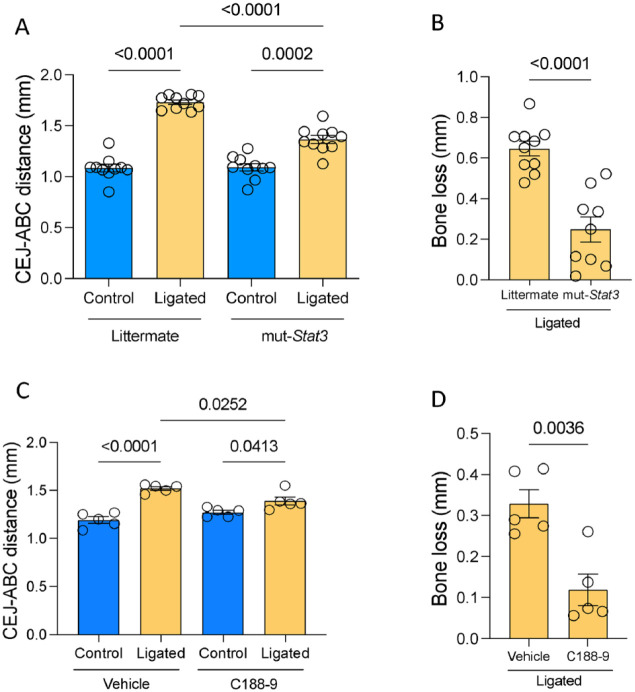
Periodontitis is one of the most prevalent human inflammatory diseases. It is characterized by periodontal tissue destruction, progressively driven by the host response. In this regard, cytokines associated with tissue destruction, such as interleukin (IL)-6 and IL-23, use a common signaling pathway mediated by STAT3. This transcription factor is also needed for IL-17A production, a key mediator in periodontitis pathogenesis. Although several studies have reported increased activation of STAT3 in experimental periodontitis, a detailed characterization of STAT3 activation in human gingival tissues and its involvement in alveolar bone loss has yet to be explored. Using a cross-sectional study design, we detected increased proportions of pSTAT3-positive cells during periodontitis compared with health, particularly in epithelial cells and T cells. Other cell types of hematopoietic and nonhematopoietic origin also display STAT3 activation in gingival tissues. We detected increased STAT3 phosphorylation and expression of STAT3-related genes during experimental periodontitis. Next, we evaluated the role of STAT3 in alveolar bone destruction using a mouse model of STAT3 loss of function (mut-Stat3 mice). Compared with controls, mut-Stat3 mice had reduced alveolar bone loss following ligature-induced periodontitis. We also evaluated pharmacologic inhibition of STAT3 in ligature-induced periodontitis. Like mut-Stat3 mice, mice treated with STAT3 small-molecule inhibitor had reduced bone loss compared with controls. Our results demonstrate that STAT3 activation is increased in epithelial and T cells during periodontitis and indicate a pathogenic role of STAT3 in inflammatory alveolar bone loss.

Keywords: gingiva; inflammation; mouth mucosa; mucosal immunity; periodontal diseases; signal transduction.


Conflict of interest statement

Declaration of Conflicting InterestsThe authors declared no potential conflicts of interest with respect to the research, authorship, and/or publication of this article.

Figures

Figure 1.
Figure 1.
Increased activation of STAT3 during periodontitis in human gingival tissues. (A) Phospho-STAT3 (pSTAT3)–positive cells (green) in clinically healthy gingival tissues (Health). (B) pSTAT3-positive cells in clinically inflamed gingival tissues from subjects diagnosed with periodontitis (Perio). (C) Bar graph representing the mean percentage of pSTAT3-positive cells in gingival tissues from a group of subjects with periodontal health or diagnosed with periodontitis (Perio), Welch’s t test. (D) CD45 (red) and pSTAT3 (green)–positive cells in clinically healthy human gingival tissues. (E) CD45 (red) and pSTAT3 (green)–positive cells in clinically inflamed gingival tissues from subjects diagnosed with periodontitis (Perio). (F) Bar graph representing the mean percentage of CD45 and pSTAT3 double-positive cells in gingival tissues from a group of subjects with periodontal health or diagnosed with periodontitis (Perio), Welch’s t test. (G) Bar graph representing the mean percentage of pSTAT3-positive cells in epithelial (Epi) and lamina propria (Lp) in gingival tissues from a group of subjects with periodontal health or diagnosed with periodontitis (Perio), Ordinary 1-way analysis of variance. In the graphs, each circle represents an individual (n = 9 per group), and the error bars depict the standard error of the mean (SEM). The percentages of positive cells were calculated by obtaining the total cell numbers (in blue, due to Hoechst 33342 stain) and the numbers of positive cells (in green or in green and red) per field using Cellprofiler™ software. The scale bar is 20 µm, confocal image using a 40× objective lens. The white line split the image between the epithelium (Ep) and lamina propia (Lp).
Figure 2.
Figure 2.
Activation of STAT3 in gingival cells of hematopoietic origin. (A–B) Phospho-STAT3 (pSTAT3)–positive cells (green) and CD3+ cells (red) in clinically healthy (A) or periodontitis-affected (B) human gingival tissues. (C) Bar graph representing the mean percentage of CD3 and pSTAT3 double-positive cells in gingival tissues from a group of subjects with periodontal health or diagnosed with periodontitis (Perio), Mann-Whitney test. (D–E) pSTAT3+ cells (green) and CD20+ cells (red) in clinically healthy (D) or periodontitis-affected (E) human gingival tissues. (F) Bar graph representing the mean percentage of CD20 and pSTAT3 double-positive cells in gingival tissues from periodontally healthy (Health) or periodontitis (Perio) diagnosed individuals, Welch’s t test. (G–H) pSTAT3+ cells (green) and CD68+ cells (red) in clinically healthy (G) or periodontitis-affected (H) human gingival tissues. (I) Bar graph representing the mean percentage of CD68 and pSTAT3 double-positive cells in gingival tissues from periodontally healthy (Health) or periodontitis (Perio) diagnosed individuals, Mann-Whitney test. (J–K) pSTAT3+ cells (green) and MPO+ cells (red) in clinically healthy (J) or periodontitis-affected (K) human gingival tissues. (L) Bar graph representing the mean percentage of MPO and pSTAT3 double-positive cells in gingival tissues from periodontally healthy (Health) or periodontitis (Perio) diagnosed individuals, Welch’s t test. Each circle represents an individual on the graphs (n = 5 per group), and the error bars depict the standard error of the mean (SEM). Percentages of positive cells were calculated by obtaining the total cell numbers (in blue, due to Hoechst 33342 stain) and the numbers of double-positive cells (in green and red) per field using Cellprofiler™ software. The scale bar is 20 µm, confocal image using a 40× objective lens. All images show lamina propia (Lp).
Figure 3.
Figure 3.
Activation of STAT3 in gingival cells of nonhematopoietic origin. (A, B) Phospho-STAT3 (pSTAT3)–positive cells (green) and cytokeratin-5 (CK5)–positive cells (red) in clinically healthy (A) or periodontitis-affected (B) human gingival tissues. (C) Bar graph representing the mean percentage of CK5 and pSTAT3 double-positive cells in gingival tissues from a group of subjects with periodontal health or diagnosed with periodontitis (Perio), Welch’s t test. (D, E) pSTAT3+ cells (green) and CD31+ cells (red) in clinically healthy (D) or periodontitis-affected (E) human gingival tissues. (F) Bar graph representing the mean percentage of CD31 and pSTAT3 double-positive cells in gingival tissues from periodontally healthy (Health) or periodontitis (Perio) diagnosed individuals, Welch’s t test. (G, H) pSTAT3+ cells (green) and vimentin (VIM)–positive cells (red) in clinically healthy (G) or periodontitis-affected (H) human gingival tissues. (I) Bar graph representing the mean percentage of VIM and pSTAT3 double-positive cells in gingival tissues from periodontally healthy (Health) or periodontitis (Perio) diagnosed individuals, Welch’s t test. (J) Dot plot depicting the normalized and scaled average expression of genes and percentage of expressing cells for genes related to the STAT3 pathway in gingival epithelial cells from health (GM) and periodontitis (PD). In the C, F, and I graphs, each circle represents an individual (n = 5 per group), and the error bars depict the standard error of the mean (SEM). The percentages of positive cells were calculated by obtaining the total cell numbers (in blue, due to Hoechst 33342 stain) and the numbers of double-positive cells (in green and red) per field using Cellprofiler™ software. The scale bar is 20 µm, confocal image using a 40× objective lens (G, H zoom 0.5). The white line splits the image between the epithelium (Ep) and lamina propria (Lp).
Figure 4.
Figure 4.
Activation of STAT3 and expression of STAT3-related genes in ligature-induced periodontitis. (A, B) Cementoenamel junction (CEJ) and alveolar bone crest (ABC) are depicted in orange dashed lines on the palatal surface of nonligated (A) and ligated (B) maxillae. To calculate bone loss, the distance from 6 predetermined sites (vertical yellow lines) was obtained. (C) Bar graph representing the bone loss (in mm) in the nonligated (control; n = 11) and after the ligature-induced periodontitis model (ligated; n = 16), Welch’s t test. (D, E) pSTAT3+ cells (brown) in mice periodontal tissues from nonligated (control) (D) or ligature-induced periodontitis model (ligated) (E). We observed interproximal areas on the first (1M), second (2M), and third (3M) molar. Pictures were obtained using 10× and 40× objective lenses. (F) Bar graph representing the mean count of pSTAT3-positive cells in gingival tissues from control (n = 3) and ligature-induced periodontitis mice (ligated; n = 4), Welch’s t test. The total count of cells was obtained using the Fiji Software from an area of 1.75 mm2 in each picture. (G) Phospho-STAT3 (pSTAT3), STAT3, and GAPDH immunoblots from mice gingival tissues during the ligature-induced periodontitis model (LIG) and their nonligated control (CTL). (H) Bar graph representing the mean level of pSTAT3 in mice gingival tissues at steady state (control) and during the ligature-induced periodontitis model (ligated), Welch’s t test. Levels were obtained by densitometry and expressed as arbitrary units relative to GAPDH (I) Heat map representing the expression of genes associated with STAT3 during homeostasis (control) and experimental periodontitis (ligated). Each column on the figure represents a sample, and on the rows the genes are analyzed. Asterisks indicate genes with differences in their expression (P < 0.05). Colors and numbers represent the Log2 fold-change for each gene. On the graphs, each circle represents a sample, and the error bars depict the standard error of the mean (SEM).
Figure 5.
Figure 5.
Decreased ligature-induced alveolar bone destruction in mice with STAT3 loss of function and pharmacologically inhibited STAT3. (A) Bar graph depicting the CEJ-ABC distance (in mm) littermate wild-type and mut-Stat3 mice, Brown-Forsythe and Welch ANOVA test, corrected for multiple comparisons with Dunnett’s T3 test. (B) Bar graph representing the bone loss (in mm) after ligature-induced periodontitis model in littermate wild-type and mut-Stat3 mice, Welch’s t test. (C) Bar graph indicating the CEJ-ABC distance (in mm) from control and ligature-induced periodontitis (Ligated) mice after vehicle or C188-9 (inhibitor) treatment, Brown-Forsythe and Welch ANOVA test, corrected for multiple comparisons with Dunnett’s T3 test. (D) Bar graph representing the bone loss (in mm) after ligature-induced periodontitis model in mice treated with vehicle or C188-9 (inhibitor), Welch’s t test. Each circle represents an individual on the graphs, and the error bars depict the standard error of the mean (SEM).

Similar articles

Cited by

References

    1. Abe T, Hajishengallis G. 2013. Optimization of the ligature-induced periodontitis model in mice. J Immunol Methods. 394(1–2):49–54. - PMC - PubMed
    1. Abusleme L, Diaz PI, Freeman AF, Greenwell-Wild T, Brenchley L, Desai JV, Ng WI, Holland SM, Lionakis MS, Segre JA, et al.. 2018. Human defects in STAT3 promote oral mucosal fungal and bacterial dysbiosis. JCI Insight. 3(17):e122061. - PMC - PubMed
    1. Abusleme L, Hoare A, Hong BY, Diaz PI. 2021. Microbial signatures of health, gingivitis, and periodontitis. Periodontol 2000. 86(1):57–78. - PubMed
    1. Aggor FEY, Break TJ, Trevejo-Nuñez G, Whibley N, Coleman BM, Bailey RD, Kaplan DH, Naglik JR, Shan W, Shetty AC, et al.. 2020. Oral epithelial IL-22/STAT3 signaling licenses IL-17-mediated immunity to oral mucosal candidiasis. Sci Immunol. 5(48):eaba0570. - PMC - PubMed
    1. Ambili R, Janam P, Saneesh Babu PS, Prasad M, Vinod D, Anil Kumar PR, Kumary TV, Asha Nair S. 2017. Differential expression of transcription factors NF-κB and STAT3 in periodontal ligament fibroblasts and gingiva of healthy and diseased individuals. Arch Oral Biol. 82:19–26. - PubMed

Publication types

MeSH terms

LinkOut - more resources