. 2023 Nov 1;325(5):G471-G491.
doi: 10.1152/ajpgi.00090.2023. Epub 2023 Sep 12.

P2Y2 purinergic receptor gene deletion protects mice from bacterial endotoxin and sepsis-associated liver injury and mortality

Affiliations

P2Y2 purinergic receptor gene deletion protects mice from bacterial endotoxin and sepsis-associated liver injury and mortality

Athis R Arunachalam et al. Am J Physiol Gastrointest Liver Physiol. .

Abstract

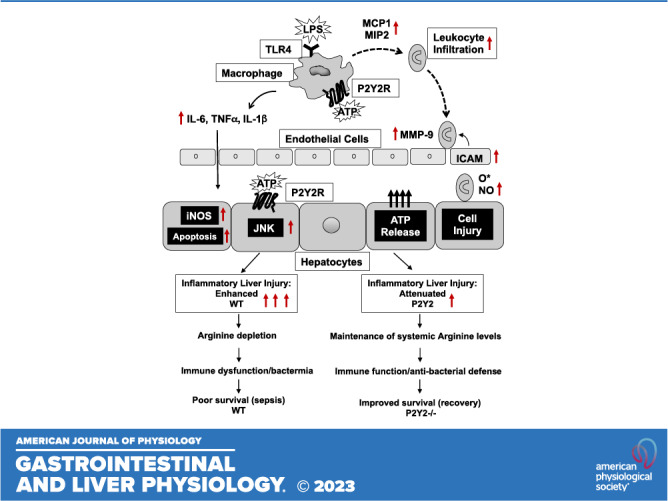
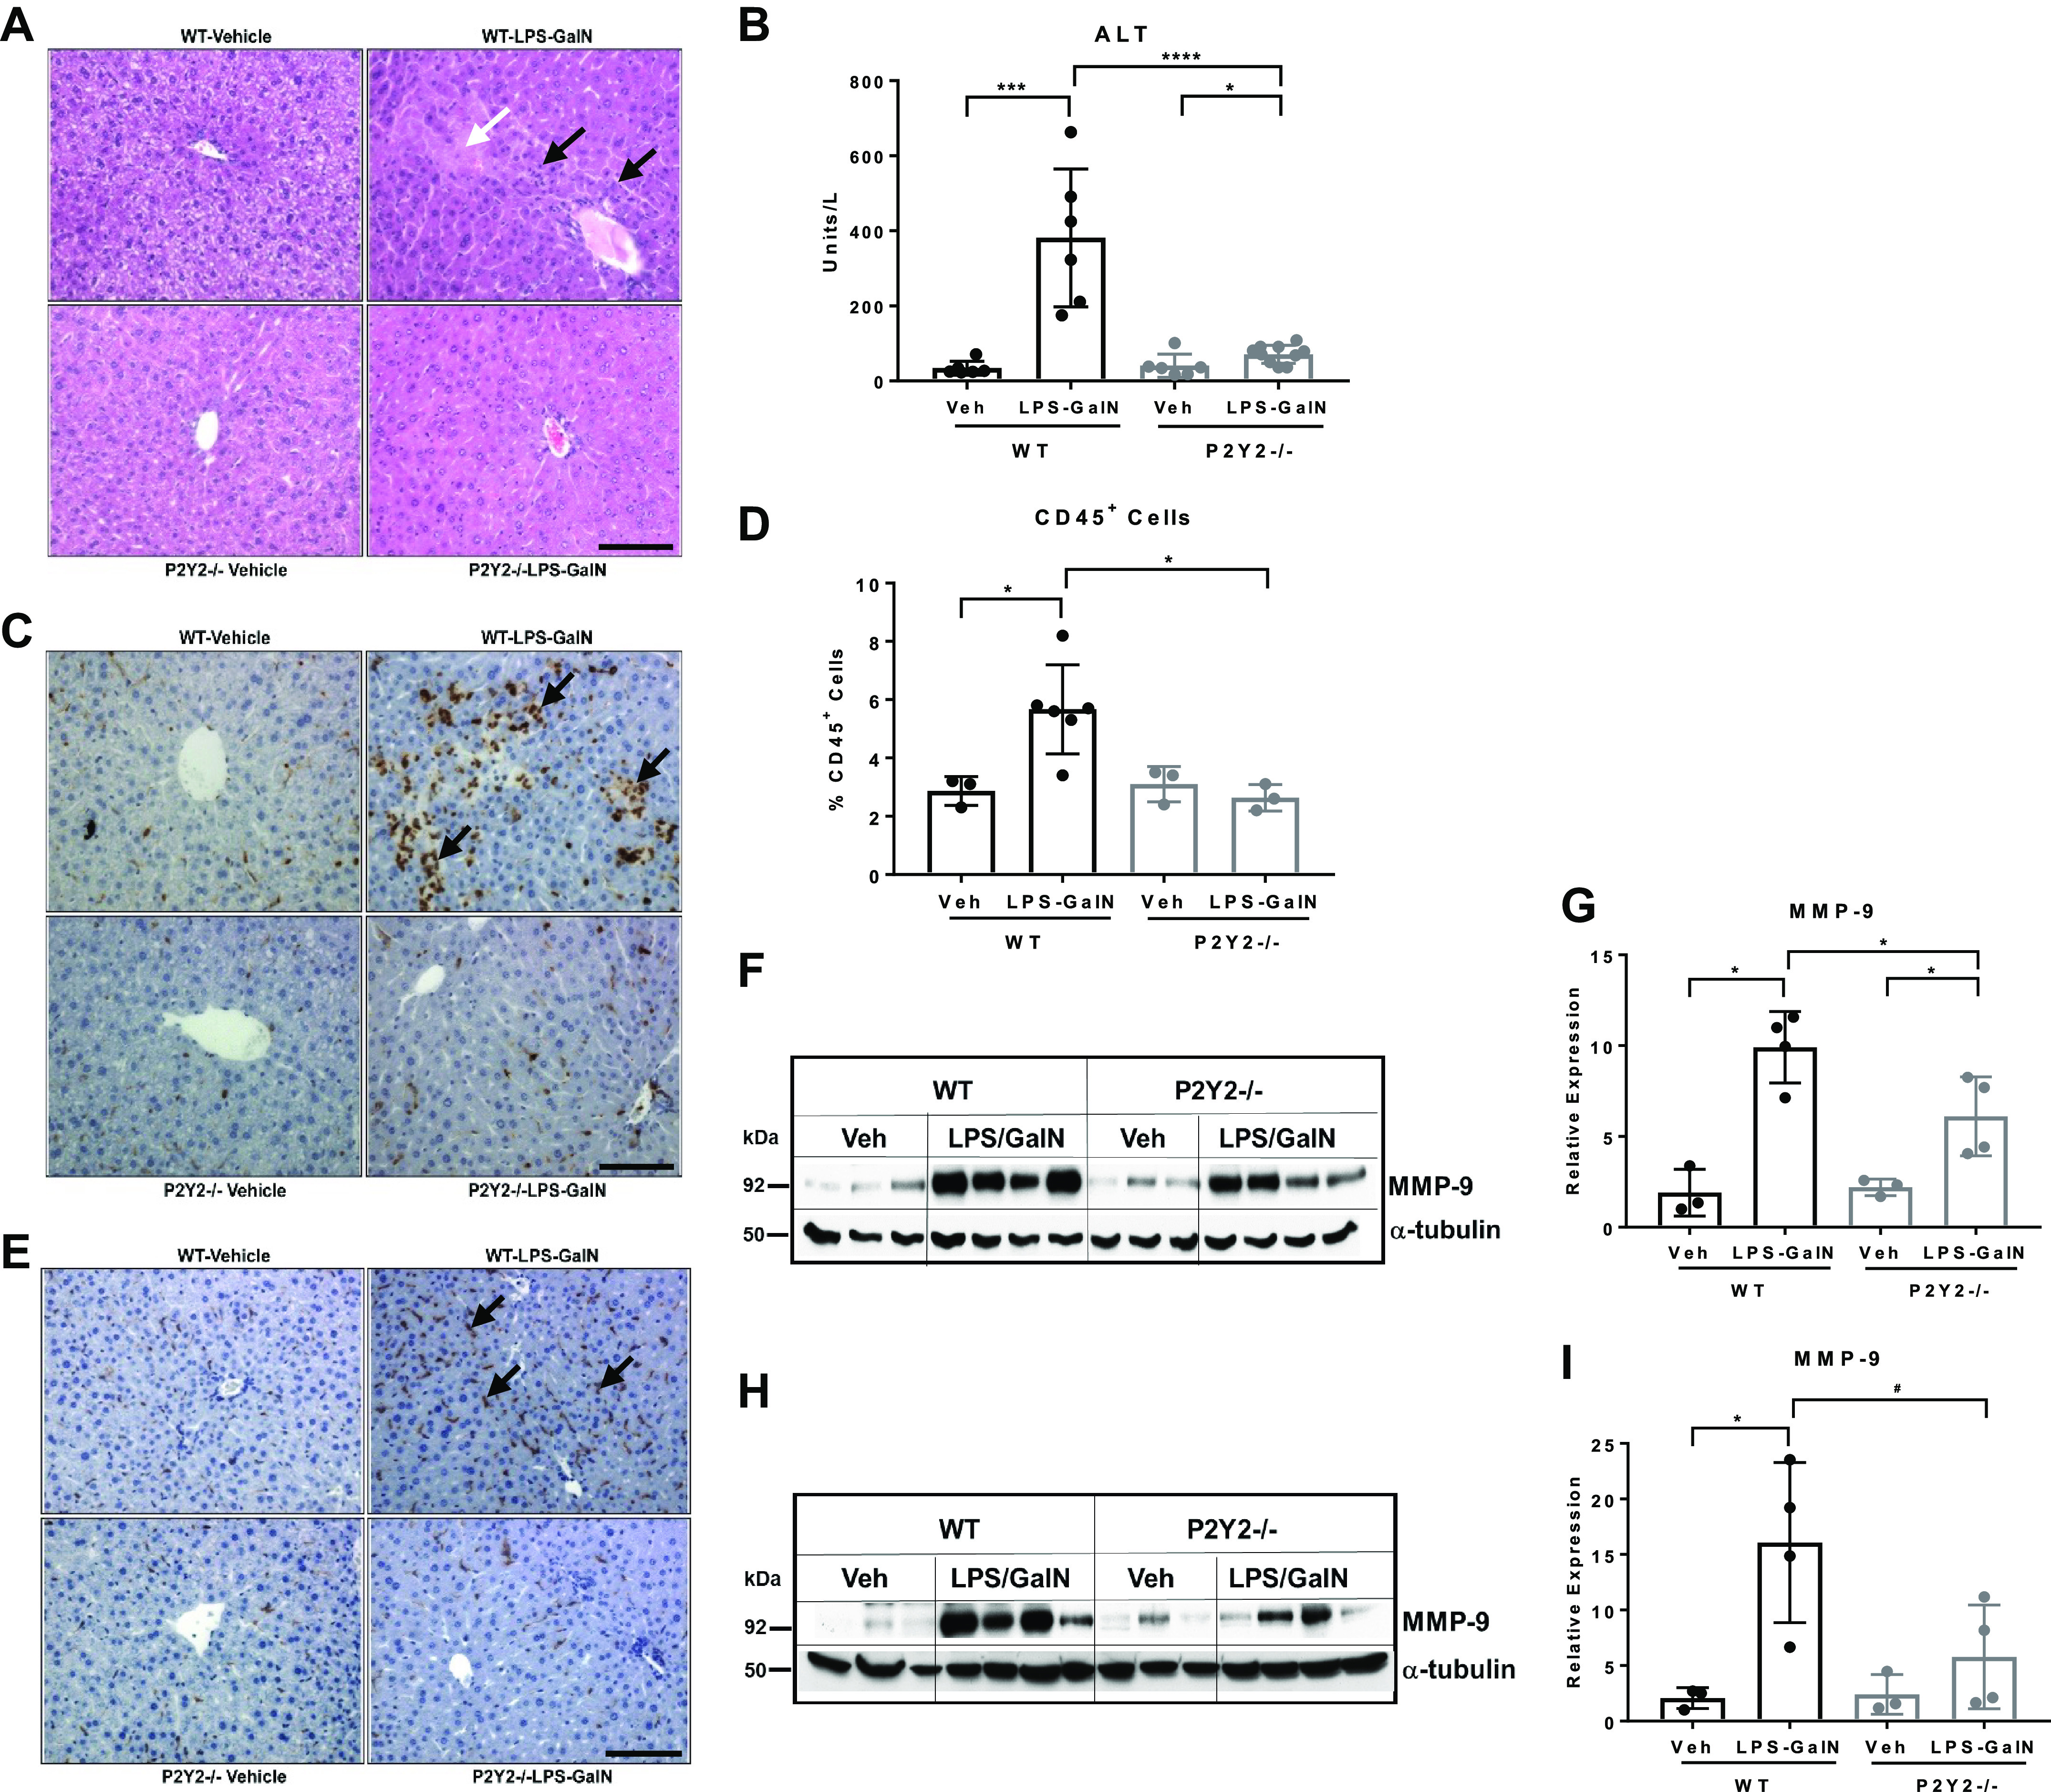
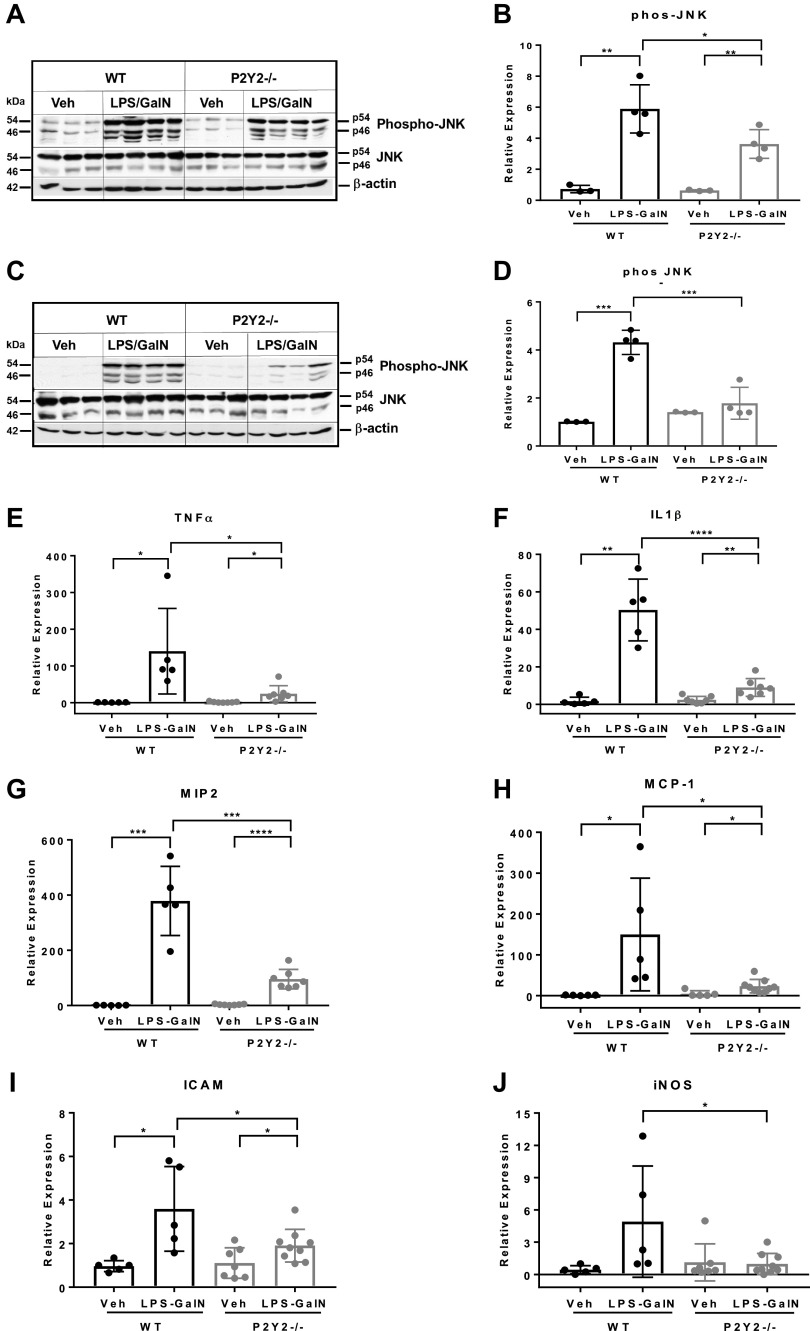
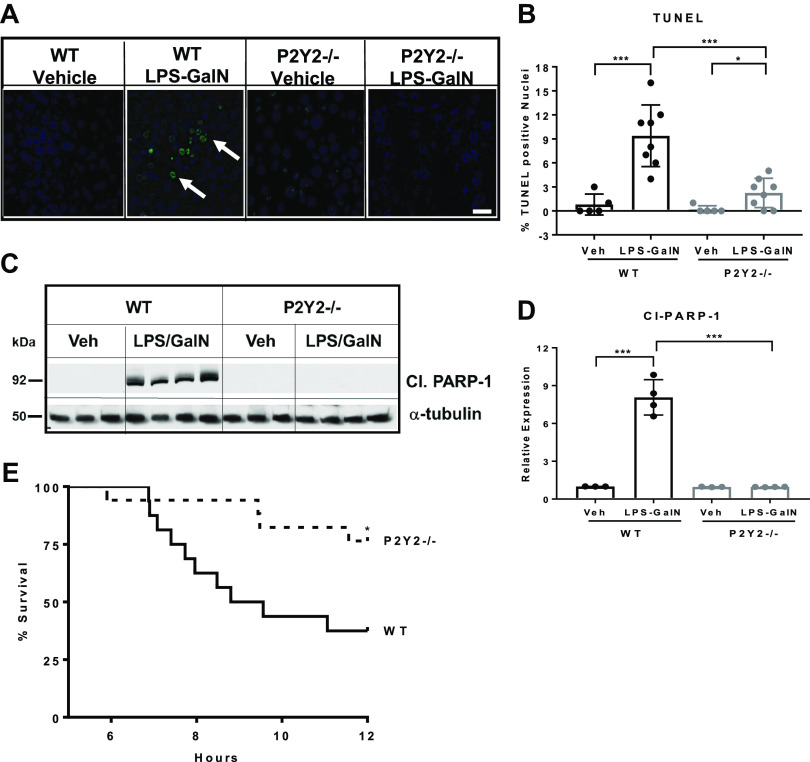
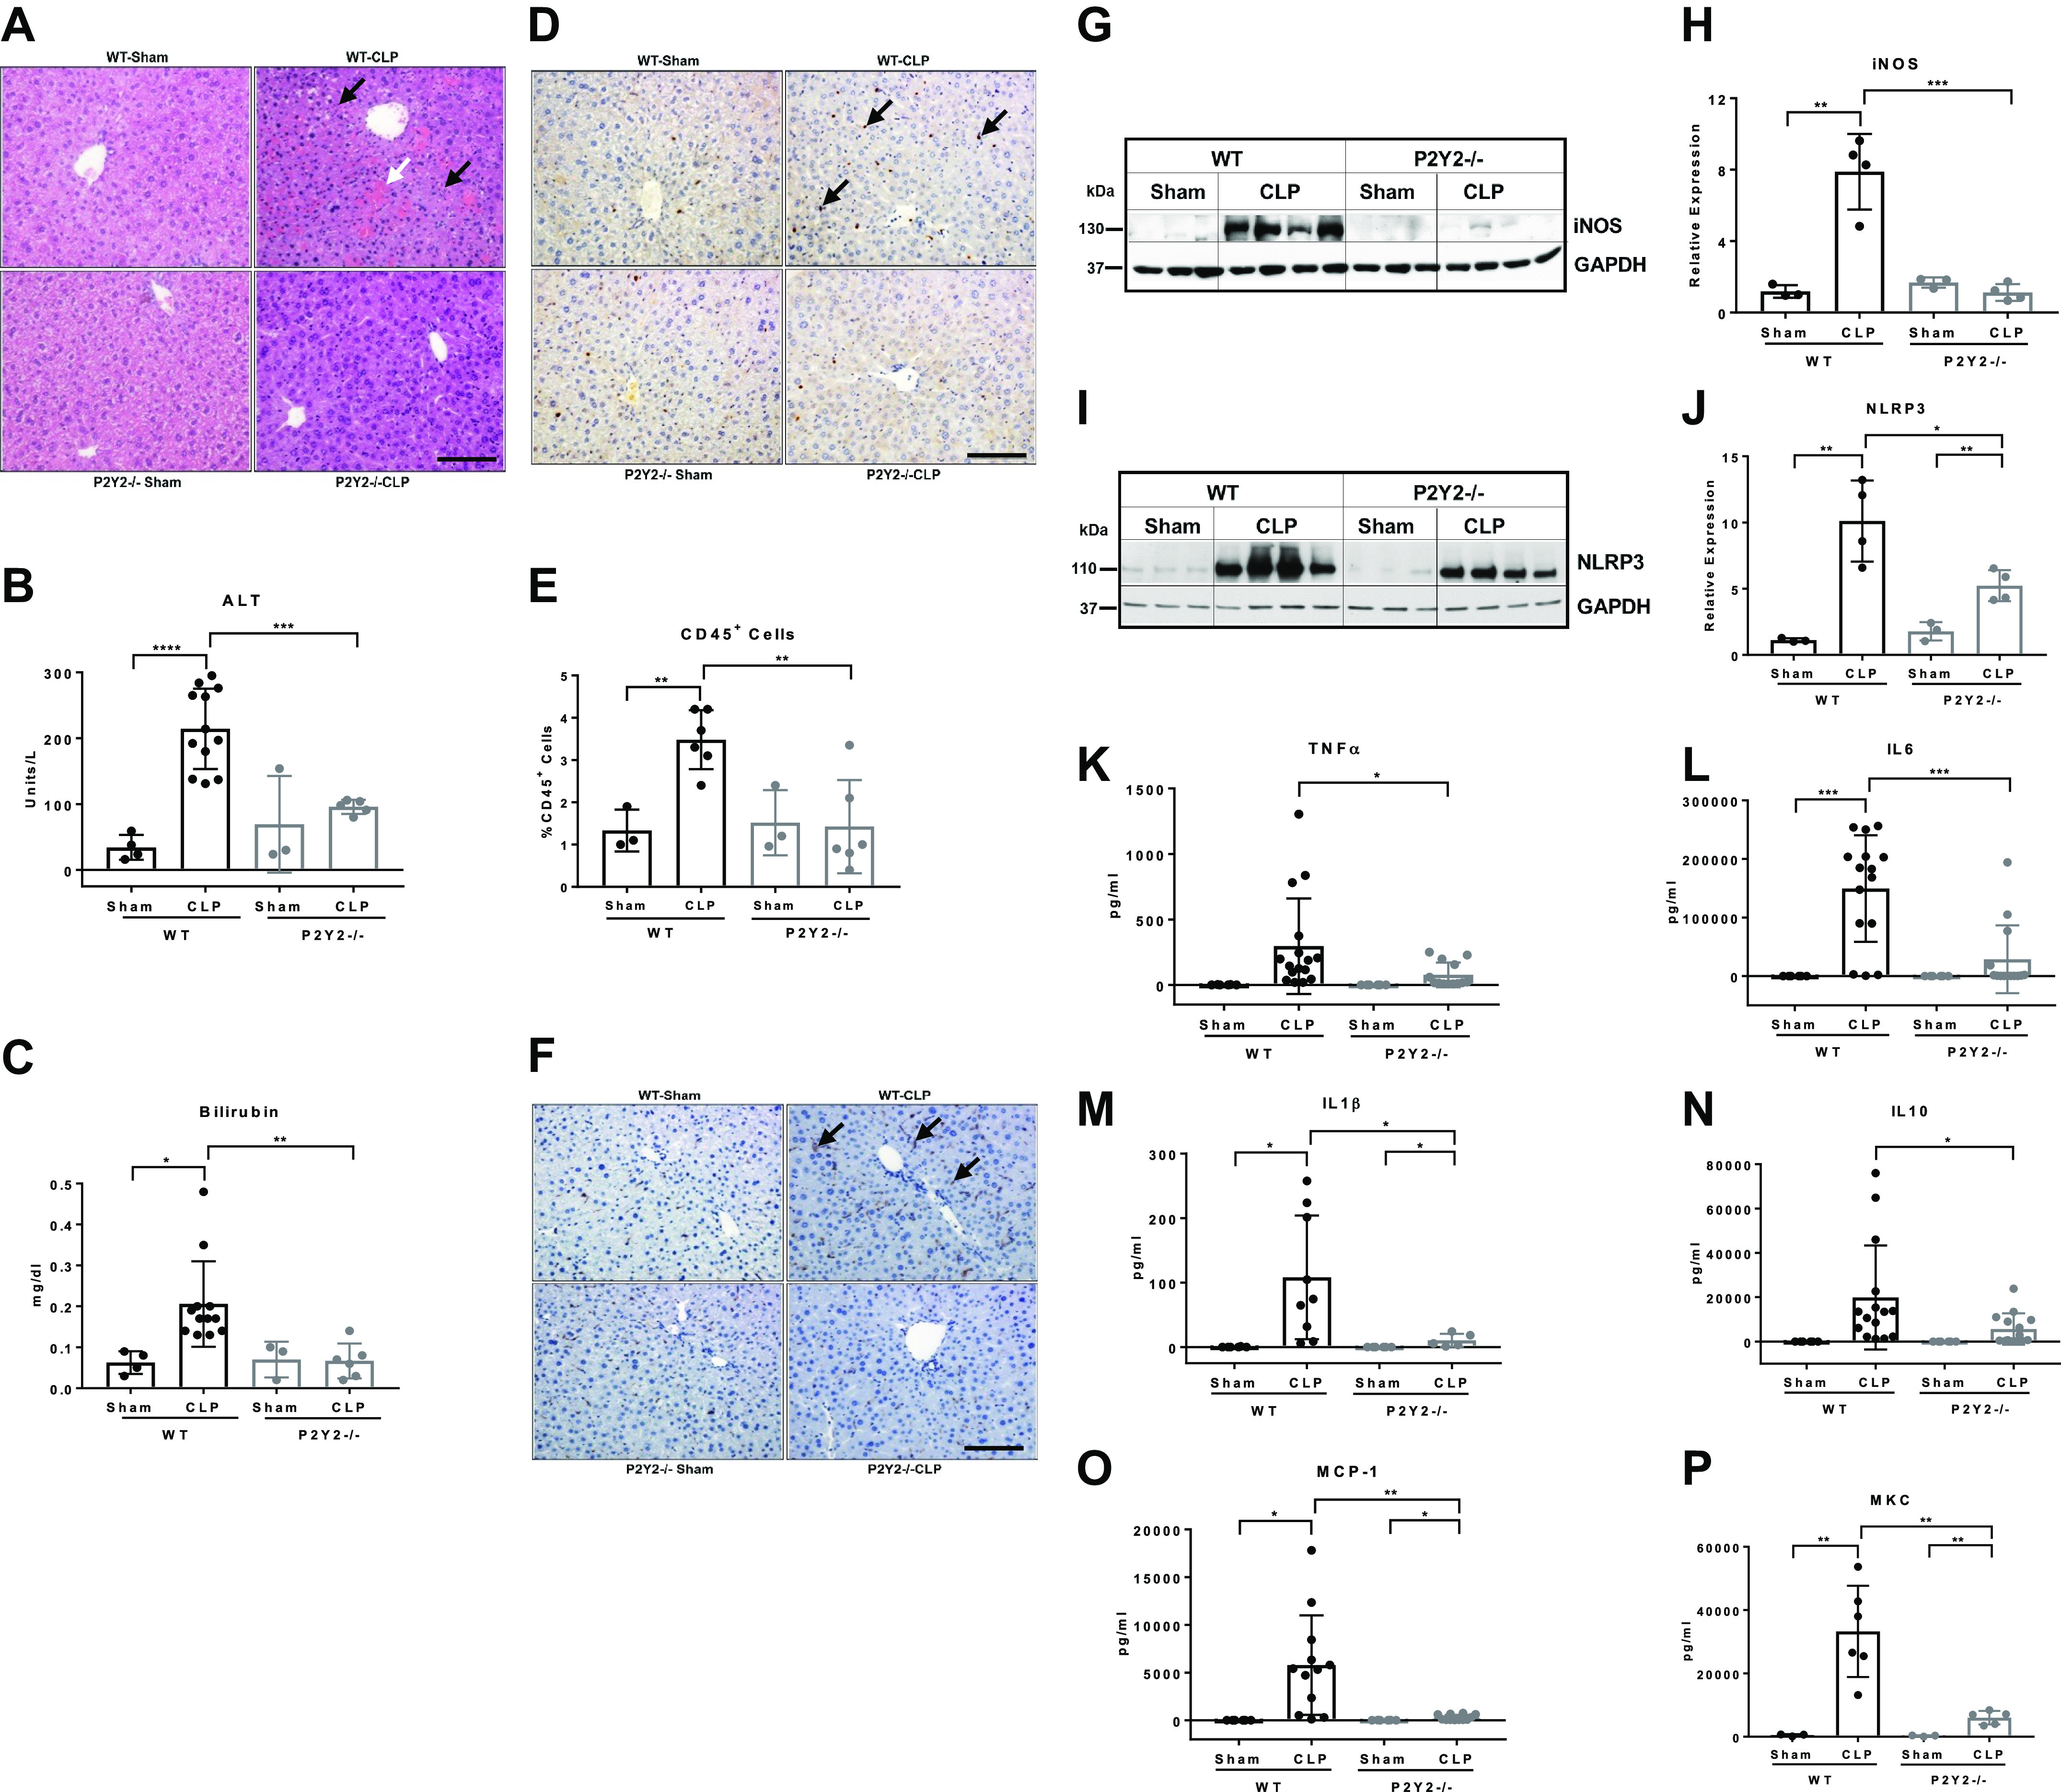
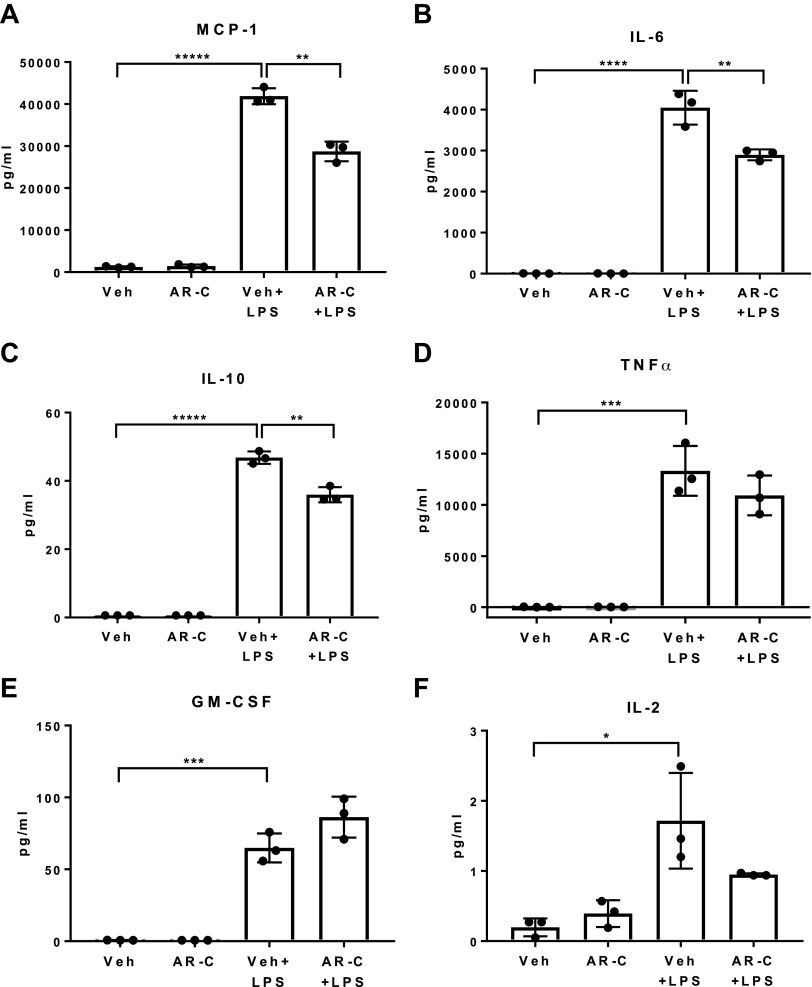
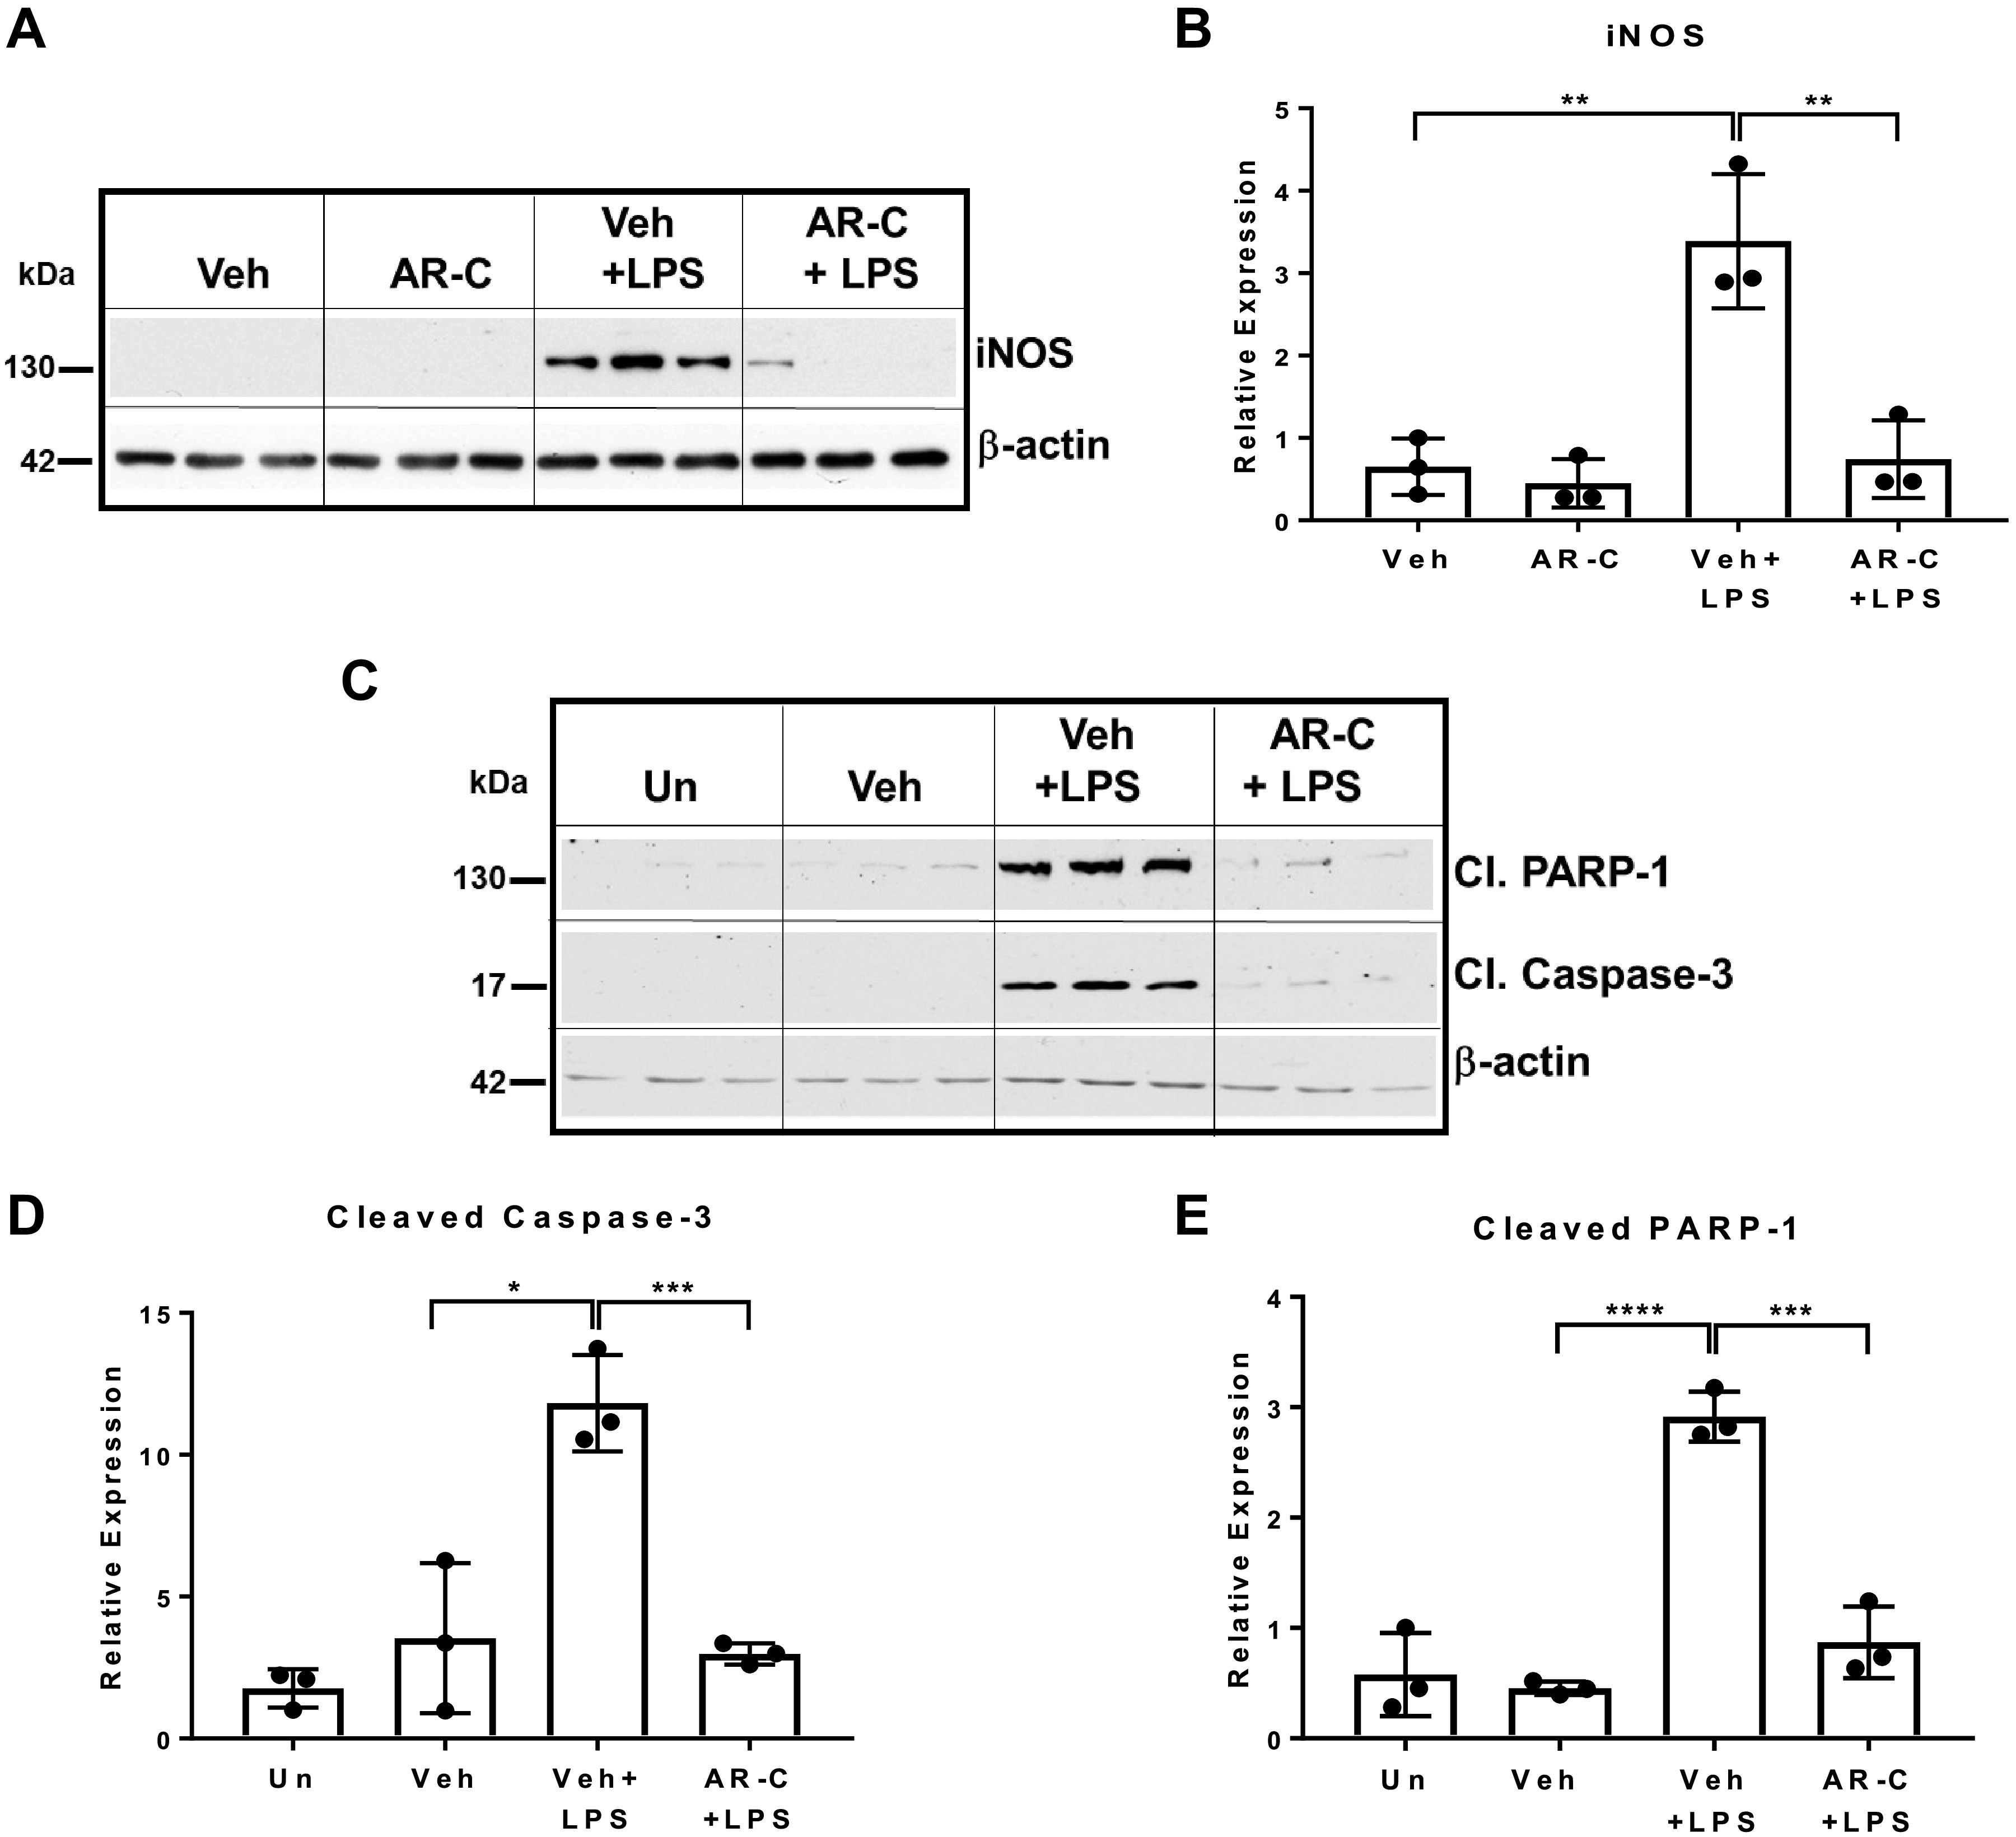
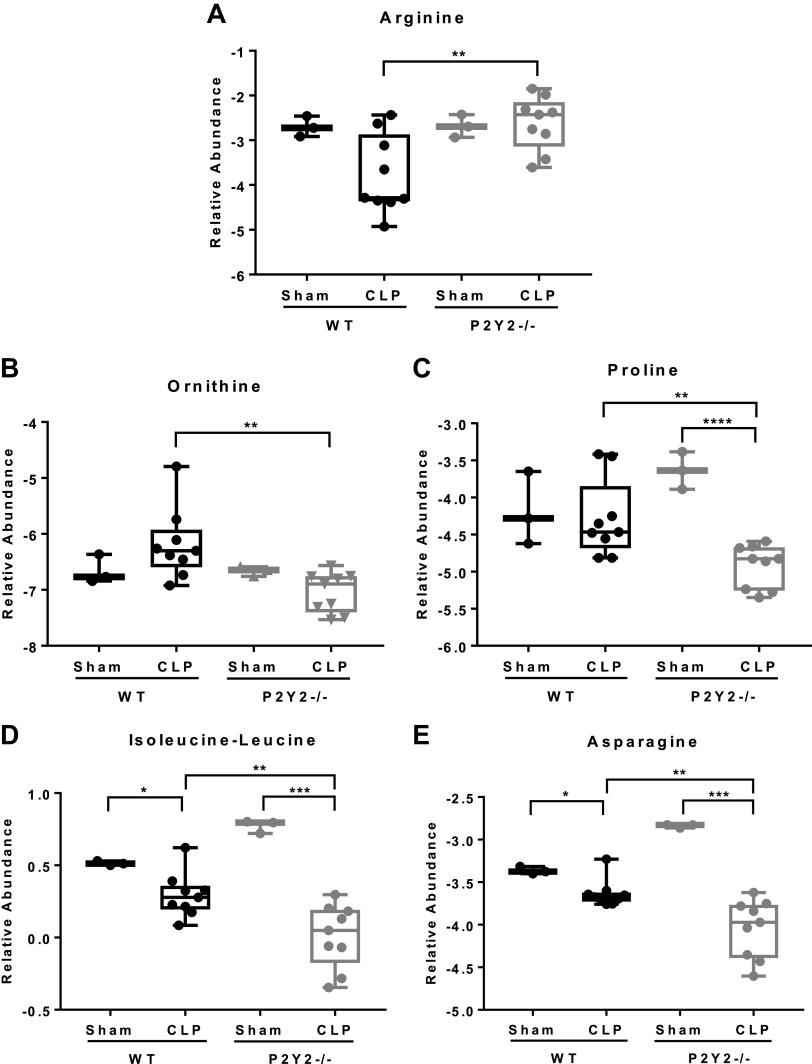
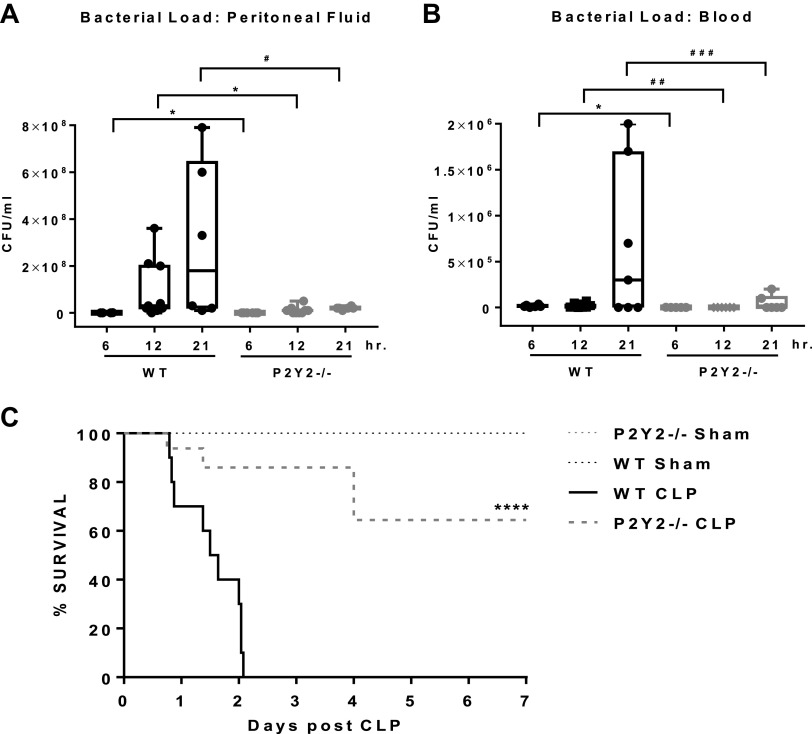
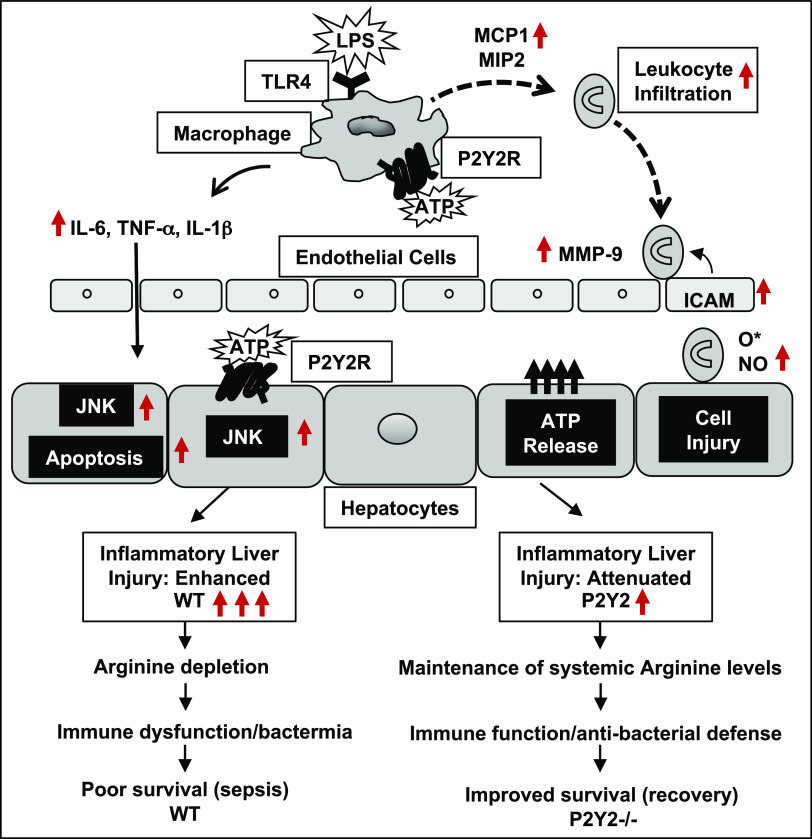
The liver plays a significant role in regulating a wide range of metabolic, homeostatic, and host-defense functions. However, the impact of liver injury on the host's ability to control bacteremia and morbidity in sepsis is not well understood. Leukocyte recruitment and activation lead to cytokine and chemokine release, which, in turn, trigger hepatocellular injury and elevate nucleotide levels in the extracellular milieu. P2Y2 purinergic receptors, G protein-coupled and activated by extracellular ATP/UTP, are expressed at the cell surface of hepatocytes and nonparenchymal cells. We sought to determine whether P2Y2 purinergic receptor function is necessary for the maladaptive host response to bacterial infection and endotoxin-mediated inflammatory liver injury and mortality in mice. We report that P2Y2 purinergic receptor knockout mice (P2Y2-/-) had attenuated inflammation and liver injury, with improved survival in response to LPS/galactosamine (LPS/GalN; inflammatory liver injury) and cecal ligation and puncture (CLP; polymicrobial sepsis). P2Y2-/- livers had attenuated c-Jun NH2-terminal kinase activation, matrix metallopeptidase-9 expression, and hepatocyte apoptosis in response to LPS/GalN and attenuated inducible nitric oxide synthase and nucleotide-binding oligomerization domain, leucine-rich repeat and pyrin domain containing 3 protein expression in response to CLP. Implicating liver injury in the disruption of amino acid homeostasis, CLP led to lower serum arginine and higher bacterial load and morbidity in the WT mice, whereas serum arginine levels were comparable to sham-operated controls in P2Y2-/- mice, which had attenuated bacteremia and improved survival. Collectively, our studies highlight the pathophysiological relevance of P2Y2 purinergic receptor function in inflammatory liver injury and dysregulation of systemic amino acid homeostasis with implications for sepsis-associated immune dysfunction and morbidity in mice.NEW & NOTEWORTHY Our studies provide experimental evidence for P2Y2 purinergic receptor-mediated potentiation of inflammatory liver injury, morbidity, and mortality, in two well-established animal models of inflammatory liver injury. Our findings highlight the potential to target P2Y2 purinergic signaling to attenuate the induction of "cytokine storm" and prevent its deleterious consequences on liver function, systemic amino acid homeostasis, host response to bacterial infection, and sepsis-associated morbidity and mortality.

Keywords: P2Y2 purinergic receptor; bacteremia; inflammation; liver injury; sepsis.


Conflict of interest statement

No conflicts of interest, financial or otherwise, are declared by the authors.

Figures

None
Graphical abstract
Figure 1.
Figure 1.
LPS/GalN-mediated acute liver injury is attenuated in P2Y2−/− mice. WT and P2Y2−/− mice treated with LPS (100 µg/kg) and galactosamine (GalN, 700 mg/kg) or saline (Veh) for 1 and 5 h. A: representative H&E-stained liver sections (×20 field of view). White arrow points to the necrotic lesion and black arrows point to leukocyte infiltration within hepatic parenchyma. Black scale bar, 100 µm. B: serum ALT (n, WT-Veh, 5, WT-LPS/GalN, 5; P2Y2-Veh, 7; P2Y2-LPS/GalN, 11). C: representative liver sections stained for CD45+ leukocytes (×20 field of view). Black arrows point to leukocyte infiltration within hepatic parenchyma. Black scale bar, 100 µm. D: quantified by a stereological method at ×60 magnification by observers blinded to treatment groups. Bar diagram represents the analysis of 15 fields of view in each liver section (n, WT-Veh, 3, WT-LPS/GalN, 6; P2Y2-Veh, 3; P2Y2-LPS/GalN, 3). E: representative F4/80-stained liver sections (×20 field of view). Black arrows point to macrophage infiltration. Black scale bar, 100 µm. Total protein extracts of livers harvested at 1 h (FG) and 5 h (HI) post-LPS-GalN were analyzed by Western blotting with antibodies specific for MMP-9 and α-tubulin (protein loading control; n, WT-Veh, 3, WT-LPS/GalN, 4; P2Y2-Veh, 3; P2Y2-LPS/GalN, 4). Bar diagrams represent relative expression. Means ± SD, *P < 0.05, ***P < 0.001, ****P < 0.0001, #P = 0.05. n, number of biological replicates. Veh, vehicle.
Figure 2.
Figure 2.
LPS/GalN-mediated induction of JNK signaling and hepatic inflammation is attenuated in P2Y2−/− mice. Total protein extracts of livers harvested at 1 h (A and B) and 5 h (C and D) post-LPS-GalN were analyzed by Western blotting with antibodies specific for phospho-JNK, total JNK, and β-actin (protein loading control; n, WT-Veh, 3, WT-LPS/GalN, 4; P2Y2-Veh, 3; P2Y2-LPS/GalN, 4). EJ: qRT-PCR analysis of total RNA isolated from the livers post-LPS/GalN at 1 h: TNFα, IL1β, MIP2; post-LPS/GalN at 5 h: MCP1, ICAM, iNOS (n, WT-Veh, 5, WT-LPS/GalN, 5; P2Y2-Veh, 7; P2Y2-LPS/GalN, 7–9). Bar diagrams represent relative expression. Means ± SD, *P < 0.05, **P < 0.01, ***P < 0.001, ****P < 0.0001. n, number of biological replicates. Veh, vehicle; WT, wild type.
Figure 3.
Figure 3.
LPS/GalN-mediated induction of hepatocyte apoptosis is attenuated in P2Y2−/− mice. A: representative images of liver sections after TUNEL staining (×40 field of view; 5 h post-LPS/GalN). White arrows, apoptotic nuclei. White scale bar, 50 µm. B: bar diagram represents the percentage of TUNEL-positive nuclei, based on the analysis of 10 fields of view (×40) in each liver section (n, WT-Veh, 5, WT-LPS/GalN, 8; P2Y2-Veh, 5; P2Y2-LPS/GalN, 8). C and D: total protein extracts of livers harvested at 5 h post-GalN/LPS were analyzed by Western blotting for Cleaved PARP-1 and α-tubulin (protein loading control). Bar diagram represents relative expression (n, WT-Veh, 3; WT-LPS/GalN, 4; P2Y2-Veh, 3; P2Y2-LPS/GalN, 4). E: Kaplan–Meier curve representing percentage survival of WT vs. P2Y2−/− after LPS/GalN treatment (n, 16–17). Means ± SD, *P < 0.05, ***P < 0.001. n, number of biological replicates.
Figure 4.
Figure 4.
P2Y2−/− mice are protected from sepsis-induced systemic inflammation and liver injury. WT and P2Y2−/− mice were subjected to CLP or sham surgery, and the liver and blood were harvested at 21 h post-CLP. A: representative images of H&E-stained liver sections, ×20 field of view. White arrow points to hemorrhagic necrosis and black arrows point to immune cell infiltrates. Black scale bar, 100 µm. B: serum ALT (n, WT-Sham, 4; WT-CLP, 12; P2Y2-Sham, 3; P2Y2-CLP, 5). C: serum bilirubin (n, WT-Sham, 4; WT-CLP, 12: P2Y2-Sham, 3; P2Y2-CLP, 6). D: representative liver sections stained for CD45+ leukocytes (×20 field of view). Black arrows point to leukocyte infiltration within hepatic parenchyma. Black scale bar, 100 µm. E: quantified by a stereological method at ×20 magnification by observers blinded to treatment groups. Bar diagram represents the analysis of five fields of view in each liver section (n, WT-Sham, 3, WT-CLP, 6; P2Y2-Sham, 3; P2Y2-CLP, 6). F: representative F4/80-stained liver sections (×20 field of view). Black arrows point to macrophage infiltration. Black scale bar, 100 µm. GJ: total protein extracts isolated from the livers harvested after CLP were analyzed by Western blotting with antibodies specific for iNOS (12 h post-CLP), NLRP3 (21 h post-CLP), GAPDH (protein loading control; n, WT-Sham, 3; WT-CLP, 4; P2Y2-Sham, 3; P2Y2-CLP, 4). Bar diagrams represent relative expression. KP: multiplex assay of serum cytokines, TNFα, IL6, IL1β, IL10, MCP1, MKC (n, WT-Sham, 6; WT-CLP, 9–16; P2Y2-Sham, 6; P2Y2-CLP, 5–14). Means ±SD, *P < 0.05, **P < 0.01, ***P < 0.001, ****P < 0.0001. n, number of biological replicates. CLP, cecal ligation and puncture; WT, wild type.
Figure 5.
Figure 5.
P2Y2 purinergic receptor antagonist pretreatment attenuates LPS-mediated induction of cytokine (IL-6, IL-10) and chemokine (MCP1/CCL2) release from Raw264.7 macrophages in vitro. Raw264.7 macrophages were treated with LPS (100 ng/mL) for 7.5 h or pretreated with Vehicle (0.2% DMSO) or AR-C (50 µM, P2Y2 purinergic receptor antagonist) for 30 min before LPS treatment. AF: multiplex assay for the cytokine and chemokine levels in the cell culture supernatants, MCP-1, IL-6, IL-10, TNFα, GM-CSF, IL-2 (n, Veh, 3; AR-C, 3; Veh + LPS, 3; AR-C+LPS, 3). Means ±SD, *P < 0.05, **P < 0.01, ***P < 0.001, ****P < 0.0001. n, number of biological replicates.
Figure 6.
Figure 6.
P2Y2 purinergic receptor antagonist pretreatment of Raw264.7 macrophages inhibits macrophage-mediated induction of iNOS and apoptosis in AML12 hepatocytes in vitro. Raw264.7 macrophages were treated with LPS (100 ng/mL) for 7.5 h or pretreated with Vehicle (Veh, 0.2% DMSO) or AR-C (50 µM, P2Y2 purinergic receptor antagonist) for 30 min before LPS treatment. AML-12 hepatocytes were treated with macrophage culture supernatant (conditioned media) for 30 h, and total protein extracts of AML-12 hepatocytes were analyzed by Western blotting with antibodies (A and B) specific for iNOS and β-actin (protein loading control; n, Veh, 3; AR-C, 3; Veh+LPS, 3; AR-C+LPS, 3). CE: antibodies specific for cleaved PARP-1, cleaved Caspase-3, and β-actin [n, Untreated (Un), 3; Veh, 3; Veh +LPS, 3; AR-C+LPS, 3]. Bar diagrams represent relative expression. Means ± SD, *P < 0.05, **P < 0.01, ***P < 0.001, ****P < 0.0001. n, number of biological replicates.
Figure 7.
Figure 7.
P2Y2−/− mice are protected from sepsis-induced depletion of serum arginine and dysregulation of amino acid homeostasis. WT and P2Y2−/− mice were subjected to CLP or sham surgery and blood harvested at 21 h post-CLP was subjected to serum amino acid profiling by liquid chromatography-mass spectrometry (LC-MS). Data are represented by Box and Whisker plots representing the amino acids with a significant change in their relative abundance (P < 0.05) arginine (A), ornithine (B), proline (C), isoleucine/leucine (D), and asparagine (E). Data were log2 transformed and normalized by an isotopically spiked internal standard (n, WT-Sham, 3; WT-CLP, 9; P2Y2-Sham, 3; P2Y2-CLP, 9), *P < 0.05, **P < 0.01, ***P < 0.001, ****P < 0.0001. n, number of biological replicates. CLP, cecal ligation and puncture; WT, wild type.
Figure 8.
Figure 8.
Bacterial translocation, bacteremia, and mortality are attenuated in P2Y2−/−. Comparison of bacterial load expressed in colony-forming units per milliliter (CFU/mL) in peritoneal lavage fluid (A) and blood (B) at 6, 12, and 21 h post-CLP. (Peritoneal lavage fluid: n, WT, 4–9; P2Y2−/−, 6–10; Blood: n, WT, 6–8; P2Y2−/−, 5–8.) Data are represented by Box and Whisker plots, *P < 0.05, #P = 0.07, ##P = 0.06, ###P = 0.10. C: Kaplan–Meier 7-day survival curves. Log-rank (Mantel-Cox) analysis ****P < 0.0001 (n, WT-sham, 6, WT-CLP, 10; P2Y2-Sham, 6, P2Y2-CLP, 10). n, number of biological replicates. CLP, cecal ligation and puncture; WT, wild type.
Figure 9.
Figure 9.
Schematic representation of P2Y2 purinergic receptor-mediated potentiation of inflammatory liver injury, serum arginine depletion, immune dysfunction, bacteremia, and poor survival in polymicrobial sepsis.

References

    1. Reinhart K, Daniels R, Kissoon N, Machado FR, Schachter RD, Finfer S. Recognizing sepsis as a global health priority - a WHO resolution. N Engl J Med 377: 414–417, 2017. doi:10.1056/NEJMp1707170. - DOI - PubMed
    1. Ledderose C, Bao Y, Kondo Y, Fakhari M, Slubowski C, Zhang J, Junger WG. Purinergic signaling and the immune response in sepsis: a review. Clin Ther 38: 1054–1065, 2016. doi:10.1016/j.clinthera.2016.04.002. - DOI - PMC - PubMed
    1. Corriden R, Insel PA. Basal release of ATP: an autocrine-paracrine mechanism for cell regulation. Sci Signal 3: re1, 2010. doi:10.1126/scisignal.3104re1. - DOI - PMC - PubMed
    1. Dosch M, Gerber J, Jebbawi F, Beldi G. Mechanisms of ATP release by inflammatory cells. Int J Mol Sci 19: 1222, 2018. doi:10.3390/ijms19041222. - DOI - PMC - PubMed
    1. Junger WG. Immune cell regulation by autocrine purinergic signalling. Nat Rev Immunol 11: 201–212, 2011. doi:10.1038/nri2938. - DOI - PMC - PubMed

Publication types

LinkOut - more resources